Time-restricted feeding is a preventative and therapeutic intervention against diverse nutritional challenges - PubMed (original) (raw)
Time-restricted feeding is a preventative and therapeutic intervention against diverse nutritional challenges
Amandine Chaix et al. Cell Metab. 2014.
Abstract
Because current therapeutics for obesity are limited and only offer modest improvements, novel interventions are needed. Preventing obesity with time-restricted feeding (TRF; 8-9 hr food access in the active phase) is promising, yet its therapeutic applicability against preexisting obesity, diverse dietary conditions, and less stringent eating patterns is unknown. Here we tested TRF in mice under diverse nutritional challenges. We show that TRF attenuated metabolic diseases arising from a variety of obesogenic diets, and that benefits were proportional to the fasting duration. Furthermore, protective effects were maintained even when TRF was temporarily interrupted by ad libitum access to food during weekends, a regimen particularly relevant to human lifestyle. Finally, TRF stabilized and reversed the progression of metabolic diseases in mice with preexisting obesity and type II diabetes. We establish clinically relevant parameters of TRF for preventing and treating obesity and metabolic disorders, including type II diabetes, hepatic steatosis, and hypercholesterolemia.
Copyright © 2014 Elsevier Inc. All rights reserved.
Figures
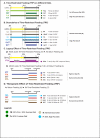
Figure 1. Experimental design
A-D. Schematic representation of the feeding groups used in this study. The diet, the food access interval, and the lighting schedule are shown. The color code and abbreviations are indicated. Legends show the four diets used in this study. See also supplemental methods for details
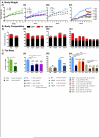
Figure 2. Time-restricted feeding prevents and reverses body weight gain upon different nutritional challenges
A. Body weight curve for each experimental cohort (see Fig 1, Fig S1 and experimental procedures for cohort description). The number of mice (n) analyzed per group was (i-ii) n=16, (iii) n=12, and (iv) n=32 then 16. B. Body composition of mice in each feeding group at the end of the study, and corresponding C. total fat mass as a percent of total body weight. The percentage reduction of fat mass compared to ad libitum fed controls is indicated. (i-ii) n=4 and (iii-iv) n=8. Data are presented as mean ± SEM. *p < 0.05, **p < 0.01, ***p < 0.001 versus all other groups or versus the ad libitum fed control group as indicated.
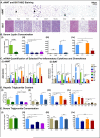
Figure 3. Time-restricted feeding reduces whole body fat accumulation and associated inflammation
A. Representative H&E stained histological sections of epididymal white adipose tissue (eWAT; upper panels) and brown adipose tissue (BAT; lower panels) in the different feeding conditions, as indicated. Arrowheads point to crown structures. B. Serum leptin concentration. The number of mice (n) analyzed per group was (i) n=10, (ii) n=8, (iii) n=6, and (iv) n=7. C. Quantitative polymerase chain reaction (qPCR) analysis of selected pro-inflammatory cytokines (TNFa, IL10, IL1) and chemokine (Ccl8) mRNA expression in (i) eWAT and (ii) BAT. N= pool of 6-8 samples per feeding group. See methods for details. D. Hepatic triglyceride content. (i) n=6, (ii-iv) n=12. E. Serum triglyceride concentration. (i) n=10, (ii-iv) n=6. Data are presented as mean ± SEM. t-test, *p < 0.05, **p < 0.01, ***p < 0.001.
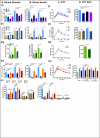
Figure 4. Time-restricted feeding improves glucose tolerance and reduces insulin resistance
A. Serum glucose concentration in the different experimental groups (vertical panels, A(i)-A(iv)) and corresponding B. serum insulin concentration (B(i)-(iv)) in fasted (ZT22-ZT38) and refed animals (1 hour after glucose intraperitoneal injection (1mg/g BW) at ZT37). For each condition, 4-10 mice were analyzed. C. Glucose tolerance tests (GTT) in the different experimental groups and corresponding D- area under the curve (AUC). 8 mice per group were analyzed. Data are presented as mean ± SEM. t-test, *p < 0.05, **p < 0.01, ***p < 0.001.
Figure 5. Time-restricted feeding improves nutrient homeostasis
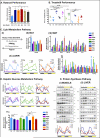
A. Time on an accelerated rotarod (n=6 mice per group). B. Time on a treadmill during a run-to-exhaustion assay. Each dot represents one mouse. C. Schematic (i) and qPCR analysis of lipid metabolism genes Acaca, Fasn,Ppgc1a, Pparg, Pcx, Elovl3, Elovl5 mRNA expression in BAT (ii), eWAT (iii), and liver (iv). N= pool of 6-8 samples per group. D. qPCR analysis of hepatic mRNA expression of the glucose metabolism pathway genes gck, g6pase, pcx. Results are shown as pooled throughout a circadian time-course or as a double-plotted temporal profile. N= pool of 12 samples per group for pooled data or two mice per time point for temporal profile. E. Representative scans (top) of western blots showing the temporal expression (total S6) and activation (phospho-Serine 235/236) profiles of the ribosomal protein S6 in muscle (i) and liver (ii). Level of phospho-S6 were quantified using ImageJ from two independent mice per time-point and double plotted (bottom panels). Data are presented as mean ± SEM. t-tests, *p < 0.05, **p < 0.01, ***p < 0.001 as indicated.
Figure 6. Quantitative and temporal changes in the serum metabolome reflect the whole-body beneficial effect of time-restricted feeding
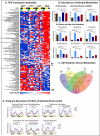
A. Heatmap representation of 114 metabolites that exhibit a statistically significantly change (p<0.05) between the super group “TRF fed mice” (NTT, FTT, FAT) and the group “ALF fed mice” (FAA). Lighting regimen is depicted in black and yellow and food access in green. B. Serum abundance (median normalized) of (i) carnosine, (ii) pro-inflammatory lipids arachidonate (AA) and docosapentaenoic acid (22:5 n6) (n6DPA), and (iii) sterol pathway and bile acid pathway components campesterol, cholestanol, cholesterol, corticosterone, taurocholate, and taurochenodeoxycholate. Data are presented as mean ± SEM. t-tests, *p < 0.05, **p < 0.01, ***p < 0.001 as indicated. C. Venn diagram representation of 24-hour rhythmic serum metabolites identified by JTK_CYCLE (t<0.05) (Hughes et al., 2010). D. Temporal abundance profiles of serum metabolites belonging to the indicated amino acid pathway.
Figure 7. Time-restricted feeding restores cholesterol homeostasis
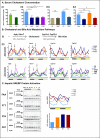
A. Serum cholesterol concentration in the different feeding groups. The number of mice (n) analyzed per group was (i) n=10, and (ii-iv) n=6. B. (i) Schematic and (ii) hepatic qPCR analysis of cholesterol and bile acids metabolism enzymes Sqle, Dhcr7, Cyp7a1 and Cyp7b1. Data are shown as a double-plot showing the temporal expression profile at different times of the day (n=2 mice per time point per group). C. Representative western blots depicting the protein temporal expression profile (upper band) and activation profile (shorter cleaved form) of the sterol regulatory element binding protein (SREBP) in the liver. Level of active SREBP (cleaved short form) was quantified using ImageJ from two independent mice per time-point and double plotted (right panel). Data are presented as mean ± SEM. *p < 0.05, **p < 0.01, ***p < 0.001 versus the ad libitum fed control group as indicated.
Similar articles
- Time-restricted feeding improves insulin resistance and hepatic steatosis in a mouse model of postmenopausal obesity.
Chung H, Chou W, Sears DD, Patterson RE, Webster NJ, Ellies LG. Chung H, et al. Metabolism. 2016 Dec;65(12):1743-1754. doi: 10.1016/j.metabol.2016.09.006. Epub 2016 Sep 22. Metabolism. 2016. PMID: 27832862 Free PMC article. - Time-restricted feeding on weekdays restricts weight gain: A study using rat models of high-fat diet-induced obesity.
Olsen MK, Choi MH, Kulseng B, Zhao CM, Chen D. Olsen MK, et al. Physiol Behav. 2017 May 1;173:298-304. doi: 10.1016/j.physbeh.2017.02.032. Epub 2017 Feb 24. Physiol Behav. 2017. PMID: 28242469 - Time-restricted feeding for prevention and treatment of cardiometabolic disorders.
Melkani GC, Panda S. Melkani GC, et al. J Physiol. 2017 Jun 15;595(12):3691-3700. doi: 10.1113/JP273094. Epub 2017 Apr 25. J Physiol. 2017. PMID: 28295377 Free PMC article. Review. - Impact of intermittent fasting on health and disease processes.
Mattson MP, Longo VD, Harvie M. Mattson MP, et al. Ageing Res Rev. 2017 Oct;39:46-58. doi: 10.1016/j.arr.2016.10.005. Epub 2016 Oct 31. Ageing Res Rev. 2017. PMID: 27810402 Free PMC article. Review. - Controlling access time to a high-fat diet during the inactive period protects against obesity in mice.
Haraguchi A, Aoki N, Ohtsu T, Ikeda Y, Tahara Y, Shibata S. Haraguchi A, et al. Chronobiol Int. 2014 Oct;31(8):935-44. doi: 10.3109/07420528.2014.931413. Epub 2014 Jul 1. Chronobiol Int. 2014. PMID: 24984029
Cited by
- Prolonged Nightly Fasting and Breast Cancer Prognosis.
Marinac CR, Nelson SH, Breen CI, Hartman SJ, Natarajan L, Pierce JP, Flatt SW, Sears DD, Patterson RE. Marinac CR, et al. JAMA Oncol. 2016 Aug 1;2(8):1049-55. doi: 10.1001/jamaoncol.2016.0164. JAMA Oncol. 2016. PMID: 27032109 Free PMC article. - Intermittent Fasting and Metabolic Health: From Religious Fast to Time-Restricted Feeding.
Hoddy KK, Marlatt KL, Çetinkaya H, Ravussin E. Hoddy KK, et al. Obesity (Silver Spring). 2020 Jul;28 Suppl 1(Suppl 1):S29-S37. doi: 10.1002/oby.22829. Obesity (Silver Spring). 2020. PMID: 32700827 Free PMC article. Review. - Effects of Feeding Time on Markers of Muscle Metabolic Flexibility Following Acute Aerobic Exercise in Trained Mice Undergoing Time Restricted Feeding.
Persinger A, Butawan M, Faietti M, Pryke A, Rose K, van der Merwe M, Bloomer RJ, Puppa MJ. Persinger A, et al. Nutrients. 2021 May 19;13(5):1717. doi: 10.3390/nu13051717. Nutrients. 2021. PMID: 34069449 Free PMC article. - The changing microbial landscape of Western society: Diet, dwellings and discordance.
Broussard JL, Devkota S. Broussard JL, et al. Mol Metab. 2016 Jul 21;5(9):737-42. doi: 10.1016/j.molmet.2016.07.007. eCollection 2016 Sep. Mol Metab. 2016. PMID: 27617196 Free PMC article. Review. - Circadian rhythms as modulators of brain health during development and throughout aging.
Van Drunen R, Eckel-Mahan K. Van Drunen R, et al. Front Neural Circuits. 2023 Jan 19;16:1059229. doi: 10.3389/fncir.2022.1059229. eCollection 2022. Front Neural Circuits. 2023. PMID: 36741032 Free PMC article. Review.
References
- Anderson JW, Konz EC, Frederich RC, Wood CL. Long-term weight-loss maintenance: a meta-analysis of US studies. Am J Clin Nutr. 2001;74:579–584. - PubMed
- Boldyrev AA, Aldini G, Derave W. Physiology and pathophysiology of carnosine. Physiol Rev. 2013;93:1803–1845. - PubMed
- Bray GA, Ryan DH. Update on obesity pharmacotherapy. Ann N Y Acad Sci. 2014;1311:1–13. - PubMed
Publication types
MeSH terms
Substances
Grants and funding
- R24 DK080506/DK/NIDDK NIH HHS/United States
- NS066457/NS/NINDS NIH HHS/United States
- R21 NS066457/NS/NINDS NIH HHS/United States
- T32 DK07202/DK/NIDDK NIH HHS/United States
- T32 DK007202/DK/NIDDK NIH HHS/United States
- S10 RR027450/RR/NCRR NIH HHS/United States
- R01 DK091618/DK/NIDDK NIH HHS/United States
- EY016807/EY/NEI NIH HHS/United States
- DK091618-04/DK/NIDDK NIH HHS/United States
- P30 EY019005/EY/NEI NIH HHS/United States
- P50 GM085764/GM/NIGMS NIH HHS/United States
- R01 EY016807/EY/NEI NIH HHS/United States
- P30 CA014195/CA/NCI NIH HHS/United States
LinkOut - more resources
Full Text Sources
Other Literature Sources
