Tissue-resident macrophage enhancer landscapes are shaped by the local microenvironment - PubMed (original) (raw)
Tissue-resident macrophage enhancer landscapes are shaped by the local microenvironment
Yonit Lavin et al. Cell. 2014.
Abstract
Macrophages are critical for innate immune defense and also control organ homeostasis in a tissue-specific manner. They provide a fitting model to study the impact of ontogeny and microenvironment on chromatin state and whether chromatin modifications contribute to macrophage identity. Here, we profile the dynamics of four histone modifications across seven tissue-resident macrophage populations. We identify 12,743 macrophage-specific enhancers and establish that tissue-resident macrophages have distinct enhancer landscapes beyond what can be explained by developmental origin. Combining our enhancer catalog with gene expression profiles and open chromatin regions, we show that a combination of tissue- and lineage-specific transcription factors form the regulatory networks controlling chromatin specification in tissue-resident macrophages. The environment is capable of shaping the chromatin landscape of transplanted bone marrow precursors, and even differentiated macrophages can be reprogrammed when transferred into a new microenvironment. These results provide a comprehensive view of macrophage regulatory landscape and highlight the importance of the microenvironment, along with pioneer factors in orchestrating identity and plasticity.
Copyright © 2014 Elsevier Inc. All rights reserved.
Figures
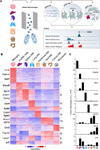
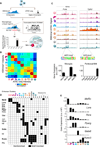
Figure 1. Tissue-Resident Macrophages Can Be Distinguished by Expression Patterns
(A) Schematic for defining the global regulatory elements of tissue-resident macrophages, monocytes, and neutrophils isolated by the gating strategy (Data S1) and analyzed by sequencing data from high-throughput RNA-seq, ChIP-seq, and ATAC-seq. A representative genome browser output is shown. (B) K-means clustering (K = 11) of 3,348 differentially expressed genes in macrophages (MΦ) and monocytes. (C) Bar graphs of individual gene expression in arbitrary units (a.u.). Error bars indicate SEM. See also Figure S1, Table S1, and Experimental Procedures.
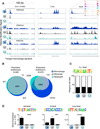
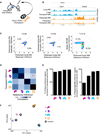
Figure 2. Comparing the Chromatin Landscape of Myeloid Cells Reveals Macro-phage-Specific Enhancers
(A) Normalized profiles of H3K4me3, H3K4me1, and H3K27ac signal in 100 kilobase pair (kb) regions for monocytes, neutrophils, and “merged” macrophage signature of seven tissue-resident populations. (B) Venn diagrams of the overlap of promoters (10,806; left) and enhancers (30,976; right) among macrophages, monocytes, and neutrophils. (C) Representative motif of PU.1 enriched in H3K4me1-marked regions shared by all myeloid cell types (p = 10−6) and percentage of regions with the motif in each cell type. (D) Representative motifs of the indicated TF families found enriched in cell-type-specific H3K4me1-marked regions (p ≤ 10−5). Gene expression (a.u.) of the implicated family member. Error bars indicate SEM. See also Figure S2 and Table S2.
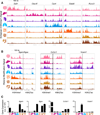
Figure 3. Tissue-Resident Macrophage Populations Have Unique Poised and Active Enhancers
(A) Normalized profiles of H3K4me1 signal for seven tissue-resident macrophage populations in 100 kb regions containing tissue-specific enhancers around the indicated genes. (B) Normalized profiles of H3K27ac (right) signal in H3K4me1-marked (left) 100 kb regions containing the indicated genes. (C) Bar graphs of expression (a.u.) for genes in loci of (B). Error bars indicate SEM. See also Figure S4.
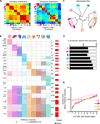
Figure 4. Tissue-Resident Macrophages Have Distinct Sets of Enhancers Determined by Ontogeny and Microenvironment
(A) Pairwise correlations between replicates with respect to H3K4me3 read density in promoters (left) and H3K4me1 read density in enhancers (right). (B) K-means clustering (K = 20) of the H3K4me1 intensity in 30,976 high-confidence enhancer regions. The proportion of enhancers active (H3K27ac high) in at least one sample in each cluster is shown in red (right bar). (C) Hierarchical tree resulting from clustering on H3K4me1 intensity in enhancer regions. (D) Percentage of H3K4me1-marked regions in monocytes shared with each tissue-resident macrophage. (E) Line plots showing that enhancer activity level (mean H3K27ac intensity) increases with the number of samples that share the H3K4me1-marked regions. See also Figures S3 and S4 and Table S3.
Figure 5. Identification of Candidate Regulators in Tissue-Resident Macrophage Enhancers Using ATAC-Seq
(A) Schematic of pipeline to identify candidate regulators of enhancers. For each cluster, enhancers are matched to ATAC-seq peaks, genomic sequence is lifted for input into the motif finder, and the enriched motif is matched to the TF family member with corresponding expression. (B) Pairwise correlations between H3K4me1 and ATAC-seq intensity in enhancer regions. (C) Normalized profiles of H3K4me1 signal in 100 kb regions with ATAC-seq peaks overlaid in black, containing tissue-specific enhancers around the indicated genes. Shaded regions indicate location of the relevant motif. Bar graphs of gene expression (a.u.) for TF family members of Mef2 in microglia and Gata in peritoneal macrophages. Error bars indicate SEM. (D) Heatmap of significantly enriched motifs (p ≤ 10−5) in H3K4me1-marked regions from each cluster in Figure 4B (see Table S4). (E) Bar graphs show gene expression (a.u.) for candidate TFs that match motifs in (D). Error bars indicate SEM. See also Figure S5 and Table S4.
Figure 6. Microenvironment Signals Shape the Enhancer Landscape of Adult Bone-Marrow-Derived Macrophages
(A) Schematic of bone marrow transplant experiment. (B) Normalized profiles of H3K4me1signal of reference macrophages and transplant-derived macrophages both showing tissue-specific enhancers around Car4 and Gata6 in 100 kb regions. (C) Density scatterplots of H3K4me1 intensity in H3K4me1-marked regions for reference peritoneal macrophages (x axis) between replicates (left), compared to peritoneal transplant-derived macrophages (middle), or spleen transplant-derived macrophages (right). Regions of 2-fold differential (pink lines) and Pearson’s correlation between samples are indicated. (D) Pairwise correlations between transplant and reference macrophages with respect to H3K4me1 intensity in original and novel enhancers. The single asterisk (*) and double asterisk (**) correspond to the data shown in the respective plots from (C). (E) Percent of total (left) or tissue-specific (right) reference macrophage H3K4me1-marked regions recovered by transplant-derived macrophages. (F) PCA of H3K4me1 intensity showing transplanted macrophages group with their respective reference macrophages. See also Figure S6.
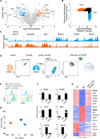
Figure 7. Differentiated Tissue-Resident Macrophages Are Reprogrammed by a New Microenvironment
(A) Volcano plot of relative expression in peritoneal (PM; right) and lung (LM; left) macrophages with differential (> 4-fold), statistically significant (p < 0.01) genes indicated in orange and blue, respectively. (B) Scatterplot comparing intensity in H3K4me1-marked regions with differential PM (orange) and LM (blue) enhancers indicated. (C) Normalized profiles of H3K4me1 signal of PM and LM in 100 kb regions. (D) Schematic of transplant experiment: representative FACS plot of purified CD45.1+ PM prior to transfer and retrieved from host CD45.2+ lung. (E–H) Resident LM, PM, and transferred macrophages recovered from the host lung tissue (PM > lung transfer) were analyzed by flow cytometry (E) and qRT-PCR (F). Error bars indicate SEM. RNA-seq from transferred macrophages was compared to reference macrophages for 1,014 differential genes sorted in a heatmap (G) and analyzed by PCA (H). See also Figure S7 and Table S5.
Comment in
- Environmentally-defined enhancer populations regulate diversity of tissue-resident macrophages.
Bulger M, Palis J. Bulger M, et al. Trends Immunol. 2015 Feb;36(2):61-2. doi: 10.1016/j.it.2014.12.002. Epub 2015 Jan 7. Trends Immunol. 2015. PMID: 25575465 Free PMC article.
Similar articles
- Environment drives selection and function of enhancers controlling tissue-specific macrophage identities.
Gosselin D, Link VM, Romanoski CE, Fonseca GJ, Eichenfield DZ, Spann NJ, Stender JD, Chun HB, Garner H, Geissmann F, Glass CK. Gosselin D, et al. Cell. 2014 Dec 4;159(6):1327-40. doi: 10.1016/j.cell.2014.11.023. Cell. 2014. PMID: 25480297 Free PMC article. - Chromatin proteomics reveals novel combinatorial histone modification signatures that mark distinct subpopulations of macrophage enhancers.
Soldi M, Mari T, Nicosia L, Musiani D, Sigismondo G, Cuomo A, Pavesi G, Bonaldi T. Soldi M, et al. Nucleic Acids Res. 2017 Dec 1;45(21):12195-12213. doi: 10.1093/nar/gkx821. Nucleic Acids Res. 2017. PMID: 28981749 Free PMC article. - The role of chromatin dynamics in immune cell development.
Winter DR, Amit I. Winter DR, et al. Immunol Rev. 2014 Sep;261(1):9-22. doi: 10.1111/imr.12200. Immunol Rev. 2014. PMID: 25123274 Review. - Immunogenetics. Chromatin state dynamics during blood formation.
Lara-Astiaso D, Weiner A, Lorenzo-Vivas E, Zaretsky I, Jaitin DA, David E, Keren-Shaul H, Mildner A, Winter D, Jung S, Friedman N, Amit I. Lara-Astiaso D, et al. Science. 2014 Aug 22;345(6199):943-9. doi: 10.1126/science.1256271. Epub 2014 Aug 7. Science. 2014. PMID: 25103404 Free PMC article. - Epigenomics of macrophages.
Gosselin D, Glass CK. Gosselin D, et al. Immunol Rev. 2014 Nov;262(1):96-112. doi: 10.1111/imr.12213. Immunol Rev. 2014. PMID: 25319330 Free PMC article. Review.
Cited by
- Macrophages and Their Organ Locations Shape Each Other in Development and Homeostasis - A Drosophila Perspective.
Mase A, Augsburger J, Brückner K. Mase A, et al. Front Cell Dev Biol. 2021 Mar 11;9:630272. doi: 10.3389/fcell.2021.630272. eCollection 2021. Front Cell Dev Biol. 2021. PMID: 33777939 Free PMC article. Review. - Mechanisms of Macrophage Plasticity in the Tumor Environment: Manipulating Activation State to Improve Outcomes.
Ricketts TD, Prieto-Dominguez N, Gowda PS, Ubil E. Ricketts TD, et al. Front Immunol. 2021 May 7;12:642285. doi: 10.3389/fimmu.2021.642285. eCollection 2021. Front Immunol. 2021. PMID: 34025653 Free PMC article. Review. - Immunometabolism of Tissue-Resident Macrophages - An Appraisal of the Current Knowledge and Cutting-Edge Methods and Technologies.
Zago G, Saavedra PHV, Keshari KR, Perry JSA. Zago G, et al. Front Immunol. 2021 May 7;12:665782. doi: 10.3389/fimmu.2021.665782. eCollection 2021. Front Immunol. 2021. PMID: 34025667 Free PMC article. Review. - Dysfunction of macrophages leads to diabetic bone regeneration deficiency.
Shen Y, Zhang Y, Zhou Z, Wang J, Han D, Sun J, Chen G, Tang Q, Sun W, Chen L. Shen Y, et al. Front Immunol. 2022 Oct 14;13:990457. doi: 10.3389/fimmu.2022.990457. eCollection 2022. Front Immunol. 2022. PMID: 36311779 Free PMC article. Review. - Contribution of Tregs to the promotion of constructive remodeling after decellularized extracellular matrix material implantation.
Jiang H, Sun X, Wu Y, Xu J, Xiao C, Liu Q, Fang L, Liang Y, Zhou J, Wu Y, Lin Z. Jiang H, et al. Mater Today Bio. 2024 Jul 9;27:101151. doi: 10.1016/j.mtbio.2024.101151. eCollection 2024 Aug. Mater Today Bio. 2024. PMID: 39104900 Free PMC article.
References
- Abutbul S, Shapiro J, Szaingurten-Solodkin I, Levy N, Carmy Y, Baron R, Jung S, Monsonego A. TGF-β signaling through SMAD2/3 induces the quiescent microglial phenotype within the CNS environment. Glia. 2012;60:1160–1171. - PubMed
- Aziz A, Soucie E, Sarrazin S, Sieweke MH. MafB/c-Maf deficiency enables self-renewalof differentiated functional macrophages. Science. 2009;326:867–871. - PubMed
- Blecher-Gonen R, Barnett-Itzhaki Z, Jaitin D, Amann-Zalcenstein D, Lara-Astiaso D, Amit I. High-throughput chromatin immunopre-cipitation for genome-wide mapping of in vivo protein-DNA interactions and epigenomic states. Nat. Protoc. 2013;8:539–554. - PubMed
Publication types
MeSH terms
Substances
Grants and funding
- R01 AI104848/AI/NIAID NIH HHS/United States
- 340345/ERC_/European Research Council/International
- U01 AI095611/AI/NIAID NIH HHS/United States
- NIHR01CA173861/CA/NCI NIH HHS/United States
- R01 CA173861/CA/NCI NIH HHS/United States
- NIH R01CA154947A/CA/NCI NIH HHS/United States
- R01 CA154947/CA/NCI NIH HHS/United States
- P50 HG006193/HG/NHGRI NIH HHS/United States
- NIHR01AI104848/AI/NIAID NIH HHS/United States
- NHGRI 1P50HG006193/PHS HHS/United States
- NIHU01AI095611/AI/NIAID NIH HHS/United States
LinkOut - more resources
Full Text Sources
Other Literature Sources
Molecular Biology Databases
