Two-dimensional culture of human pancreatic adenocarcinoma cells results in an irreversible transition from epithelial to mesenchymal phenotype - PubMed (original) (raw)
doi: 10.1038/labinvest.2014.143. Epub 2014 Dec 8.
Ran Zhang 1, Rei Suzuki 2, Shao-qiang Li 3, David Roife 1, Mark J Truty 4, Deyali Chatterjee 5, Ryan M Thomas 6, James Cardwell 7, Yu Wang 8, Huamin Wang 9, Matthew H Katz 1, Jason B Fleming 1
Affiliations
- PMID: 25485535
- PMCID: PMC4670045
- DOI: 10.1038/labinvest.2014.143
Two-dimensional culture of human pancreatic adenocarcinoma cells results in an irreversible transition from epithelial to mesenchymal phenotype
Ya'an Kang et al. Lab Invest. 2015 Feb.
Abstract
Many commercially available cell lines have been in culture for ages, acquiring phenotypes that differ from the original cancers from which these cell lines were derived. Therefore, research on new cell lines could improve the success rates of translational research in cancer. We have developed methods for the isolation and culture of human pancreatic ductal adenocarcinoma (PDAC) cells from murine xenografts of human PDAC. We hypothesize that phenotypes of PDAC cells are modified by in vitro culture conditions over time and by in vivo implantation. Patient-derived xenografts were created in immunodeficient mice using surgically resected tumor specimens. These murine xenografts were then used to establish human PDAC cell lines in culture. Earlier (<5) passage and later (>20) passage cell lines were evaluated separately regarding proliferation, cell cycle, genetic mutations, invasiveness, chemosensitivity, tumorigenesis, epithelial-mesenchymal transition (EMT) status, and proteomics. Later passage cells accelerated their doubling time and colony formation, and were more concentrated in the G0/G1 phase and less in the G2/M checkpoint phase. Later passage cells were more sensitive to gemcitabine and 5-fluorouracil than earlier passage cells, but all four new cell lines were more chemo-resistant compared with commercial ATCC cell lines. EMT induction was observed when establishing and passaging cell lines in vitro and furthermore by growing them as subcutaneous tumors in vivo. This study demonstrates a novel approach to the establishment of PDAC cell lines and observes a process by which newly established cell lines undergo phenotypic changes during in vitro culture and in vivo tumorigenesis. This may help explain differences of treatment effects often observed between experiments conducted in vitro, in vivo, and in human clinical trials.
Conflict of interest statement
Conflict of interest: The authors declare no conflict of interest
Figures
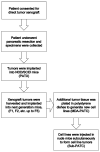
Figure 1. Summary of the methodological approach used for generating PDAC cell lines
Figure 2
Morphology of new PDAC lines growing in culture. Top panel represents cells in earlier passages (<5 passages), bottom panel shows cells grow pattern in later passages (>20 passages). Magnification 10×.
Figure 3
Immunohistochemical staining for SMAD4 was performed in (A) primary patient tumor tissue and (B) corresponding PATX tumors from generations F1, F2, and F3 in NOD/SCID mice. These were all stained concurrently in one tissue microarray slide. Staining was evaluated on ductal tumor cells. Patient 43, 50, and 66 had a deletion of SMAD4 which is supported by negative staining of tumor cells in the original tumor and all three generations of murine xenografts. Patient 53 was wild type for SMAD4, represented by positive staining of ductal cells in the original tumor and all three generations of murine xenografts. See Table 1 for corresponding sequencing results. Magnification 10×.
Figure 4
Comparison of MDA-PATC43, 50, 53, and 66 cell line proliferation between earlier and later passages. (A) Doubling time changes between earlier (<5) and later (>20) passages were assessed with serial MTT assays. Results are shown as Means ± S.D. and significance assessed via two-tailed t test (*P<0.05 and **P<0.01). (B) Flow cytometric analysis of cell cycle phase distribution comparing earlier and later passages in these four cell lines. (C) Flow cytometric cell cycle analysis of ATCC PDAC cell lines as a control. Cell cycle data collection and analysis was carried out by using CellQuest software. Assays were done thrice and in triplicate wells. The figure is a representative of three experiments with similar results.
Figure 5
Colony formation assay of MDA-PATC43, 50, 53, and 66 and control ATCC cell lines. (A) Colony formation ability of new cell lines during earlier and later passages. (B) Colony formation ability of commercial ATCC PDAC cell lines: PANC1, MiaPaCa-2, and BxPC-3. Cells were fixed and stained by crystal violet. Assays were done thrice and in triplicate wells. The figure is a representative of three experiments with similar results. Quantification was performed by manual counting.
Figure 6
In vitro cytotoxicity of gemcitabine and 5-FU in newly isolated cell lines. (A) Gemcitabine and (B) 5-fluorouracil was incubated with MDA-PATC43, MDA-PATC50, MDA-PATC53, and MDA-PATC66 cells during earlier and later passages. (C) Commercial PANC-1, MiaPaCa-2, and BxPC-3 cell lines were treated with the same doses of gemcitabine and 5-FU as a control. These cells were treated for 3 days in culture, and their viability was determined with MTT assays. Assays were done thrice and in triplicate wells. Bar graphs are shown as means ± S.D. and statistical analysis was performed by two-tailed t test (*P<0.05 and ***P<0.001).
Figure 7
Invasiveness and tumorigenic nature and of new PDAC lines. (A) Cell lines' invasive capacity was determined by a standard BD BioCoat™ Matrigel™ invasion assay. Invading cells of each cell line were counted in 3 different fields at 10× magnification after 22 hours of incubation. (B) All four MDA-PATC cell lines have the ability to form a progressively growing tumor after subcutaneous injection in athymic nude mice. Tumor sizes were monitored and recorded twice a week. Three mice were in each group. (C) Tumor volumes at 50 days growth. Bar graphs are shown Means ± S.D.
Figure 8
Representative H&E sections of (A) patient tumor, (B) patient xenograft tumor (PATX), and (C) subcutaneous cell line tumor (Sub-PATC). PATX tumors tended to preserve some ductal architecture found in patient tumors, while Sub-PATC tumors tended to be anaplastic. Magnification, 10×.
Figure 9
Proteomic concordance of patient xenograft tumors (PATX), cell lines (MDA-PATC), and cell line xenografts (Sub-PATC). (A, C, E, G) Lysates of PATX tumors, cell lines, and Sub-PATC tumors analyzed via reverse phase protein array showed close similarities in expression of most proteins. (B, D, F, H) Proportions of proteins expressed over or fewer than two-fold per ratio. See Table 2 for ratio labels.
Figure 10
Unsupervised clustering heatmaps of protein expression levels in PATX tumors, MDA-PATC cell lines, and Sub-PATC tumors. These reverse phase protein array results were generated in Cluster 3.0 as a hierarchical cluster using Pearson Correlation and a center metric. The resulting heatmap was visualized in Treeview.
Figure 11
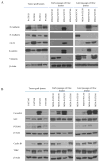
Western blot comparison of PATX tumors with early and later passage cell lines. (A) Relative protein expression levels of the epithelial and mesenchymal markers E-cadherin, N-cadherin, Vimentin, Cytokeratin-19, and β-catenin. β-Actin was used as a loading control. MDA-PATC43 showed increased expression of N-cadherin and Vimentin. MDA-PATC50 showed increased expression of CK19 and Vimentin. MDA-PATC53 maintained high expression of E-cadherin, CK19, and β-catenin. MDA-PATC 66 showed increased expression of E-cadherin, CK19, and Vimentin. (B) The relative protein expression levels of Caveolin-1, NF2, FoxM1, Cyclin B1, and Transferrin Receptor (TFRC). These were proteins found to be upregulated at least twofold on cell lines compared to the PATX tumors they were derived from, based on RPPA data (see Table 2). Caveolin-1, NF2, and TFRC were generally increased in cell lines compared to PATX tumors. FoxM1 decreased in early passage cell lines but then was re-expressed in later cell lines. Cyclin B1 was lost in early passage MDA-PATC53, but was re-expressed in later passages, while the three other cell lines continued to increase expression compared to PATX tumors.
Figure 12
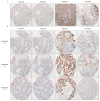
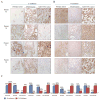
Immunohistochemical evaluation of EMT related markers in primary patient tumors, PATX tumors, and Sub-PATC tumors. (A) E-cadherin and (B) N-cadherin expression on tumor cells was evaluated. (C) Percentages of positive tumor cells per slide were quantified by pathologists. E-cadherin persisted in patient and PATX tumors, but was weak in Sub-PATC tumors. N-cadherin was variably expressed in patient and PATX tumors, but significantly increased in Sub-PATC tumors. Magnification, 10×.
Figure 13
Further immunohistochemical evaluation of EMT related markers in primary patient tumors, PATX tumors, and Sub-PATC tumors. Expression of (A) Vimentin, (B) Cytokeratin-19, and (C) β-catenin was evaluated. The lowest panel displays percentages of positive tumor cells per slide as determined by pathologists. For Patients 43, 50, and 66, vimentin was negligible in patient and PATX tumors, but became strongly expressed in Sub-PATC tumors. CK19 was highly expressed in PATX tumors, but substantially decreased in Sub-PATC tumors. β-catenin staining was also intense in PATX tumors, and significantly weaker in Sub-PATC tumors. For Patient 53, all three tumor types showed little Vimentin and strong expression of CK19 and β-catenin. Magnification 10×.
Similar articles
- Anterior gradient 2 downregulation in a subset of pancreatic ductal adenocarcinoma is a prognostic factor indicative of epithelial-mesenchymal transition.
Mizuuchi Y, Aishima S, Ohuchida K, Shindo K, Fujino M, Hattori M, Miyazaki T, Mizumoto K, Tanaka M, Oda Y. Mizuuchi Y, et al. Lab Invest. 2015 Feb;95(2):193-206. doi: 10.1038/labinvest.2014.138. Epub 2014 Nov 24. Lab Invest. 2015. PMID: 25418581 - The long non-coding RNA HOTTIP promotes progression and gemcitabine resistance by regulating HOXA13 in pancreatic cancer.
Li Z, Zhao X, Zhou Y, Liu Y, Zhou Q, Ye H, Wang Y, Zeng J, Song Y, Gao W, Zheng S, Zhuang B, Chen H, Li W, Li H, Li H, Fu Z, Chen R. Li Z, et al. J Transl Med. 2015 Mar 12;13:84. doi: 10.1186/s12967-015-0442-z. J Transl Med. 2015. PMID: 25889214 Free PMC article. - Epithelial-to-mesenchymal transition is dispensable for metastasis but induces chemoresistance in pancreatic cancer.
Zheng X, Carstens JL, Kim J, Scheible M, Kaye J, Sugimoto H, Wu CC, LeBleu VS, Kalluri R. Zheng X, et al. Nature. 2015 Nov 26;527(7579):525-530. doi: 10.1038/nature16064. Epub 2015 Nov 11. Nature. 2015. PMID: 26560028 Free PMC article. - Involvement of epithelial to mesenchymal transition in the development of pancreatic ductal adenocarcinoma.
Satoh K, Hamada S, Shimosegawa T. Satoh K, et al. J Gastroenterol. 2015 Feb;50(2):140-6. doi: 10.1007/s00535-014-0997-0. Epub 2014 Sep 14. J Gastroenterol. 2015. PMID: 25216997 Review. - The epithelial to mesenchymal transition in pancreatic cancer: A systematic review.
Beuran M, Negoi I, Paun S, Ion AD, Bleotu C, Negoi RI, Hostiuc S. Beuran M, et al. Pancreatology. 2015 May-Jun;15(3):217-25. doi: 10.1016/j.pan.2015.02.011. Epub 2015 Mar 7. Pancreatology. 2015. PMID: 25794655 Review.
Cited by
- Angiogenin/Ribonuclease 5 Is an EGFR Ligand and a Serum Biomarker for Erlotinib Sensitivity in Pancreatic Cancer.
Wang YN, Lee HH, Chou CK, Yang WH, Wei Y, Chen CT, Yao J, Hsu JL, Zhu C, Ying H, Ye Y, Wang WJ, Lim SO, Xia W, Ko HW, Liu X, Liu CG, Wu X, Wang H, Li D, Prakash LR, Katz MH, Kang Y, Kim M, Fleming JB, Fogelman D, Javle M, Maitra A, Hung MC. Wang YN, et al. Cancer Cell. 2018 Apr 9;33(4):752-769.e8. doi: 10.1016/j.ccell.2018.02.012. Epub 2018 Mar 29. Cancer Cell. 2018. PMID: 29606349 Free PMC article. - Generation of patient-derived xenografts from fine needle aspirates or core needle biopsy.
Roife D, Kang Y, Wang L, Fang B, Swisher SG, Gershenwald JE, Pretzsch S, Dinney CP, Katz MHG, Fleming JB. Roife D, et al. Surgery. 2017 May;161(5):1246-1254. doi: 10.1016/j.surg.2016.11.020. Epub 2017 Jan 9. Surgery. 2017. PMID: 28081955 Free PMC article. - Compound NSC84167 selectively targets NRF2-activated pancreatic cancer by inhibiting asparagine synthesis pathway.
Dai B, Augustine JJ, Kang Y, Roife D, Li X, Deng J, Tan L, Rusling LA, Weinstein JN, Lorenzi PL, Kim MP, Fleming JB. Dai B, et al. Cell Death Dis. 2021 Jul 10;12(7):693. doi: 10.1038/s41419-021-03970-8. Cell Death Dis. 2021. PMID: 34247201 Free PMC article. - Global Phosphoproteomics Reveal CDK Suppression as a Vulnerability to KRas Addiction in Pancreatic Cancer.
Kazi A, Chen L, Xiang S, Vangipurapu R, Yang H, Beato F, Fang B, Williams TM, Husain K, Underwood P, Fleming JB, Malafa M, Welsh EA, Koomen J, Trevino J, Sebti SM. Kazi A, et al. Clin Cancer Res. 2021 Jul 15;27(14):4012-4024. doi: 10.1158/1078-0432.CCR-20-4781. Epub 2021 Apr 20. Clin Cancer Res. 2021. PMID: 33879459 Free PMC article. - Transforming Growth Factor-β Limits Secretion of Lumican by Activated Stellate Cells within Primary Pancreatic Adenocarcinoma Tumors.
Kang Y, Roife D, Lee Y, Lv H, Suzuki R, Ling J, Rios Perez MV, Li X, Dai B, Pratt M, Truty MJ, Chatterjee D, Wang H, Thomas RM, Wang Y, Koay EJ, Chiao PJ, Katz MH, Fleming JB. Kang Y, et al. Clin Cancer Res. 2016 Oct 1;22(19):4934-4946. doi: 10.1158/1078-0432.CCR-15-2780. Epub 2016 Apr 28. Clin Cancer Res. 2016. PMID: 27126993 Free PMC article.
References
- Howlader N, Noone AM, Krapcho M, Garshell J, Neyman N, Altekruse SF, Kosary CL, Yu M, Ruhl J, Tatalovich Z, Cho H, Mariotto A, Lewis DR, Chen HS, Feuer EJ, Cronin KA, editors. SEER Cancer Statistics Review, 1975-2010. National Cancer Institute; Bethesda, MD: Apr, 2013. http://seer.cancer.gov/csr/1975_2010/, based on November 2012 SEER data submission, posted to the SEER web site.
- Jemal A, Siegel R, Ward E, Hao Y, Xu J, Murray T, et al. Cancer statistics, 2008. CA: a cancer journal for clinicians. 2008;58(2):71–96. Epub 2008/02/22. - PubMed
- Douglas EJ, Fiegler H, Rowan A, Halford S, Bicknell DC, Bodmer W, et al. Array comparative genomic hybridization analysis of colorectal cancer cell lines and primary carcinomas. Cancer research. 2004;64(14):4817–25. Epub 2004/07/17. - PubMed
- Larramendy ML, Lushnikova T, Bjorkqvist AM, Wistuba, II, Virmani AK, Shivapurkar N, et al. Comparative genomic hybridization reveals complex genetic changes in primary breast cancer tumors and their cell lines. Cancer genetics and cytogenetics. 2000;119(2):132–8. Epub 2000/06/27. - PubMed
- Chaffer CL, Weinberg RA. A perspective on cancer cell metastasis. Science. 2011;331(6024):1559–64. Epub 2011/03/26. - PubMed
Publication types
MeSH terms
Substances
Grants and funding
- P30 CA016672/CA/NCI NIH HHS/United States
- P30CA016672/CA/NCI NIH HHS/United States
- CA016672/CA/NCI NIH HHS/United States
- T32CA009599/CA/NCI NIH HHS/United States
- T32 CA009599/CA/NCI NIH HHS/United States
LinkOut - more resources
Full Text Sources
Other Literature Sources
Medical
Research Materials


