Robust hippocampal responsivity during retrieval of consolidated associative memory - PubMed (original) (raw)
Robust hippocampal responsivity during retrieval of consolidated associative memory
Shoai Hattori et al. Hippocampus. 2015 May.
Abstract
A contentious point in memory research is whether or not the hippocampus plays a time-limited role in the consolidation of declarative memories. A widely held view is that declarative memories are initially encoded in the hippocampus, then transferred to the neocortex for long-term storage. Alternate views argue instead that the hippocampus continues to play a role in remote memory recall. These competing theories are largely based on human amnesic and animal lesion/inactivation studies. However, in vivo electrophysiological evidence supporting these views is scarce. Given that other studies examining the role of the hippocampus in remote memory retrieval using lesion and imaging techniques in human and animal models have provided mixed results, it would be particularly useful to gain insight at the in vivo electrophysiological level. Here we report hippocampal single-neuron and theta activity recorded longitudinally during acquisition and remote retrieval of trace eyeblink conditioning. Results from conditioned rabbits were compared to those obtained from yoked pseudo-conditioned control rabbits. Results reveal continued learning-specific hippocampal activity one month after initial acquisition of the task. Our findings yield insight into the normal physiological responses of the hippocampus during memory processes and provide compelling in vivo electrophysiological evidence that the hippocampus is involved in both acquisition and retrieval of consolidated memories.
Keywords: consolidation; hippocampus; in vivo electrophysiology; rabbits; trace eyeblink conditioning.
© 2014 The Authors Hippocampus Published by Wiley Periodicals, Inc.
Figures
Figure 1
Experimental design and behavioral results. (A) Training protocol for conditioned and pseudo‐conditioned animals. Pseudo‐conditioned animals received random presentations of CS‐alone and US‐alone trials. (B) Mean percent CRs exhibited by conditioned (n = 5) and pseudo (n = 4) rabbits during acquisition and retention of trace EBC. During acquisition, performance was plotted in relation to the day of achieving learning criterion. D1: Day 1, C: Criterion, R: Retention. Error bars represent SEM among subjects. Conditioned animals exhibited a significant increase in the percentage of CRs, whereas pseudo‐conditioned rabbits did not (Repeated measures ANOVA, interaction: F 7,49 = 36.07, P < 0.0001; ANOVA conditioned group, F 7,28 = 45.04, P < 0.001; ANOVA pseudo group, ns). This group difference was maintained during retention sessions (Repeated measures ANOVA, Main effect group F 1,7 = 533.36, P < 0.0001) (C) Average normalized blink amplitudes of conditioned and pseudo‐conditioned animals across training sessions. [Color figure can be viewed in the online issue, which is available at
wileyonlinelibrary.com
.]
Figure 2
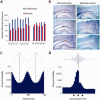
Recorded CA1 pyramidal neurons. (A) Number of recorded pyramidal neurons from conditioned (n = 5) and pseudo‐conditioned (n = 4) animals plotted over acquisition and retention sessions. D1: Day 1, C: Criterion, R: Retention. (B) Histological verification of recording sites. Left, reconstruction of recording sites (cyan = conditioned, red = pseudo‐conditioned). Right, example marking lesions (arrows). After classifying putative pyramidal neurons based on spontaneous firing rate and spike width, pyramidal neurons were further verified by examining their firing probabilities in relation to theta oscillations and sharp‐wave spindles. (C) Firing probabilities (mean ± SEM) of pyramidal neurons (n = 3612) to CA1 theta (4–8 Hz). For clarity, two theta cycles are shown; 0° and 360° mark the trough of theta cycles. (D) Discharge probabilities of pyramidal neurons (n = 3612) to sharp‐wave ripples (90–140 Hz). The start, maximum amplitude, and end of the normalized sharp‐wave episodes are marked by triangles, respectively. [Color figure can be viewed in the online issue, which is available at
wileyonlinelibrary.com
.]
Figure 3
Percentage of responsive CA1 pyramidal neurons. The Mann–Whitney U nonparametric statistical test comparing 1 s pre‐CS baseline activity to activity during the CS and Trace intervals of the trial were used to separate responsive neurons from nonresponsive neurons and to classify the responsive neurons as rate increasing (RI) or rate decreasing (RD). The percentage of RI, RD, and nonresponsive neurons of the total number of recorded pyramidal neurons (_y_‐axis) are plotted over training sessions (_x_‐axis).
Figure 4
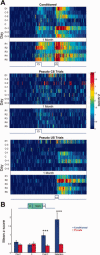
Activity of rate increasing neurons. (A) Mean _z_‐score peristimulus time histograms encompassing 1 s before and 2 s after CS onset (_x_‐axis) expressed in pseudo‐color for trials with paired CS‐US presentations from conditioned animals (top) and CS‐only (middle) and US‐only (bottom) trials of pseudo‐conditioned animals over training days (_y_‐axis). The activity of the US‐only trials from pseudo‐conditioned animals are from the same cells that were responsive during the CS‐only trials. D1: Day 1, C: Criterion, R: Retention. (B) Average CS‐Trace interval _z_‐scores (y axis) for conditioned and pseudo‐conditioned subjects across learning stages (x axis). Error bars represent SEM preserving the variability among neurons. Two‐way ANOVA indicated a significant group × session interaction in mean CS‐Trace _z_‐score activity (Interaction: F 3,223 = 4.04, P = 0.008). Activity were significantly different among the groups on PostC and Retention sessions (Bonferroni corrected post hoc two‐tailed unpaired _t_‐tests, *** P < 0.001).
Figure 5
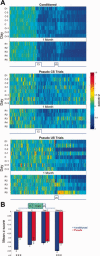
Activity of rate decreasing neurons. (A) Mean _z_‐score peristimulus time histograms encompassing 1 s before and 2 s after CS onset (x axis) expressed in pseudo‐color for trials with paired CS‐US presentations from conditioned animals (top) and CS‐only (middle) and US‐only (bottom) trials of pseudo‐conditioned animals over training days (y axis). The activity of the US‐only trials from pseudo‐conditioned animals are from the same cells that were responsive during the CS‐only trials. D1: Day 1, C: Criterion, R: Retention. (B) Average CS‐Trace interval _z_‐scores (y axis) for conditioned and pseudo‐conditioned subjects across learning stages (x axis). Error bars represent SEM preserving the variability among neurons. Two‐way ANOVA indicated a significant group difference in the magnitude of rate decrease (Main effect of group: F 1,729 = 6.88, P < 0.01). Bonferroni corrected two‐tailed unpaired t tests revealed significant group differences on PreC and Retention sessions (*** P < 0.001).
Figure 6
Mean duration of rate decrease. The mean duration of rate decrease (y axis) for RD neurons recorded within a session from conditioned animals (blue) and pseudo‐conditioned animals during CS‐only (red) and US‐only presentations (gray) were plotted across sessions (x axis). The mean duration of rate decrease over all sessions was 3.53 ± 0.14 s for conditioned animals, 1.18 ± 0.10 s for CS‐only trials from pseudo‐conditioned animals, and 3.29 ± 0.12 s for US‐only trials from pseudo‐conditioned animals. The similar duration of rate decrease between conditioned RD neurons and pseudo RD neurons during US‐only presentations suggest that the long decrease observed in conditioned group neurons arise largely out of the salient, US presentations and may contribute to increasing the signal‐to‐noise of the regional network to enhance the encoding, consolidation, and retrieval of behaviorally relevant information.
Figure 7
Theta phase resetting. (A) Circular statistics were used to compute the mean resultant vector indicating the preferred theta phase for paired trials of conditioned animals (left) and CS‐alone (middle) and US‐alone trials (right) of pseudo‐conditioned animals across training sessions (y axis). (B) The resultant vector length, indicating the degree at which the data sample is concentrated around the mean direction (1 = concentrated; 0 = nonconcentrated), is shown below each preferred theta phase plot in pseudo‐color.
Figure 8
Theta amplitude. Mean instantaneous theta amplitude in _z_‐scores are expressed in pseudo‐color for paired trials of conditioned animals (left) and CS‐alone (middle) and US‐alone trials (right) of pseudo‐conditioned animals across training sessions (y axis).
Similar articles
- Differential responsivity of neurons in perirhinal cortex, lateral entorhinal cortex, and dentate gyrus during time-bridging learning.
Suter EE, Weiss C, Disterhoft JF. Suter EE, et al. Hippocampus. 2019 Jun;29(6):511-526. doi: 10.1002/hipo.23041. Epub 2018 Nov 25. Hippocampus. 2019. PMID: 30311282 Free PMC article. - Hippocampal theta phase-contingent memory retrieval in delay and trace eyeblink conditioning.
Waselius T, Pöllänen E, Wikgren J, Penttonen M, Nokia MS. Waselius T, et al. Behav Brain Res. 2018 Jan 30;337:264-270. doi: 10.1016/j.bbr.2017.09.001. Epub 2017 Sep 4. Behav Brain Res. 2018. PMID: 28882692 - Hippocampal theta-band activity and trace eyeblink conditioning in rabbits.
Nokia MS, Penttonen M, Korhonen T, Wikgren J. Nokia MS, et al. Behav Neurosci. 2009 Jun;123(3):631-40. doi: 10.1037/a0015334. Behav Neurosci. 2009. PMID: 19485570 - Functional basis of associative learning and its relationships with long-term potentiation evoked in the involved neural circuits: Lessons from studies in behaving mammals.
Gruart A, Leal-Campanario R, López-Ramos JC, Delgado-García JM. Gruart A, et al. Neurobiol Learn Mem. 2015 Oct;124:3-18. doi: 10.1016/j.nlm.2015.04.006. Epub 2015 Apr 25. Neurobiol Learn Mem. 2015. PMID: 25916668 Review. - The impact of hippocampal lesions on trace-eyeblink conditioning and forebrain-cerebellar interactions.
Weiss C, Disterhoft JF. Weiss C, et al. Behav Neurosci. 2015 Aug;129(4):512-22. doi: 10.1037/bne0000061. Behav Neurosci. 2015. PMID: 26214216 Free PMC article. Review.
Cited by
- Representation of memories in the cortical-hippocampal system: Results from the application of population similarity analyses.
McKenzie S, Keene CS, Farovik A, Bladon J, Place R, Komorowski R, Eichenbaum H. McKenzie S, et al. Neurobiol Learn Mem. 2016 Oct;134 Pt A(Pt A):178-191. doi: 10.1016/j.nlm.2015.12.008. Epub 2015 Dec 31. Neurobiol Learn Mem. 2016. PMID: 26748022 Free PMC article. Review. - Detection of memory- and learning-related brain connectivity changes following trace eyeblink-conditioning using resting-state functional magnetic resonance imaging in the awake rabbit.
Bertolino N, Procissi D, Disterhoft JF, Weiss C. Bertolino N, et al. J Comp Neurol. 2021 May 1;529(7):1597-1606. doi: 10.1002/cne.25042. Epub 2020 Sep 30. J Comp Neurol. 2021. PMID: 32975314 Free PMC article. - Harnessing the power of theta: natural manipulations of cognitive performance during hippocampal theta-contingent eyeblink conditioning.
Hoffmann LC, Cicchese JJ, Berry SD. Hoffmann LC, et al. Front Syst Neurosci. 2015 Apr 13;9:50. doi: 10.3389/fnsys.2015.00050. eCollection 2015. Front Syst Neurosci. 2015. PMID: 25918501 Free PMC article. Review. - Neural correlates of appetitive extinction in humans.
Kruse O, Tapia León I, Stark R, Klucken T. Kruse O, et al. Soc Cogn Affect Neurosci. 2017 Jan 1;12(1):106-115. doi: 10.1093/scan/nsw157. Soc Cogn Affect Neurosci. 2017. PMID: 27803289 Free PMC article. - Cluster tendency assessment in neuronal spike data.
Mahallati S, Bezdek JC, Popovic MR, Valiante TA. Mahallati S, et al. PLoS One. 2019 Nov 12;14(11):e0224547. doi: 10.1371/journal.pone.0224547. eCollection 2019. PLoS One. 2019. PMID: 31714913 Free PMC article.
References
- Anderson KL, Rajagovindan R, Ghacibeh GA, Meador KJ, Ding M. 2010. Theta oscillations mediate interaction between prefrontal cortex and medial temporal lobe in human memory. Cereb Cortex 20:1604–1612. - PubMed
- Brankack J, Stewart M, Fox SE. 1993. Current source density analysis of the hippocampal theta rhythm: Associated sustained potentials and candidate synaptic generators. Brain Res 615:310–327. - PubMed
- Buzsaki G. 2002. Theta oscillations in the hippocampus. Neuron 33:325–340. - PubMed
Publication types
MeSH terms
Grants and funding
- R01 NS059879/NS/NINDS NIH HHS/United States
- F31 MH099769/MH/NIMH NIH HHS/United States
- F31MH099769/MH/NIMH NIH HHS/United States
- R01 AG017139/AG/NIA NIH HHS/United States
- 5T32AG020418-10/AG/NIA NIH HHS/United States
- NS059879/NS/NINDS NIH HHS/United States
- T32 AG020418/AG/NIA NIH HHS/United States
- MH47340/MH/NIMH NIH HHS/United States
- R01 MH047340/MH/NIMH NIH HHS/United States
- R56 MH047340/MH/NIMH NIH HHS/United States
LinkOut - more resources
Full Text Sources
Other Literature Sources
Medical


