Identification of a mast-cell-specific receptor crucial for pseudo-allergic drug reactions - PubMed (original) (raw)
. 2015 Mar 12;519(7542):237-41.
doi: 10.1038/nature14022. Epub 2014 Dec 17.
Affiliations
- PMID: 25517090
- PMCID: PMC4359082
- DOI: 10.1038/nature14022
Identification of a mast-cell-specific receptor crucial for pseudo-allergic drug reactions
Benjamin D McNeil et al. Nature. 2015.
Abstract
Mast cells are primary effectors in allergic reactions, and may have important roles in disease by secreting histamine and various inflammatory and immunomodulatory substances. Although they are classically activated by immunoglobulin (Ig)E antibodies, a unique property of mast cells is their antibody-independent responsiveness to a range of cationic substances, collectively called basic secretagogues, including inflammatory peptides and drugs associated with allergic-type reactions. The pathogenic roles of these substances have prompted a decades-long search for their receptor(s). Here we report that basic secretagogues activate mouse mast cells in vitro and in vivo through a single receptor, Mrgprb2, the orthologue of the human G-protein-coupled receptor MRGPRX2. Secretagogue-induced histamine release, inflammation and airway contraction are abolished in Mrgprb2-null mutant mice. Furthermore, we show that most classes of US Food and Drug Administration (FDA)-approved peptidergic drugs associated with allergic-type injection-site reactions also activate Mrgprb2 and MRGPRX2, and that injection-site inflammation is absent in mutant mice. Finally, we determine that Mrgprb2 and MRGPRX2 are targets of many small-molecule drugs associated with systemic pseudo-allergic, or anaphylactoid, reactions; we show that drug-induced symptoms of anaphylactoid responses are significantly reduced in knockout mice; and we identify a common chemical motif in several of these molecules that may help predict side effects of other compounds. These discoveries introduce a mouse model to study mast cell activation by basic secretagogues and identify MRGPRX2 as a potential therapeutic target to reduce a subset of drug-induced adverse effects.
Figures
Extended Data Figure 1. MrgprX1 orthologues are not expressed at relevant levels in mast cells under naive conditions
a. Results from a low-stringency RT-PCR screen (see methods) in peritoneal mast cells for expression of the MrgprX1 orthologues MrgprA3 and MrgprC11. Arrow points to expected band sizes. b. Percentages of peritoneal mast cells responding to the MrgprX1 and MrgprC11 agonist Bovine Adrenal Medulla derived peptide, fragment 8-22 (BAM8-22, 500 nM). Activation was assayed by measuring rises in intracellular calcium, using imaging of the Fluo-4 dye. Differences are not significant (p=0.39). Group data are expressed as mean ± standard error of the mean. Two-tailed unpaired Student's t test was used to determine significance in statistical comparisons. c. Chart summarizing responses to MrgprX2 ligands and the MrgprX1 ligand chloroquine (CQ) by HEK293 cells transiently transfected with plasmids driving expression of MrgprX2, MrgprB2, and other mouse Mrgprs (i.e. MrgprB1, B10, and B11) most closely related to MrgprB2. Positive and negative responses are indicated as “checks” and “crosses”, respectively. Responses were considered positive if at least half of the transfected cells showed a 50% increase in [Ca2+]i. No cells transfected with MrgprB1, B10, and B11 responded to any listed drug.
Extended Data Figure 2
Basic secretagogues and drugs that induce pseudo-allergic reactions activate mouse MrgprB2 and human MrgprX2 expressed in HEK293 cells. Example traces showing changes in [Ca2+]i, as measured by Fluo-4 imaging, from HEK293 cells expressing MrgprB2 and Gα15 (a) or MrgprX2 and Gα15 (b). Substances were perfused from the 30 to 90 second time period, except for ciprofloxacin, which was perfused between the 30 and 60 second time periods to minimize exposure to the low pH solutions it was dissolved in. Insulin was used as a negative control. (c) Table of EC50s of basic secretagogues and drugs associated with pseudo-allergic reactions to activate MrgprB2 and MrgprX2-expressing HEK293 cells. The EC50s were determined from dose response studies which were repeated three times. Data are expressed as mean ± SEM.
Extended Data Figure 3
Multiple lines of BAC transgenic mice confirm mast cell specific MrgprB2 expression. Representative confocal images from two other BAC transgenic mouse lines. BAC mice expressing eGFP-Cre in the MrgprB2 open reading frame were mated to tdTomato reporter mice and tdTomato (red) expression was compared to avidin staining (green), a marker for mast cells. Scale bar is 20 μm.
Extended Data Figure 4
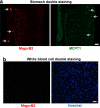
MrgprB2 is not expressed in mucosal mast cells or peripheral white blood cells. a. Representative images of a stomach section from an MrgprB2-tdTomato mouse stained with an anti-MCPT1 (β-chymase) antibody to label mucosal mast cells. White arrows indicate positive cells. No cells were double-labeled (296 Mcpt1-labeled cells and 275 tdTomato-positive cells counted, n=3 mice). Scale bar is 40 μm. b. Representative images of a Cytospin preparation of peripheral white blood cells from an MrgprB2-tdTomato mouse doubly labeled with tdTomato for MrgprB2-expressing cells (red; left image) and Hoechst 33342 nuclear staining (blue; right image). No peripheral white blood cell expressed MrgprB2 (n=3 mice; >4000 cells examined). Scale bar is 40 μm.
Extended Data Figure 5
MrgprB2MUT mice are functional knockouts. a. Illustration of the genomic region in and around the MrgprB2 locus. Note that repetitive sequences including long interspersed elements (LINEs), short interspersed elements (SINEs), and long tandem repeats (LTRs) begin immediately after the 3’ side of the MrgprB2 gene, and in addition are present within 2.5 kb of the 5’ side. A BLASTN search in March 2014 using the 500 bases adjacent to the 3’ end of MrgprB2 as a query turned up more than 269,000 hits in the mouse genome. b. Comparison of the WT and MUT genomic sequences shows the location of the four base pair deletion in the mutant. Numbers correspond to the MrgprB2 open reading frame. c. Sequencing result from WT and MUT cDNA sampled from mice born 18 months after the mutant line was established. The bases missing in the mutant are highlighted in red. d. Amino acid translation of the MrgprB2MUT open reading frame reveals that the deletion creates a frameshift mutation and an early termination codon (*) shortly after the first transmembrane region. Mut – site of the frameshift deletion. TM1 – transmembrane region 1.
Extended Data Figure 6
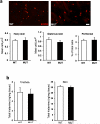
The mast cell numbers and the histamine content of tracheal and skin tissue was not different between wild type and MrgprB2MUT animals. a. Top, representative pictures of avidin staining in WT and MrgprB2MUT mice. Scale bar is 40 μm. Bottom, quantification of mast cell numbers in various tissues. Differences are not significant, using a two-tailed unpaired Student's t test (n=3 mice for each genotype; over 3000 μm2 and 1000 μm2 counted for each genotype for hairy and glabrous skin, respectively; over 10,000 peritoneal cells counted). b. The tracheal histamine content averaged 5.9 ± 0.9 and 5.5 ± 1.6 ng/mg (n=5 for each genotype), respectively; the skin histamine content averaged 30.8 ± 3.2 and 30.2 ± 4.0 ng/mg (n=8 for each genotype), respectively. Differences were not significant. Group data are expressed as mean ± standard error of the mean. Two-tailed unpaired Student's t test was used to determine significance in statistical comparisons.
Extended Data Figure 7
Endothelin acting through the ETA GPCR induced comparable activation in MrgprB2MUT and wild-type mast cells. a. Representative heat map images of mouse peritoneal mast cells showing changes in [Ca2+]i, as assayed by Fluo-4 imaging, induced by bath application of endothelin (1 μM). Scale bar is 10 μm. b. Averages of [Ca2+]i imaging traces for WT (red line) and MrgprB2MUT (black line). The [Ca2+]i traces are similar between WT and MUT groups. Traces were averaged as described for Figure 2a. c. Quantification of percentage of responding cells. Group data are expressed as mean ± standard error of the mean. Two-tailed unpaired Student's t test was used to determine significance in statistical comparisons (n=3 for each genotype; over 180 cells counted for each genotype). Endothelin-induced responses were not significantly different.
Extended Data Figure 8
IgE-mediated inflammation does not differ between wild type and MrgprB2MUT mice. a. Representative images of Evans Blue extravasation 15 minutes after intraplantar injection of anti-IgE antibody (right, arrow, 100 μg/ml, 7 μl in saline) or saline (left). b. Quantification of Evans Blue leakage into the paw after 15 minutes (n=6 for WT, n=7 for MrgprB2MUT). Differences after anti-IgE antibody (p=0.49) and saline (p=0.23) injection are not significant. Group data are expressed as mean ± standard error of the mean. Two-tailed unpaired Student's t test was used to determine significance in statistical comparisons.
Extended Data Figure 9
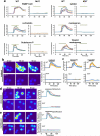
MrgprB2MUT mast cells are unresponsive to basic secretagogues and various therapeutic drugs. a. Example traces showing changes in [Ca2+]i, as measured by Fluo-4 imaging, from WT and MrgprB2MUT peritoneal mast cells induced by the basic secretagogues from Figure 2e. Each trace is a response from a unique cell. b. Representative Fluo-4 images (left) and fluorescence traces (right) from WT (top) and MrgprB2MUT (bottom) cultured peritoneal mast cells during application of icatibant (50 μg/ml). c. Example traces showing changes in [Ca2+]i, as measured by Fluo-4 imaging, from WT and MrgprB2MUT peritoneal mast cells induced by selected FDA-approved cationic peptidergic drugs. Each trace is a response from a unique cell. d. Representative Fluo-4 images (left) and fluorescence traces (right) from WT (top) and MrgprB2MUT (bottom) cultured peritoneal mast cells during application of atracurium (50 μg/ml). e. Representative Fluo-4 images (left) and fluorescence traces (right) from WT (top) and MrgprB2MUT (bottom) cultured peritoneal mast cells during application of ciprofloxacin (200 μg/ml).
Extended Data Figure 10
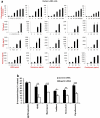
Human mast cells are activated by basic secretagogues and drugs associated with pseudo-allergic reactions in an MrgprX2-dependent manner. a. Human LAD2 mast cells were treated with different concentrations of compound 48/80, mastoparan, icatibant, atracurium, and ciprofloxacin. The activation of mast cells in response to these substances was characterized by the release of β-hexosaminidase, TNF, PGD2, and histamine. In addition, 0.1 μg/ml streptavidin stimulation of biotin-conjugated human IgE sensitized LAD2 cells caused a robust release of β-hexosaminidase (71.3±1.8% release), compared to untreated cells (4.1±0.3% release). Group data are expressed as mean ± standard error of the mean. b. Knockdown of human MrgprX2 significantly reduced mast cell activation evoked by basic secretagogues and drugs associated with pseudo-allergic reactions, but not by IgE. Human LAD2 mast cells were first transfected with MrgprX2 siRNA or control siRNA. Two days after the transfection, the cells were treated with compound 48/80 (0.1 μg/ml), mastoparan (5 μg/ml), icatibant (10 μg/ml), atracurium (25 μg/ml), and ciprofloxacin (75 μg/ml). The activation of mast cells in response to these substances characterized by the release of β-hexosaminidase was significantly reduced in MrgprX2 siRNA treated cells, compared to release in the control group. IgE-mediated mast cell degranulation was unaffected by MrgprX2 siRNA knockdown. Group data are expressed as mean ± standard error of the mean. Two-tailed unpaired Student's t test was used to determine significance in statistical comparisons, and differences were considered significant at * p < 0.05; ** p<0.01; *** p< 0.005 (the experiments were repeated three times).
Figure 1. MrgprB2 is the orthologue of human MrgprX2
a. Diagram of mouse and human Mrgpr genomic loci. Mouse MrgprA3 and MrgprC11 are orthologues of human MrgprX1, determined by expression and ligand specificity. The MrgprX2 orthologue MrgprB2 is described in this study. b. Results from a stringent RT-PCR screen identifying MrgprB2 transcript (arrow) in mouse peritoneal mast cells. The negative control (Neg.) omitted reverse transcriptase. c. Example traces of intracellular calcium concentrations [Ca2+]i, measured by ratiometric Fura-2 imaging, from MrgprB2-HEK or MrgprX2-HEK cells exposed to 20 μM PAMP(9-20) (duration indicated by black line). Each trace is a response from a unique cell. d. Representative confocal images from BAC transgenic mouse tissues in which tdTomato expression is controlled by eGFP-Cre expression from the MrgprB2 locus (see methods). Avidin staining was used to identify mast cells. Percentages of avidin-positive mast cells that also were tdTomato-positive: glabrous skin, 97.5%; hairy skin, 90.1%; trachea, 97.2%; heart, 87.1%. Percentages of tdTomato-positive cells that also were avidin-positive: glabrous skin, 99.2%; hairy skin, 100%; trachea, 98.3%; heart, 99%. n=3 mice and >300 cells counted/tissue, except n=2 and >100 cells/heart. Scale bar 20 μm.
Figure 2. MrgprB2 is the mouse mast cell basic secretagogue receptor
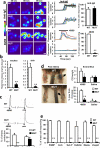
a. Left, representative Fluo-4 fluorescence heat map images of mouse peritoneal mast cells showing changes in [Ca2+]i induced by bath application of anti-IgE (5 μg/ml) or 48/80 (10 μg/ml). Middle, representative imaging traces. Each color line represents an individual cell. Black lines in “anti-IgE” panels are average traces for each genotype. Note: [Ca2+]i traces are similar between WT and MUT groups. Right, quantification of responding cells (n=3/genotype; >150 cells counted/condition). Anti-IgE responses were not significantly different. Scale bar 10 μm. b. Histamine release into the supernatant from trachea and abdominal skin from WT and MrgprB2MUT mice after exposure to 48/80 (30 μg/ml) for 30 minutes at 37°C. n = 5/trachea, n= 8/skin. c. Top, representative traces showing contractions of trachea isolated from WT and MrgprB2MUT mice (previously sensitized to ovalbumin (ova), in response to 48/80 (30 μg/ml) or ova (10 μg/ml; i.e. IgE-dependent). Bottom, average data; maximum total contraction determined as response to 10 μM carbamycholine added at the end of the experiment. n=5 for 48/80 WT, 3 for 48/80 MrgprB2MUT. d. Left, representative images of Evans Blue extravasation 15 minutes after intraplantar injection of 48/80 (right, arrow, 10 μg/ml, 5 μl in saline) or saline (left). Right, quantification of Evans Blue leakage into the paw and paw thickness increase after 15 minutes. *, p<0.02 (n=5/ WT, n=6/MrgprB2MUT). Differences after saline injection were not significant. **e**. Quantification of WT and MrgprB2MUT mast cell responsiveness to MrgprX2 ligands and basic secretagogues, assayed using Fluo-4 imaging. Concentrations of substances (in μM): PAMP(9-20), 20; cortistatin-14 (cort.), 20; Substance P (sub P), 200; kallidin, 200; mastoparan (masto., a component of wasp venom), 20; vespid mastoparan, 20. n=3/genotype; >150 cells counted/secretagogue. Data are presented as mean ± standard error of mean (SEM). Two-tailed unpaired Student's t test was used to determine significance in statistical comparisons, and differences were considered significant at p<0.05. *, p < 0.05. **, p<0.01 unless noted.
Figure 3. MrgprB2 mediates mast cell responsiveness and side effects of peptidergic therapeutic drugs
a. Percentage of responding cells from WT and MrgprB2MUT peritoneal mast cells after drug application, assayed using Fluo-4 imaging. Concentrations of drugs (in μg/ml): icatibant, 50; cetrorelix, 20; leuprolide, 100; octreotide, 10; sermorelin, 60; insulin, 80. n=3/genotype; >150 cells counted/substance, except >100 cells counted for insulin. Difference between insulin responsiveness was not significant. b. Left, representative images of Evans Blue extravasation 15 minutes after intraplantar injection of icatibant (right, arrow, 10 mg/ml, 5 μl in saline) or saline (left). Right, quantification of Evans Blue leakage into the paw after 15 minutes. n=6/genotype. Difference after saline injection was not significant. c. Total histamine release from WT (red diamonds) and MrgprB2MUT (black squares) mice after incubation with named substances. Note: no significant difference between WT and MrgprB2MUT cells was found at any dose of anti-IgE antibody. Experiments were repeated >3 times. Data are presented as mean ± SEM. Two-tailed unpaired Student's t test: *, p < 0.05. **, p<0.01.
Figure 4. MrgprB2 mediates mast cell responsiveness and side effects of small molecule therapeutic drugs
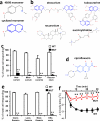
a. Structures of 48/80 and a cyclized variant. The THIQ motif is highlighted in blue. b. Structures of representative members of all NMBD classes (see Supplementary Information). THIQ motifs highlighted in blue. Note that only succinylcholine lacks a bulky hydrophobic group. c. Percentage of responding cells from WT and MrgprB2MUT peritoneal mast cells after application of various NMBDs, assayed using Fluo-4 imaging. Concentrations of drugs (in μg/ml): atracurium, 50; mivacurium, 20; tubocurarine, 30; rocuronium, 500. n=3 mice /genotype; >150 cells counted/substance. d. Structure of ciprofloxacin, with the motif common to all fluoroquinolones highlighted in blue. Note nitrogens close to the quinolone motifs. e. Percentage of responding cells from WT and MrgprB2MUT peritoneal mast cells after fluoroquinolone application, assayed using Fluo-4 imaging. Concentrations of drugs (in μg/ml): ciprofloxacin, 200; levofloxacin, 500; moxifloxacin, 160; ofloxacin, 400. n=3 mice/genotype; >150 cells counted/substance. f. Changes in body temperature after intravenous injection of ciprofloxacin (1.5 mg in 125 μl saline) at time 0. n=4 mice/genotype. Data are presented as mean ± SEM. Two-tailed unpaired Student's t test: *, p < 0.05. **, p<0.01.
Comment in
- Mast cell-MrgprB2: sensing secretagogues or a means to overreact?
Grimbaldeston MA. Grimbaldeston MA. Immunol Cell Biol. 2015 Mar;93(3):221-3. doi: 10.1038/icb.2015.10. Immunol Cell Biol. 2015. PMID: 25776987 No abstract available.
Similar articles
- Typical antimicrobials induce mast cell degranulation and anaphylactoid reactions via MRGPRX2 and its murine homologue MRGPRB2.
Zhang T, Che D, Liu R, Han S, Wang N, Zhan Y, Pundir P, Cao J, Lv Y, Yang L, Wang J, Ding M, Dong X, He L. Zhang T, et al. Eur J Immunol. 2017 Nov;47(11):1949-1958. doi: 10.1002/eji.201746951. Epub 2017 Sep 4. Eur J Immunol. 2017. PMID: 28688196 - Cisatracurium induces mast cell activation and pseudo-allergic reactions via MRGPRX2.
Che D, Rui L, Cao J, Wang J, Zhang Y, Ding Y, Zhao T, Ma P, An H, Gao Z, Zhang T. Che D, et al. Int Immunopharmacol. 2018 Sep;62:244-250. doi: 10.1016/j.intimp.2018.07.020. Epub 2018 Jul 20. Int Immunopharmacol. 2018. PMID: 30032049 - Thimerosal induces skin pseudo-allergic reaction via Mas-related G-protein coupled receptor B2.
Peng B, Che D, Hao Y, Zheng Y, Liu R, Qian Y, Cao J, Wang J, Zhang Y, He L, Geng S. Peng B, et al. J Dermatol Sci. 2019 Sep;95(3):99-106. doi: 10.1016/j.jdermsci.2019.07.007. Epub 2019 Jul 24. J Dermatol Sci. 2019. PMID: 31558225 - Minireview: Mas-related G protein-coupled receptor X2 activation by therapeutic drugs.
McNeil BD. McNeil BD. Neurosci Lett. 2021 Apr 23;751:135746. doi: 10.1016/j.neulet.2021.135746. Epub 2021 Feb 18. Neurosci Lett. 2021. PMID: 33610674 Review. - Roles of Mas-related G protein-coupled receptor X2 on mast cell-mediated host defense, pseudoallergic drug reactions, and chronic inflammatory diseases.
Subramanian H, Gupta K, Ali H. Subramanian H, et al. J Allergy Clin Immunol. 2016 Sep;138(3):700-710. doi: 10.1016/j.jaci.2016.04.051. Epub 2016 Jul 20. J Allergy Clin Immunol. 2016. PMID: 27448446 Free PMC article. Review.
Cited by
- How do basic secretagogues activate mast cells?
Seifert R. Seifert R. Naunyn Schmiedebergs Arch Pharmacol. 2015 Mar;388(3):279-81. doi: 10.1007/s00210-015-1093-6. Epub 2015 Feb 1. Naunyn Schmiedebergs Arch Pharmacol. 2015. PMID: 25637583 No abstract available. - Caffeic acid phenethyl ester inhibits pseudo-allergic reactions via inhibition of MRGPRX2/MrgprB2-dependent mast cell degranulation.
Adhikari N, Shim WS. Adhikari N, et al. Arch Pharm Res. 2022 Sep;45(9):644-657. doi: 10.1007/s12272-022-01405-2. Epub 2022 Oct 2. Arch Pharm Res. 2022. PMID: 36183260 - Nonpeptidergic neurons suppress mast cells via glutamate to maintain skin homeostasis.
Zhang S, Edwards TN, Chaudhri VK, Wu J, Cohen JA, Hirai T, Rittenhouse N, Schmitz EG, Zhou PY, McNeil BD, Yang Y, Koerber HR, Sumpter TL, Poholek AC, Davis BM, Albers KM, Singh H, Kaplan DH. Zhang S, et al. Cell. 2021 Apr 15;184(8):2151-2166.e16. doi: 10.1016/j.cell.2021.03.002. Epub 2021 Mar 24. Cell. 2021. PMID: 33765440 Free PMC article. - Emerging Role of the Mast Cell-Microbiota Crosstalk in Cutaneous Homeostasis and Immunity.
Bosveld CJ, Guth C, Limjunyawong N, Pundir P. Bosveld CJ, et al. Cells. 2023 Nov 14;12(22):2624. doi: 10.3390/cells12222624. Cells. 2023. PMID: 37998359 Free PMC article. Review. - Involvement of Histamine and RhoA/ROCK in Penicillin Immediate Hypersensitivity Reactions.
Han J, Yi Y, Li C, Zhang Y, Wang L, Zhao Y, Pan C, Liang A. Han J, et al. Sci Rep. 2016 Sep 13;6:33192. doi: 10.1038/srep33192. Sci Rep. 2016. PMID: 27619816 Free PMC article.
References
- Metcalfe DD, Baram D, Mekori YA. Mast cells. Physiological reviews. 1997;77:1033–1079. - PubMed
- Galli SJ, Nakae S, Tsai M. Mast cells in the development of adaptive immune responses. Nature immunology. 2005;6:135–142. doi:10.1038/ni1158. - PubMed
- Lagunoff D, Martin TW, Read G. Agents that release histamine from mast cells. Annual review of pharmacology and toxicology. 1983;23:331–351. doi:10.1146/annurev.pa.23.040183.001555. - PubMed
- Taneike T, Miyazaki H, Oikawa S, Ohga A. Compound 48/80 elicits cholinergic contraction through histamine release in the chick oesophagus. General pharmacology. 1988;19:689–695. - PubMed
Publication types
MeSH terms
Substances
Grants and funding
- R01 GM087369/GM/NIGMS NIH HHS/United States
- R01GM087369/GM/NIGMS NIH HHS/United States
- R01 NS054791/NS/NINDS NIH HHS/United States
- R01NS054791/NS/NINDS NIH HHS/United States
- Howard Hughes Medical Institute/United States
- K99 NS087088/NS/NINDS NIH HHS/United States
LinkOut - more resources
Full Text Sources
Other Literature Sources
Medical
Molecular Biology Databases


