MAVS, cGAS, and endogenous retroviruses in T-independent B cell responses - PubMed (original) (raw)
. 2014 Dec 19;346(6216):1486-92.
doi: 10.1126/science.346.6216.1486.
Zeping Hu 2, Xiaolei Shi 2, Xiaohong Li 1, Xiaoming Zhan 1, Xiao-Dong Li 3, Jianhui Wang 3, Jin Huk Choi 1, Kuan-wen Wang 1, Tiana Purrington 1, Miao Tang 1, Maggy Fina 1, Ralph J DeBerardinis 2, Eva Marie Y Moresco 1, Gabriel Pedersen 4, Gerald M McInerney 4, Gunilla B Karlsson Hedestam 4, Zhijian J Chen 3, Bruce Beutler 5
Affiliations
- PMID: 25525240
- PMCID: PMC4391621
- DOI: 10.1126/science.346.6216.1486
MAVS, cGAS, and endogenous retroviruses in T-independent B cell responses
Ming Zeng et al. Science. 2014.
Retraction in
- Editorial retraction.
Berg J. Berg J. Science. 2017 Oct 27;358(6362):458. doi: 10.1126/science.aar2406. Science. 2017. PMID: 29074761 Free PMC article. No abstract available.
Abstract
Multivalent molecules with repetitive structures including bacterial capsular polysaccharides and viral capsids elicit antibody responses through B cell receptor (BCR) crosslinking in the absence of T cell help. We report that immunization with these T cell-independent type 2 (TI-2) antigens causes up-regulation of endogenous retrovirus (ERV) RNAs in antigen-specific mouse B cells. These RNAs are detected via a mitochondrial antiviral signaling protein (MAVS)-dependent RNA sensing pathway or reverse-transcribed and detected via the cGAS-cGAMP-STING pathway, triggering a second, sustained wave of signaling that promotes specific immunoglobulin M production. Deficiency of both MAVS and cGAS, or treatment of MAVS-deficient mice with reverse transcriptase inhibitors, dramatically inhibits TI-2 antibody responses. These findings suggest that ERV and two innate sensing pathways that detect them are integral components of the TI-2 B cell signaling apparatus.
Copyright © 2014, American Association for the Advancement of Science.
Figures
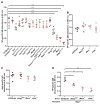
Figure 1. Cytosolic DNA and RNA sensing pathways are essential for induction of the TI-2 antibody response
(A) Serum NP-specific IgM on day 4.5 post-immunization with NP-Ficoll. (B) Serum NP-specific IgM on day 4.5 post-immunization with NP-LPS. (C) Serum βgal-specific IgG on day 14.5 post-immunization with rSFV-encoded βgal. (D) Serum NP-specific IgM on day 4.5 post-immunization of Rag2−/− mice adoptively transferred 1 day prior to immunization with splenic and peritoneal B cells from donor mice of the indicated genotypes. Data points represent individual mice. P values were determined by one-way ANOVA and post hoc Tukey test; in B and C, no significant difference was found between any mutant genotype and C57BL/6J. Results are representative of 2–3 independent experiments.
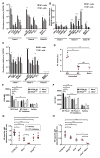
Figure 2. cGAMP is elevated within antigen-specific B cells following TI-2 immunization and is sufficient to drive B cell activation in vitro and in vivo
(A) CD86, MHC class II, and CD25 expression, and BrdU incorporation by GFP+ or GFP− splenic CD19+ B cells 36 hours after transfection with a GFP expression plasmid. N = 3 C57BL/6J mice, 3 Stinggt/gt mice. (B) cGAMP level measured by liquid chromatogryph-tandem mass spectrometry (LC-MS/MS) in 2×10⁵ NP-specific or non-NP-specific splenic CD19+ B cells from C57BL/6J mice on day 4.5 post-immunization with NP-Ficoll (N = 3) or in naïve mice (N = 3). Upper panels, chromatograms of cGAMP. Lower panel, cGAMP abundance normalized to cell number for each sample. (C) Time course of cGAMP levels in NP-specific or non-NP-specific B cells from C57BL/6J mice (N = 3) immunized with NP-Ficoll. (D and E) CD86 expression (D) or the percentage of BrdU+ splenic B cells (E) after treatment with cGAMP or vehicle for 2 days in vitro. N = 3 C57BL/6J mice, 3 Stinggt/gt mice. (F) Serum NP-specific IgM on day 5 post-immunization with NP-Ficoll plus cGAMP or NP-Ficoll plus vehicle. (G) HLA-DR or CD69 expression by human B cells isolated from healthy donor peripheral blood after treatment with cGAMP or vehicle for 2 days in vitro. MFI, mean fluorescence intensity. Data points represent individual mice or humans (B, F, G). P values were determined by one-way (A–B, D–F) or two-way ANOVA and post hoc Tukey test (C) or Student’s t test (G). Results are representative of 2–3 independent experiments.
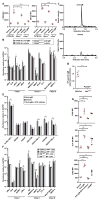
Figure 3. TI-2 antigen immunization induces expression of ERV mRNA and cDNA that are detected by cytosolic sensors in antigen-specific B cells
Splenic NP-specific or non-NP-specific CD19+ B cells were collected from C57BL/6J mice (A, C and D) or IghB1-8+ transgenic mice (B) 4.5 days post-immunization with NP-Ficoll (N = 3 per experiment). (A) Transcript levels of the indicated ERVs measured by RT-qPCR of mRNA isolated from NP-specific or non-NP-specific B cells. Data were normalized to GAPDH mRNA levels in the same cells. Due to copy number differences the magnitude of upregulation of different ERVs cannot be directly compared in this experiment. (B) IghB1-8+ transgenic mice express a recombined variable region derived from an NP-binding antibody in place of the endogenous 3′ Igh-D element (DQ52) and the Igh-J elements. RT-qPCR of the indicated ERV mRNAs immunoprecipitated with RIG-I from NP-specific or non-NP-specific B cells. Data were normalized to the level of GAPDH mRNA bound to RIG-I in the same samples, which represents a non-specific interaction equivalent in NP-specific and non-NP-specific cells as shown in fig. S7E. (C) qPCR of ERV DNA in the cytoplasmic fraction of NP-specific or non-NP-specific B cells. Data were normalized to GAPDH intronic DNA levels in the same cells. Note that endogenous eMLV and MMTV were amplified with primers targeting spliced cDNAs; these species likely represent a minority of the cytoplasmic eMLV and MMTV cDNAs and thus may not precisely reflect total eMLV and MMTV cDNA levels. (D) RT activity in the indicated B cells from C57BL/6J mice. (E and F) Splenic CD19+ B cells from mice of the indicated genotypes were treated with NP-Ficoll plus RT inhibitors (AZT, NVP, ddI) or NP-Ficoll plus vehicle for 2 days, and CD86 (E) or GL7 expression (F) was measured in NP-specific B cells. N = 3 mice for each genotype. MFI, mean fluorescence intensity. (G) Serum NP-specific IgM on day 4.5 post-NP-Ficoll immunization of mice pretreated for 3 days with RT inhibitors (AZT, NVP) or vehicle. RT inhibitor treatment continued after immunization until measurement of serum IgM. (H) Serum NP-specific IgM on day 4.5 post-immunization with NP-Ficoll. Data points represent individual mice (D, G, H). P values were determined by Student’s t test (A–C) or one-way ANOVA and post hoc Tukey test (D–H). n.d., not detected. Results are representative of 2–3 independent experiments.
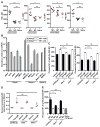
Figure 4. cGAMP elevation and ERV transcription are induced by BCR signaling
(A–C) Mouse splenic B cells were cultured in vitro and stimulated with anti-IgM or vehicle for 22 hr. (A) CD86 and MHCII expression. (B) Transcript levels of the indicated ERVs measured by RT-qPCR of isolated mRNA. Data were normalized to GAPDH mRNA levels in the same cells. N = 3 mice per genotype. (C) Chromatograms of cGAMP in C57BL/6J B cells measured by LC-MS/MS. N = 3 mice. (D) Human B cells from healthy donor peripheral blood (N = 3 individuals) were cultured in vitro and stimulated with anti-IgM, anti-IgM + Ibrutinib, or vehicle for 48 hr. Transcript levels of the indicated human ERVs measured by RT-qPCR of isolated mRNA. (E) Serum NP-specific IgM on day 4.5 post-immunization with NP-Ficoll. (F) Transcript levels of the indicated ERVs measured by RT-qPCR of mRNA isolated from NP-specific or non-NP-specific B cells. Data were normalized to GAPDH mRNA levels in the same cells. N = 3 mice per genotype. (G) Activation marker expression by human B cells treated as in D, or with 0.06 μM cGAMP for 48 hr. MFI, mean fluorescence intensity. Data points represent individual mice or humans (A, E, G). P values were determined by Student’s t test (B, D–F) or one-way ANOVA and post hoc Tukey test (A, G). Results are representative of 2 independent experiments.
Figure 5. NF-κB is required for ERV induction and is activated by BCR and MAVS signaling
(A, B) Splenic NP-specific or non-NP-specific CD19+ B cells were collected from mice 4.5 days post-immunization with NP-Ficoll. (A) Cytokine expression in the indicated B cells from C57BL/6J mice. (B) Transcript levels of the indicated ERVs measured by RT-qPCR of mRNA isolated from NP-specific or non-NP-specific B cells. N = 3 mice. No significant difference was found between NP+ and NP− cells for any ERV tested. (C–D) Splenic B cells were cultured in vitro and stimulated with anti-IgM or vehicle for 22 hr. (C) Levels of phospho-p65 (left) and phospho-p105 (right). N = 3 mice. (D) Levels of p65 in the nuclear fraction of cells. (E) Levels of phospho-p105 in splenic NP-specific and non-NP-specific CD19+ B cells or naïve B cells on day 6 post-NP-Ficoll immunization. N = 3 mice per genotype. MFI, mean fluorescence intensity. Data points represent individual mice (A, D). P values were determined by Student’s t test (B) or one-way ANOVA and post hoc Tukey test (A, C–E). Results are representative of 2 independent experiments.
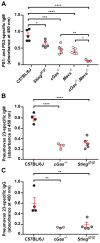
Figure 6. TI-2 antibody responses to Streptococcus pneumoniae PS1 and PS3 and to the commercial vaccine Pneumovax 23 require cytosolic DNA and RNA sensing pathways
(A) Serum PS1- and PS3-specific IgM on day 4.5 post-immunization with S. pneumoniae PS1 and PS3. (B and C) Serum PPV-23-specific IgM (B) and IgG (C) on day 5.5 post-immunization with Pneumovax 23. Data points represent individual mice. P values were determined by one-way ANOVA and post hoc Tukey test (A) or Student’s t test (B and C). Results are representative of 2–3 independent experiments.
Comment in
- Immunology. Retroviral help for B cells.
Grasset EK, Cerutti A. Grasset EK, et al. Science. 2014 Dec 19;346(6216):1454-5. doi: 10.1126/science.aaa3263. Science. 2014. PMID: 25525229 No abstract available.
Similar articles
- Immunology. Retroviral help for B cells.
Grasset EK, Cerutti A. Grasset EK, et al. Science. 2014 Dec 19;346(6216):1454-5. doi: 10.1126/science.aaa3263. Science. 2014. PMID: 25525229 No abstract available. - Cyclic GMP-AMP as an Endogenous Second Messenger in Innate Immune Signaling by Cytosolic DNA.
Kato K, Omura H, Ishitani R, Nureki O. Kato K, et al. Annu Rev Biochem. 2017 Jun 20;86:541-566. doi: 10.1146/annurev-biochem-061516-044813. Epub 2017 Apr 7. Annu Rev Biochem. 2017. PMID: 28399655 Review. - Endogenous retroviruses are associated with hippocampus-based memory impairment.
Sankowski R, Strohl JJ, Huerta TS, Nasiri E, Mazzarello AN, D'Abramo C, Cheng KF, Staszewski O, Prinz M, Huerta PT, Al-Abed Y. Sankowski R, et al. Proc Natl Acad Sci U S A. 2019 Dec 17;116(51):25982-25990. doi: 10.1073/pnas.1822164116. Epub 2019 Dec 2. Proc Natl Acad Sci U S A. 2019. PMID: 31792184 Free PMC article. - The B cell SH2/PH domain-containing adaptor Bam32/DAPP1 is required for T cell-independent II antigen responses.
Fournier E, Isakoff SJ, Ko K, Cardinale CJ, Inghirami GG, Li Z, Curotto de Lafaille MA, Skolnik EY. Fournier E, et al. Curr Biol. 2003 Oct 28;13(21):1858-66. doi: 10.1016/j.cub.2003.09.034. Curr Biol. 2003. PMID: 14588241 - The cGAS-STING pathway as a therapeutic target in inflammatory diseases.
Decout A, Katz JD, Venkatraman S, Ablasser A. Decout A, et al. Nat Rev Immunol. 2021 Sep;21(9):548-569. doi: 10.1038/s41577-021-00524-z. Epub 2021 Apr 8. Nat Rev Immunol. 2021. PMID: 33833439 Free PMC article. Review.
Cited by
- Regulation and function of the cGAS-STING pathway of cytosolic DNA sensing.
Chen Q, Sun L, Chen ZJ. Chen Q, et al. Nat Immunol. 2016 Sep 20;17(10):1142-9. doi: 10.1038/ni.3558. Nat Immunol. 2016. PMID: 27648547 Review. - The Sophisticated Transcriptional Response Governed by Transposable Elements in Human Health and Disease.
Marasca F, Gasparotto E, Polimeni B, Vadalà R, Ranzani V, Bodega B. Marasca F, et al. Int J Mol Sci. 2020 Apr 30;21(9):3201. doi: 10.3390/ijms21093201. Int J Mol Sci. 2020. PMID: 32366056 Free PMC article. Review. - The Ro60 autoantigen binds endogenous retroelements and regulates inflammatory gene expression.
Hung T, Pratt GA, Sundararaman B, Townsend MJ, Chaivorapol C, Bhangale T, Graham RR, Ortmann W, Criswell LA, Yeo GW, Behrens TW. Hung T, et al. Science. 2015 Oct 23;350(6259):455-9. doi: 10.1126/science.aac7442. Epub 2015 Sep 17. Science. 2015. PMID: 26382853 Free PMC article. - Immune responses to endogenous retroelements: taking the bad with the good.
Kassiotis G, Stoye JP. Kassiotis G, et al. Nat Rev Immunol. 2016 Apr;16(4):207-19. doi: 10.1038/nri.2016.27. Nat Rev Immunol. 2016. PMID: 27026073 Review. - The cGAS/STING Pathway Detects Streptococcus pneumoniae but Appears Dispensable for Antipneumococcal Defense in Mice and Humans.
Ruiz-Moreno JS, Hamann L, Jin L, Sander LE, Puzianowska-Kuznicka M, Cambier J, Witzenrath M, Schumann RR, Suttorp N, Opitz B. Ruiz-Moreno JS, et al. Infect Immun. 2018 Feb 20;86(3):e00849-17. doi: 10.1128/IAI.00849-17. Print 2018 Mar. Infect Immun. 2018. PMID: 29263110 Free PMC article.
References
- Mond JJ, Lees A, Snapper CM. T cell-independent antigens type 2. Annu Rev Immunol. 1995;13:655–692. - PubMed
- Materials and methods are available as supporting material on Science Online.
- Cai X, Chiu YH, Chen ZJ. The cGAS-cGAMP-STING pathway of cytosolic DNA sensing and signaling. Mol Cell. 2014;54:289–296. - PubMed
- Goff SP. Host factors exploited by retroviruses. Nat Rev Microbiol. 2007;5:253–263. - PubMed
Publication types
MeSH terms
Substances
Grants and funding
- R01 CA157996/CA/NCI NIH HHS/United States
- HHMI/Howard Hughes Medical Institute/United States
- U19 AI100627/AI/NIAID NIH HHS/United States
- P01 AI070167/AI/NIAID NIH HHS/United States
- R01 AI093967/AI/NIAID NIH HHS/United States
LinkOut - more resources
Full Text Sources
Other Literature Sources
Molecular Biology Databases
Research Materials
Miscellaneous
