Comparative transcriptome analyses reveal core parasitism genes and suggest gene duplication and repurposing as sources of structural novelty - PubMed (original) (raw)
doi: 10.1093/molbev/msu343. Epub 2014 Dec 21.
Eric K Wafula 2, Loren A Honaas 1, Huiting Zhang 3, Malay Das 4, Monica Fernandez-Aparicio 5, Kan Huang 6, Pradeepa C G Bandaranayake 7, Biao Wu 7, Joshua P Der 2, Christopher R Clarke 4, Paula E Ralph 8, Lena Landherr 8, Naomi S Altman 9, Michael P Timko 6, John I Yoder 7, James H Westwood 4, Claude W dePamphilis 10
Affiliations
- PMID: 25534030
- PMCID: PMC4327159
- DOI: 10.1093/molbev/msu343
Comparative transcriptome analyses reveal core parasitism genes and suggest gene duplication and repurposing as sources of structural novelty
Zhenzhen Yang et al. Mol Biol Evol. 2015 Mar.
Abstract
The origin of novel traits is recognized as an important process underlying many major evolutionary radiations. We studied the genetic basis for the evolution of haustoria, the novel feeding organs of parasitic flowering plants, using comparative transcriptome sequencing in three species of Orobanchaceae. Around 180 genes are upregulated during haustorial development following host attachment in at least two species, and these are enriched in proteases, cell wall modifying enzymes, and extracellular secretion proteins. Additionally, about 100 shared genes are upregulated in response to haustorium inducing factors prior to host attachment. Collectively, we refer to these newly identified genes as putative "parasitism genes." Most of these parasitism genes are derived from gene duplications in a common ancestor of Orobanchaceae and Mimulus guttatus, a related nonparasitic plant. Additionally, the signature of relaxed purifying selection and/or adaptive evolution at specific sites was detected in many haustorial genes, and may play an important role in parasite evolution. Comparative analysis of gene expression patterns in parasitic and nonparasitic angiosperms suggests that parasitism genes are derived primarily from root and floral tissues, but with some genes co-opted from other tissues. Gene duplication, often taking place in a nonparasitic ancestor of Orobanchaceae, followed by regulatory neofunctionalization, was an important process in the origin of parasitic haustoria.
Keywords: Orobanchaceae; gene duplication; novel traits; parasitism; protease; transcriptome.
© The Author 2014. Published by Oxford University Press on behalf of the Society for Molecular Biology and Evolution.
Figures
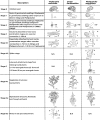
Fig. 1.
An illustration of stages of each parasitic plant used in the PPGP (Westwood et al. 2012) in this study. Drawings are based on original photographs, as shown in Nickrent et al. (1979), Musselman and Hepper (1986), Zhang (1988), and Rumsey and Jury (1991). Additional sequences from the parasite–host interface (Honaas et al. 2013) were also used to study haustorial-specific gene expression (stage 4). H, host; P, parasite; V, vasculature; R, root; S, shoot; N/A, not applicable.
Fig. 2.
Gene expression profiles from RNA-seq data for two previously characterized parasitism genes in Triphysaria (QR1, left_,_ and Pirin, right). The two genes were shown to be upregulated in stage 2 relative to stage 1 by RT-PCR, which was confirmed by RNA-Seq data. The organ/stage of the parasite sampled is shown along the x axis. Labels on the x axis refer to stage (see fig. 1) and “u” means that this facultative parasite was growing “unattached” to any host (i.e., 6.1u means unattached stage 6.1). The y axis gives expression values as FPKM on a log2 scale.
Fig. 3.
Gene expression clustering boxplots (A) and heatmaps (B) of upregulated genes in postattachment haustorial stages 3 and 4 (haustorial genes) in parasitic Orobanchaceae. (A) One cluster of highest expression in post attachment haustorial stages with K-means clustering in each species (511 in Triphysaria, 958 in Striga, and 126 in Phelipanche). Expression in each stage is represented by a boxplot. The upper whisker of the boxplot indicates the highest expression value for features within each cluster; the lower whisker, the lowest expression value; and the middle line, the median expression. The upper and lower edges of the box represent the 75th and 25th percentile, respectively. Expression of genes in the postattachment haustorial stages is highlighted in green. A description of the focal stages is shown on the lower right. (B) Gene expression heat map of component-orthogroups with upregulated expression in postattachment haustorial (stage 3 and/or 4) stages identified by K-means and hierarchical clustering in Triphysaria, Striga, and Phelipanche. The color-intensity in the heat map represents expression value (log2FPKM).
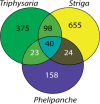
Fig. 4.
Venn diagram illustrating the number of orthogroups with upregulated expression in stage 3 and/or stage 4 (by K-means and SOM) in Triphysaria, Striga, and Phelipanche.
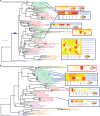
Fig. 5.
Gene family phylogeny and gene expression profile of two orthogroups showing: (A) Shift of gene expression from flower to haustorium following gene duplication, and (B) shift of gene expression from root to haustorium without gene duplication. Gene duplication events relevant to the origin of parasite genes are shown on the tree with blue rectangular bars. Sequence names are color-coded to represent different lineages: Basal angiosperms (blue), monocots (yellow), basal eudicots (purple), rosids (red), and asterids (green). Parasite genes are highlighted with yellow background and green foreground. The expression of parasite genes and nonparasite genes in Arabidopsis, Medicago, and tomato are shown using heat maps. Green and red lines are connecting genes from the phylogeny to the heatmap for nonparasitic genes (except in Arabidopsis orthogroup 1131 where genes are labeled as PLLs) and parasitic genes. The tissue with the highest expression was labeled in red. The color intensity in heatmaps refers to expression measurements with an RNA-Seq approach in parasites and tomato, and with microarrays in Arabidopsis and Medicago. Int or int means “interface” tissue of haustoria (∼stage 4) (Honaas 2013), and hau means “haustoria.”.
Fig. 6.
HIGs: Orthogroups containing genes upregulated in root or seedlings following HIF exposure (stage 2) compared with germinating seedlings (stage 1) in Triphysaria, Striga, and Phelipanche. The numbers in parenthesis are the corresponding set of orthogroups when including genes that are highly expressed in stage 1 (relative to any other stages of stage 0, 2, 3, 4, 6.1, and 6.2—by K-means clustering) of Phelipanche.
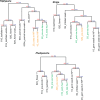
Fig. 7.
Overall similarity of transcriptional profiles of all stages in three parasites. Numerical values represent supports as estimated by the approximately unbiased (on left, in red) and bootstrap (on right, in blue) as described in the Materials and Methods. Clustering was performed with complete linkage and correlation distance. Haustoria tissues (from stages 3 and 4) are labeled in green, whereas root tissues (from stages 1, 2, and 5.2) are labeled in orange.
Fig. 8.
Haustorial genes in parasitic species were recruited from root, flower, and other tissues. Values on the y axis show the number of orthogroups containing haustorial genes as identified from expression analysis of nonparasitic model species Arabidopsis, Medicago, and tomato. Tissues on the x axis represent the principally expressed tissue for orthologs of upregulated haustorial genes in Arabidopsis (light black), Medicago (gray), and tomato (black). Floral tissues are highlighted with stars on top of the bars.
Fig. 9.
Haustorial genes show evidence of adaptive selection or relaxed selective constraint. Symmetric violin plots show the genome-wide distributions of d_N_/d_S_ values for comparisons of Phelipanche aegyptiaca (Pa), Striga hermonthica (Sh) and Triphysaria versicolor (Tv). Red dots represent haustorial genes shared by all three species, whereas blue dots represent randomly selected nonhaustorial genes from the relevant species. The density plots colored in red and blue represent the frequency distributions of the individual d_N_/d_S_ values as seen in the dot distributions of haustorial and nonhaustorial genes.
Similar articles
- Haustorial Hairs Are Specialized Root Hairs That Support Parasitism in the Facultative Parasitic Plant Phtheirospermum japonicum.
Cui S, Wakatake T, Hashimoto K, Saucet SB, Toyooka K, Yoshida S, Shirasu K. Cui S, et al. Plant Physiol. 2016 Mar;170(3):1492-503. doi: 10.1104/pp.15.01786. Epub 2015 Dec 28. Plant Physiol. 2016. PMID: 26712864 Free PMC article. - Transcriptomes of the parasitic plant family Orobanchaceae reveal surprising conservation of chlorophyll synthesis.
Wickett NJ, Honaas LA, Wafula EK, Das M, Huang K, Wu B, Landherr L, Timko MP, Yoder J, Westwood JH, dePamphilis CW. Wickett NJ, et al. Curr Biol. 2011 Dec 20;21(24):2098-104. doi: 10.1016/j.cub.2011.11.011. Epub 2011 Dec 8. Curr Biol. 2011. PMID: 22169535 - Evolution of a horizontally acquired legume gene, albumin 1, in the parasitic plant Phelipanche aegyptiaca and related species.
Zhang Y, Fernandez-Aparicio M, Wafula EK, Das M, Jiao Y, Wickett NJ, Honaas LA, Ralph PE, Wojciechowski MF, Timko MP, Yoder JI, Westwood JH, Depamphilis CW. Zhang Y, et al. BMC Evol Biol. 2013 Feb 20;13:48. doi: 10.1186/1471-2148-13-48. BMC Evol Biol. 2013. PMID: 23425243 Free PMC article. - Haustorium Inducing Factors for Parasitic Orobanchaceae.
Goyet V, Wada S, Cui S, Wakatake T, Shirasu K, Montiel G, Simier P, Yoshida S. Goyet V, et al. Front Plant Sci. 2019 Aug 29;10:1056. doi: 10.3389/fpls.2019.01056. eCollection 2019. Front Plant Sci. 2019. PMID: 31555315 Free PMC article. Review. - Orobanchaceae parasite-host interactions.
Mutuku JM, Cui S, Yoshida S, Shirasu K. Mutuku JM, et al. New Phytol. 2021 Apr;230(1):46-59. doi: 10.1111/nph.17083. Epub 2020 Dec 10. New Phytol. 2021. PMID: 33202061 Review.
Cited by
- Mechanistic model of evolutionary rate variation en route to a nonphotosynthetic lifestyle in plants.
Wicke S, Müller KF, dePamphilis CW, Quandt D, Bellot S, Schneeweiss GM. Wicke S, et al. Proc Natl Acad Sci U S A. 2016 Aug 9;113(32):9045-50. doi: 10.1073/pnas.1607576113. Epub 2016 Jul 22. Proc Natl Acad Sci U S A. 2016. PMID: 27450087 Free PMC article. - Genome-enabled discovery of candidate virulence loci in Striga hermonthica, a devastating parasite of African cereal crops.
Qiu S, Bradley JM, Zhang P, Chaudhuri R, Blaxter M, Butlin RK, Scholes JD. Qiu S, et al. New Phytol. 2022 Oct;236(2):622-638. doi: 10.1111/nph.18305. Epub 2022 Jul 7. New Phytol. 2022. PMID: 35699626 Free PMC article. - Integrated Transcriptome and Proteome Analysis Reveals That Cell Wall Activity Affects Phelipanche aegyptiaca Parasitism.
Chen M, Zhang L, Yao Z, Cao X, Ma Q, Chen S, Zhang X, Zhao S. Chen M, et al. Plants (Basel). 2024 Mar 18;13(6):869. doi: 10.3390/plants13060869. Plants (Basel). 2024. PMID: 38592861 Free PMC article. - Genome-Guided Phylo-Transcriptomic Methods and the Nuclear Phylogentic Tree of the Paniceae Grasses.
Washburn JD, Schnable JC, Conant GC, Brutnell TP, Shao Y, Zhang Y, Ludwig M, Davidse G, Pires JC. Washburn JD, et al. Sci Rep. 2017 Oct 19;7(1):13528. doi: 10.1038/s41598-017-13236-z. Sci Rep. 2017. PMID: 29051622 Free PMC article. - Targeted Capture of Complete Coding Regions across Divergent Species.
Schott RK, Panesar B, Card DC, Preston M, Castoe TA, Chang BS. Schott RK, et al. Genome Biol Evol. 2017 Feb 1;9(2):398-414. doi: 10.1093/gbe/evx005. Genome Biol Evol. 2017. PMID: 28137744 Free PMC article.
References
- Aber M, Fer A, Salle G. Transfer of organic substances from the host plant Vicia faba to the parasite Orobanche renata Forsk. Z Pflanzenphysiol. 1983;112:297–308.
- Aly R, Cholakh H, Joel DM, Leibman D, Steinitz B, Zelcer A, Naglis A, Yarden O, Gal-On A. Gene silencing of mannose 6-phosphate reductase in the parasitic weed Orobanche aegyptiaca through the production of homologous dsRNA sequences in the host plant. Plant Biotechnol J. 2009;7:487–498. - PubMed
- Aly R, Hamamouch N, Abu-Nassar J, et al. Movement of protein and macromolecules between host plants and the parasitic weed Phelipanche aegyptiaca Pers. Plant Cell Rep. 2011;30:2233–2241. - PubMed
- Amborella Genome Project. The Amborella genome and the evolution of flowering plants. Science. 2013;342:1241089. - PubMed
Publication types
MeSH terms
LinkOut - more resources
Full Text Sources
Other Literature Sources


