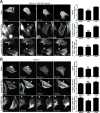
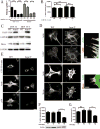
Profilin-1 serves as a gatekeeper for actin assembly by Arp2/3-dependent and -independent pathways - PubMed (original) (raw)
Profilin-1 serves as a gatekeeper for actin assembly by Arp2/3-dependent and -independent pathways
Jeremy D Rotty et al. Dev Cell. 2015.
Abstract
Cells contain multiple F-actin assembly pathways, including the Arp2/3 complex, formins, and Ena/VASP, which have largely been analyzed separately. They collectively generate the bulk of F-actin from a common pool of G-actin; however, the interplay and/or competition between these pathways remains poorly understood. Using fibroblast lines derived from an Arpc2 conditional knockout mouse, we established matched-pair cells with and without the Arp2/3 complex. Arpc2(-/-) cells lack lamellipodia and migrate more slowly than WT cells but have F-actin levels indistinguishable from controls. Actin assembly in Arpc2(-/-) cells was resistant to cytochalasin-D and was highly dependent on profilin-1 and Ena/VASP but not formins. Profilin-1 depletion in WT cells increased F-actin and Arp2/3 complex in lamellipodia. Conversely, addition of exogenous profilin-1 inhibited Arp2/3 complex actin nucleation in vitro and in vivo. Antagonism of the Arp2/3 complex by profilin-1 in cells appears to maintain actin homeostasis by balancing Arp2/3 complex-dependent and -independent actin assembly pathways.
Copyright © 2015 Elsevier Inc. All rights reserved.
Conflict of interest statement
The authors declare no conflicts of interest.
Figures
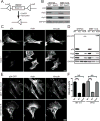
Figure 1. Generation and characterization of Arpc2−/− fibroblast cell lines
A) Schematic representation of tamoxifen-inducible CreER activation and Arpc2 (p34) deletion. B) Blot analysis of two mouse fibroblast cell lines without (WT) or with (Arpc2−/−) tamoxifen treatment. C) Staining of MTF24 WT and Arpc2−/− fibroblasts; scale bar = 20 microns. D) Blot analysis of cell lines without (WT), with (KO) tamoxifen treatment, or KO cells stably rescued with p34-GFP (KO-R). E) Staining of MEF 10-4 KO-R and MTF24 KO-R fibroblasts; GFP indicates p34-GFP; scale bars = 20 microns. F) Random migration velocity of WT, KO, and KO-R MEF 10-4 (black bars) and MTF24 (grey bars) fibroblasts; N = at least 54 cells per condition; error bars represent standard error of the mean; ***p-value < 0.0001. See also Figure S1.
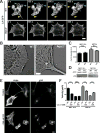
Figure 2. Comparison of actin structure and dynamics in WT and Arpc2−/− cells
A) Still frames from live cell imaging of MEF 10-4 WT and Arpc2−/− cells stably transfected with the live cell actin probe LifeAct (LA)-GFP showing dynamic F-actin behavior in each cell type. Cyan arrowheads denote protrusion, yellow arrowheads denote retraction; scale bar = 20 microns. B) Cryo-shadowing EM of F-actin networks in MTF24 WT and Arpc2−/− cellular protrusions; scale bar = 500 nm. C) Integrated pixel density of phalloidin staining in fixed WT and KO cells from both lines plotted as average F-actin intensity/cell. N = 100 cells per condition; error bars represent standard error of the mean; N.S. = Not Significant. D) Blots of whole cell lysates loaded by cell equivalents for both lines. E) Staining of MTF24 WT and Arpc2−/− fibroblasts in mixed culture (KO cells marked with *) after addition of 100 nM cytochalasin D (CD) for 2h; scale bar = 20 microns. F) Random migration velocity of MEF 10-4 (black bars) and MTF24 (grey bars) WT and KO control (−) cells or cells treated with 100 nM CD (+); N = at least 30 cells per condition; error bars represent standard error of the mean; ***p-value ≤ 0.0001. See also Figure S1.
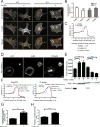
Figure 3. Actin assembly in Arpc2−/− cells is highly dependent upon profilin
A) Barbed end assay relating the distribution of labeled barbed ends to total F-actin in MEF 10-4 WT or KO cells in the absence (−) or presence (+) of profilin; scale bar = 10 microns. B) Quantification of barbed end staining. Barbed end fluorescence intensity normalized to F-actin, with each condition plotted relative to control cells (WT minus profilin). **p-value = 0.0036, ***p-value = 0.0001. C) Barbed end distribution at the periphery of WT MEF 10-4 cells in the presence (+) or absence (−) of profilin in barbed end assay (cell edge = 0, negative values = intracellular distance from edge). Plotted as mean ± SEM. The mean width of the peak intensity was also quantified, analyzed by T-test and is presented numerically alongside the graph. D) Staining of MEF 10-4 WT and Arpc2−/− Profilin-1 KD fibroblasts (Pfn1 KD) in mixed culture (KO cell marked with *); scale bar = 20 microns. E) Integrated pixel density of phalloidin staining in fixed MEF 10-4 WT and KO cells ± Pfn1 KD plotted as average F-actin intensity/cell, with SEM. N = 50 cells per condition, ***p-value < 0.0001, **p-value = 0.0003. Blots of whole cell lysate matched by cell number directly below. F) Distribution of p34 and F-actin at the periphery of control or Pfn1 KD MEF 10-4 cells (cell edge = 0, negative values = intracellular distance from edge). Plotted as mean ± SEM. The mean width of the peak intensity was also quantified, analyzed by T-test and is presented numerically alongside the graph. G) Comparison of Arp2/3 positive edge in MEF 10-4 control or Pfn1 KD cells. High Arp2/3 complex signal in a narrow band along the perimeter was detected and divided by total cell perimeter to yield Arp2/3 complex enriched edge, plotted as average percent Arp2/3 complex positive edge with SEM. N = 29 for WT, 24 for WT Pfn1 KD cells, ***p < 0.0001. H) Peripheral lamellipodia length. The length of p34 positive edge was determined by outlining the periphery of each protrusion in ImageJ to yield the peripheral length in microns. N = at least 128 lamellipodia. ***p < 0.0001. See also Figure S2, S3.
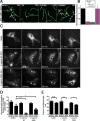
Figure 4. Profilin inhibits Arp2/3 complex actin nucleation, disrupts Arp2/3 complex leading edge localization and impedes lamellipodia generation
A) Time-lapse TIRF microscopy of 1.5 μM Oregon green-labeled actin polymerized in the presence of 40 nM Arp2/3 complex, 150 nM pWA in the absence (No Prf) or presence of either 5 μM WT (+ Prf), Y6D, or R88E hProfilin-1. Scale bar = 2 microns. B) Effect of WT, Y6D or R88E hProfilin-1 on branch density, quantified from time-lapse TIRF experiments in A. Plotted as mean plus SEM. C) Representative images of p34-GFP localization before (0 min) and at various times after microinjection of buffer, 2 mg/mL WT hProfilin-1, or 2 mg/mL R88E hProfilin-1. Scale bar = 20 microns. Asterisks denote microinjected cells in images with multiple cells. D) Percent of p34-GFP positive edge. Quantified as positive edge/total edge × 100% based on measurements done by hand in ImageJ. Measurements were made before and directly after microinjection for each condition, plotted as mean with SEM. N = at least 31 cells per condition. ***p-value < 0.0001, *p-value < 0.05; p-values for each post-injection mean are to pre-injected cells of same condition, unless explicitly noted otherwise. E) Peripheral lamellipodia length. The length of p34-GFP positive edge was determined by outlining the periphery of each protrusion in ImageJ to yield the peripheral length in microns, plotted as mean with SEM. N = at least 66 lamellipodia in pre-injection for each condition; N = 67 for buffer post-injection, 58 for R88E post-injection and 11 for WT post-injection. ***p-value = 0.0006, *p-value = 0.0426. See also Figure S3.
Figure 5. Profilin affects overall F-actin structure in cells with functional Arp2/3 complex
A) Representative images of Lifeact-RFP labeling in p34 knockout-rescue cells (Arpc2−/−; p34-GFP rescue) before (0 min.) and at various times after microinjection of buffer, 2 mg/mL WT hProfilin-1, or 2 mg/mL R88E hProfilin-1. Scale bar = 20 microns. Asterisks denote microinjected cells in images with multiple cells. Right: Quantification of stress fiber number from images before, after and at the end (‘final’) of the post-injection time course. Counted as number of stress fibers across a line drawn perpendicular to the predominant stress fiber orientation, plotted as mean with SEM; N = 198 measurements from 66 buffer-injected cells, 78 measurements from 26 WT hProfilin-1 injected cells, 60 measurements from 20 R88E hProfilin-1 injected cells. ***p-value < 0.0001. B) Representative images of Lifeact-RFP labeling in Arpc2−/− cells before (0 min.) and at various times after microinjection of buffer, 2 mg/mL WT hProfilin-1, or 2 mg/mL R88E hProfilin-1. Scale bar = 20 microns. Asterisks denote microinjected cells in images with multiple cells. Right: Quantification of stress fiber number, plotted as mean with SEM; N = 36 measurements from 12 buffer-injected cells, 60 measurements from 20 WT hProfilin-1 injected cells, or 42 measurements from 14 R88E hProfilin-1 injected cells. *p-value = 0.0103. See also Figure S3.
Figure 6. Formin and Ena/VASP differentially affect actin homeostasis depending on cellular Arp2/3 complex status
A) Random migration velocity of MEF 10-4 (black bars) and MTF24 (grey bars) WT and KO control (−) cells or cells treated with 15 μM SMIFH2 (+), plotted as mean and SEM; N = at least 48 cells per condition. ***p-value < 0.0001, **p-value = 0.0040, *p-value = 0.0219, N.S. = Not Significant. B) Integrated pixel density of phalloidin staining in fixed MEF 10-4 WT and KO cells in the presence or absence of 15 μM SMIFH2, plotted as average F-actin intensity/cell, with SEM. N = at least 120 cells per condition. C) Blots of WT and Arpc2−/− cells. D) Staining of MEF 10-4 WT and Arpc2−/− fibroblasts; scale bar = 20 microns. Boxed regions are magnified and merged with VASP or Mena in red and F-actin in green; scale bar of magnified image is 5 microns. E) Staining of MEF 10-4 WT and Arpc2−/− cells expressing GFP-FP4-mito; scale bar = 20 microns. F) Integrated pixel density of phalloidin staining in fixed MEF 10-4 WT and KO cells, or WT/KO cells stably expressing GFP-FP4-mito (FP4-mito +), plotted as average F-actin intensity/cell, with standard error of the mean. N = at least 38 cells per condition; ***p-value < 0.0001. Blots of whole cell lysate matched by cell number directly below. G) Spread cell area in sq. microns of MEF 10-4 WT, WT FP4-mito, KO and KO FP4-mito cells plotted as average area/cell with SEM. N = at least 140 cells per condition; ***p-value < 0.0001. See also Figures S4–S6.
Comment in
- Global resource distribution: allocation of actin building blocks by profilin.
Henty-Ridilla JL, Goode BL. Henty-Ridilla JL, et al. Dev Cell. 2015 Jan 12;32(1):5-6. doi: 10.1016/j.devcel.2014.12.022. Dev Cell. 2015. PMID: 25584793
Similar articles
- Profilin regulates F-actin network homeostasis by favoring formin over Arp2/3 complex.
Suarez C, Carroll RT, Burke TA, Christensen JR, Bestul AJ, Sees JA, James ML, Sirotkin V, Kovar DR. Suarez C, et al. Dev Cell. 2015 Jan 12;32(1):43-53. doi: 10.1016/j.devcel.2014.10.027. Epub 2014 Dec 24. Dev Cell. 2015. PMID: 25543282 Free PMC article. - Global resource distribution: allocation of actin building blocks by profilin.
Henty-Ridilla JL, Goode BL. Henty-Ridilla JL, et al. Dev Cell. 2015 Jan 12;32(1):5-6. doi: 10.1016/j.devcel.2014.12.022. Dev Cell. 2015. PMID: 25584793 - Arp2/3 and Mena/VASP Require Profilin 1 for Actin Network Assembly at the Leading Edge.
Skruber K, Warp PV, Shklyarov R, Thomas JD, Swanson MS, Henty-Ridilla JL, Read TA, Vitriol EA. Skruber K, et al. Curr Biol. 2020 Jul 20;30(14):2651-2664.e5. doi: 10.1016/j.cub.2020.04.085. Epub 2020 May 28. Curr Biol. 2020. PMID: 32470361 Free PMC article. - Formin-binding proteins: modulators of formin-dependent actin polymerization.
Aspenström P. Aspenström P. Biochim Biophys Acta. 2010 Feb;1803(2):174-82. doi: 10.1016/j.bbamcr.2009.06.002. Epub 2009 Jul 7. Biochim Biophys Acta. 2010. PMID: 19589360 Review. - Formins: signaling effectors for assembly and polarization of actin filaments.
Evangelista M, Zigmond S, Boone C. Evangelista M, et al. J Cell Sci. 2003 Jul 1;116(Pt 13):2603-11. doi: 10.1242/jcs.00611. J Cell Sci. 2003. PMID: 12775772 Review.
Cited by
- A heterologous in-cell assay for investigating intermicrovillar adhesion complex interactions reveals a novel protrusion length-matching mechanism.
Weck ML, Crawley SW, Tyska MJ. Weck ML, et al. J Biol Chem. 2020 Nov 27;295(48):16191-16206. doi: 10.1074/jbc.RA120.015929. Epub 2020 Oct 13. J Biol Chem. 2020. PMID: 33051206 Free PMC article. - F-Actin Cytoskeleton Network Self-Organization Through Competition and Cooperation.
Kadzik RS, Homa KE, Kovar DR. Kadzik RS, et al. Annu Rev Cell Dev Biol. 2020 Oct 6;36:35-60. doi: 10.1146/annurev-cellbio-032320-094706. Annu Rev Cell Dev Biol. 2020. PMID: 33021819 Free PMC article. Review. - Profilin and formin constitute a pacemaker system for robust actin filament growth.
Funk J, Merino F, Venkova L, Heydenreich L, Kierfeld J, Vargas P, Raunser S, Piel M, Bieling P. Funk J, et al. Elife. 2019 Oct 24;8:e50963. doi: 10.7554/eLife.50963. Elife. 2019. PMID: 31647411 Free PMC article. - The Actin Cytoskeleton Responds to Inflammatory Cues and Alters Macrophage Activation.
Ronzier E, Laurenson AJ, Manickam R, Liu S, Saintilma IM, Schrock DC, Hammer JA, Rotty JD. Ronzier E, et al. Cells. 2022 May 31;11(11):1806. doi: 10.3390/cells11111806. Cells. 2022. PMID: 35681501 Free PMC article. - Tropomodulins Control the Balance between Protrusive and Contractile Structures by Stabilizing Actin-Tropomyosin Filaments.
Kumari R, Jiu Y, Carman PJ, Tojkander S, Kogan K, Varjosalo M, Gunning PW, Dominguez R, Lappalainen P. Kumari R, et al. Curr Biol. 2020 Mar 9;30(5):767-778.e5. doi: 10.1016/j.cub.2019.12.049. Epub 2020 Feb 6. Curr Biol. 2020. PMID: 32037094 Free PMC article.
References
- Bear J, Loureiro J, Libova I, Fassler R, Wehland J, Gertler F. Negative regulation of fibroblast motility by Ena/VASP proteins. Cell. 2000;101:717–728. - PubMed
- Bear JE, Svitkina TM, Krause M, Schafer DA, Loureiro JJ, Strasser GA, Maly IV, Chaga OY, Cooper JA, Borisy GG, et al. Antagonism between Ena/VASP Proteins and Actin Filament Capping Regulates Fibroblast Motility. Cell. 2002;109:509–521. - PubMed
Publication types
MeSH terms
Substances
Grants and funding
- UL1 TR000430/TR/NCATS NIH HHS/United States
- R01 GM083035/GM/NIGMS NIH HHS/United States
- GM111557/GM/NIGMS NIH HHS/United States
- GM079265/GM/NIGMS NIH HHS/United States
- R01 GM079265/GM/NIGMS NIH HHS/United States
- Howard Hughes Medical Institute/United States
- R01 GM111557/GM/NIGMS NIH HHS/United States
LinkOut - more resources
Full Text Sources
Other Literature Sources
Molecular Biology Databases
Miscellaneous
