Evolution and behavioural responses to human-induced rapid environmental change - PubMed (original) (raw)
Evolution and behavioural responses to human-induced rapid environmental change
Andrew Sih et al. Evol Appl. 2011 Mar.
Abstract
Almost all organisms live in environments that have been altered, to some degree, by human activities. Because behaviour mediates interactions between an individual and its environment, the ability of organisms to behave appropriately under these new conditions is crucial for determining their immediate success or failure in these modified environments. While hundreds of species are suffering dramatically from these environmental changes, others, such as urbanized and pest species, are doing better than ever. Our goal is to provide insights into explaining such variation. We first summarize the responses of some species to novel situations, including novel risks and resources, habitat loss/fragmentation, pollutants and climate change. Using a sensory ecology approach, we present a mechanistic framework for predicting variation in behavioural responses to environmental change, drawing from models of decision-making processes and an understanding of the selective background against which they evolved. Where immediate behavioural responses are inadequate, learning or evolutionary adaptation may prove useful, although these mechanisms are also constrained by evolutionary history. Although predicting the responses of species to environmental change is difficult, we highlight the need for a better understanding of the role of evolutionary history in shaping individuals' responses to their environment and provide suggestion for future work.
Keywords: anthropogenic stressors; behaviour; detection theory; ecological traps; environmental change; exotic predators; habitat loss; sensory ecology.
Figures
Figure 1
Past environments provide the evolutionary history that shapes sensory and cognitive processes controlling behaviour, as well as other traits and genetic variation. The fit of behaviour and other traits along with novel environments (that might match or mismatch past environments) influence individual fitness that governs population performance. Variations in fitness and genetic variation drive evolution that feeds back to determine future sensory and cognitive processes, behaviour, other traits and genetic variation. These, in turn, loop back to influence future fitness and population performance.
Figure 2
Influence of cue similarity, and use of general versus specialized cues, on recognition of novel cues. Shown are two-dimenstional cue spaces. E = cues produced by a stimulus from a species’ evolutionary past; N = cues produced by a novel stimulus. The circle or oval around each E is the cue space that elicits a response. (A) The new cue is similar to cues from the species’ past, and the focal species uses specific cues to elicit a response. The species recognizes the novel stimulus. (B) The new cue is not similar to cues from the past, and the species uses specific cues. The species does not recognize the novel stimulus. (C) New and past cues are dissimilar, but because the species uses general cues, it recognizes the new stimulus. (D) Prey recognition of a predator depends on how they use multiple cues. Prey could be alarmed by either A or B (above a threshold level for either) or might require cue A and B to be alarmed. Adapted from Sih et al. (2010).
Figure 3
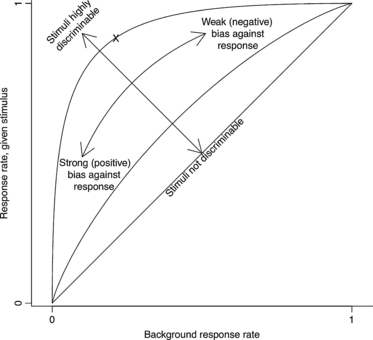
Three receiver operating characteristic (ROC) curves with discriminabilities of 0, 0.5 and 2. When discrimination is impossible (discriminability = 0), stimuli cannot affect behaviour, and the rate of successful detections equals the background response rate (1:1 line). As discriminability improves, these two rates can diverge and the ROC curve bows up and to the left. Organisms’ response probabilities are also influenced by their response bias – the level of confidence required to induce a response – which depends on the slope. The ‘X’ marks the organism considered in Figs 4 and 5, with discriminability = 2 and bias = −0.4.
Figure 4
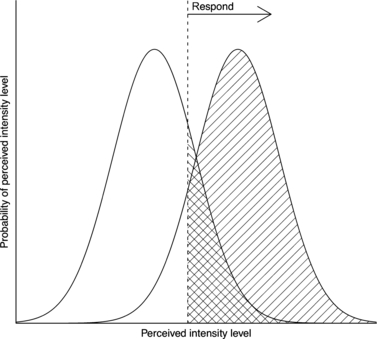
The inferred distributions of perceived intensities from stimuli (right curve) and nonstimuli (left curve) for the organism marked in Fig 3. Discriminability is the relative distance between the curves and corresponds to low overlap, while bias is the strength of evidence required to provoke a response, corresponding to the relative height of the curves. The hatched areas under each curve correspond to the organism's response rate for the corresponding scenario (i.e., its x and y coordinates in ROC space).
Figure 5
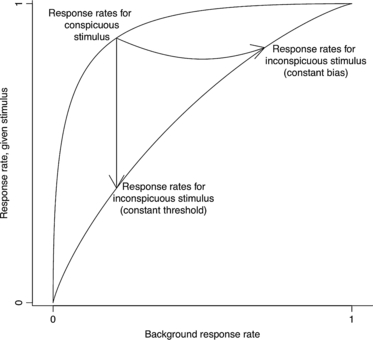
Here, the ability of the organism from Figs 3 and 4 to discriminate stimuli from nonstimuli decreases from 2 to 0.5. If the organism maintains the threshold intensity required to induce a response, its background response rate remains unchanged as it moves down through ROC space. If the organism instead takes its poorer discriminability into account and maintains a constant bias, it must adjust its response rates by following the curved arrow as described in the text.
Similar articles
- How the type of anthropogenic change alters the consequences of ecological traps.
Fletcher RJ Jr, Orrock JL, Robertson BA. Fletcher RJ Jr, et al. Proc Biol Sci. 2012 Jul 7;279(1738):2546-52. doi: 10.1098/rspb.2012.0139. Epub 2012 Feb 29. Proc Biol Sci. 2012. PMID: 22378802 Free PMC article. - Ecological novelty and the emergence of evolutionary traps.
Robertson BA, Rehage JS, Sih A. Robertson BA, et al. Trends Ecol Evol. 2013 Sep;28(9):552-60. doi: 10.1016/j.tree.2013.04.004. Epub 2013 Jun 5. Trends Ecol Evol. 2013. PMID: 23756104 Review. - Behavioural responses to human-induced environmental change.
Tuomainen U, Candolin U. Tuomainen U, et al. Biol Rev Camb Philos Soc. 2011 Aug;86(3):640-57. doi: 10.1111/j.1469-185X.2010.00164.x. Epub 2010 Oct 27. Biol Rev Camb Philos Soc. 2011. PMID: 20977599 Review. - Confounding factors in the detection of species responses to habitat fragmentation.
Ewers RM, Didham RK. Ewers RM, et al. Biol Rev Camb Philos Soc. 2006 Feb;81(1):117-42. doi: 10.1017/S1464793105006949. Epub 2005 Dec 1. Biol Rev Camb Philos Soc. 2006. PMID: 16318651 Review. - Anticipated effects of abiotic environmental change on intraspecific social interactions.
Fisher DN, Kilgour RJ, Siracusa ER, Foote JR, Hobson EA, Montiglio PO, Saltz JB, Wey TW, Wice EW. Fisher DN, et al. Biol Rev Camb Philos Soc. 2021 Dec;96(6):2661-2693. doi: 10.1111/brv.12772. Epub 2021 Jul 2. Biol Rev Camb Philos Soc. 2021. PMID: 34212487 Review.
Cited by
- Predatory Dogs as Drivers of Social Behavior Changes in the Central Himalayan Langur (Semnopithecus schistaceus) in Agro-Forest Landscapes.
Nautiyal H, Mathur V, Gajare KH, Teichroeb J, Sarkar D, Diogo R. Nautiyal H, et al. Biology (Basel). 2024 Jun 4;13(6):410. doi: 10.3390/biology13060410. Biology (Basel). 2024. PMID: 38927290 Free PMC article. - Between hunter and climate: the effects of hunting and environmental change on fecal glucocorticoid metabolite levels in two sympatric ungulate species in the Ruaha-Rungwa ecosystem, Tanzania.
Hariohay KM, Hunninck L, Ranke PS, Fyumagwa RD, Palme R, Røskaft E. Hariohay KM, et al. Conserv Physiol. 2023 Feb 7;11(1):coad002. doi: 10.1093/conphys/coad002. eCollection 2023. Conserv Physiol. 2023. PMID: 38026801 Free PMC article. - Evolutionary genomics: Insights from the invasive European starlings.
Stuart KC, Sherwin WB, Edwards RJ, Rollins LA. Stuart KC, et al. Front Genet. 2023 Jan 4;13:1010456. doi: 10.3389/fgene.2022.1010456. eCollection 2022. Front Genet. 2023. PMID: 36685843 Free PMC article. - Environmental oestrogens cause predation-induced population decline in a freshwater fish.
Rearick DC, Ward J, Venturelli P, Schoenfuss H. Rearick DC, et al. R Soc Open Sci. 2018 Oct 31;5(10):181065. doi: 10.1098/rsos.181065. eCollection 2018 Oct. R Soc Open Sci. 2018. PMID: 30473849 Free PMC article. - The influence of potential stressors on oviposition site selection and subsequent growth, survival and emergence of the non-biting midge (Chironomus tepperi).
Hale R, Colombo V, Hoak M, Pettigrove V, Swearer SE. Hale R, et al. Ecol Evol. 2019 Apr 10;9(9):5512-5522. doi: 10.1002/ece3.5148. eCollection 2019 May. Ecol Evol. 2019. PMID: 31110699 Free PMC article.
References
- Amo L, Lopez P, Martin J. Wall lizards combine chemical and visual cues of ambush snake predators to avoid overestimating risk inside refuges. Animal Behaviour. 2004;67:647–653.
- Andersen M, Aaars J. Short-term behavioral response of polar bears (Ursus maritimus) to snowmobile disturbance. Polar Biology. 2008;31:501–507.
- Andres S, Ribeyre F, Tourencq J-N, Boudou A. Interspecific comparison of cadmium and zinc contamination in the organs of four fish species along a polymetallic pollution gradient (Lot River, France) The Science of The Total Environment. 2000;248:11–25. - PubMed
- Baker BJ, Richardson JML. The effect of artificial light on male breeding-season behaviour in green frogs, Rana clamitans melanota. Canadian Journal of Zoology. 2006;84:1528–1532.
- Baldwin JM. A new factor in evolution. American Naturalist. 1896;30:441–451. 536–553.
LinkOut - more resources
Full Text Sources


