Single-cell transcriptome analysis reveals dynamic changes in lncRNA expression during reprogramming - PubMed (original) (raw)
Single-cell transcriptome analysis reveals dynamic changes in lncRNA expression during reprogramming
Daniel H Kim et al. Cell Stem Cell. 2015.
Abstract
Cellular reprogramming highlights the epigenetic plasticity of the somatic cell state. Long noncoding RNAs (lncRNAs) have emerging roles in epigenetic regulation, but their potential functions in reprogramming cell fate have been largely unexplored. We used single-cell RNA sequencing to characterize the expression patterns of over 16,000 genes, including 437 lncRNAs, during defined stages of reprogramming to pluripotency. Self-organizing maps (SOMs) were used as an intuitive way to structure and interrogate transcriptome data at the single-cell level. Early molecular events during reprogramming involved the activation of Ras signaling pathways, along with hundreds of lncRNAs. Loss-of-function studies showed that activated lncRNAs can repress lineage-specific genes, while lncRNAs activated in multiple reprogramming cell types can regulate metabolic gene expression. Our findings demonstrate that reprogramming cells activate defined sets of functionally relevant lncRNAs and provide a resource to further investigate how dynamic changes in the transcriptome reprogram cell state.
Copyright © 2015 Elsevier Inc. All rights reserved.
Figures
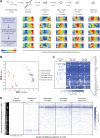
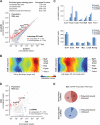
Figure 1. Single-cell transcriptome analysis of cellular reprogramming
(A) Schematic illustration of reprogramming experiments and single-cell RNA-seq analysis using the self-organizing map (SOM). Five representative SOM components are shown for each cell type. (B) Principal component (PC) analysis of 81 single-cell transcriptomes using all genes expressed at >1 RPKM. (C) Heatmap of protein-coding genes that correlate most highly (Pearson correlation) with Oct4 expression during the reprogramming time course. (D) Hierarchical clustering of activated protein-coding genes during the reprogramming time course using genes expressed at >10 RPKM in non-TTFs and <10 RPKM in all TTFs. See also Figure S1.
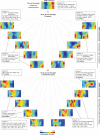
Figure 2. Analysis of transcriptome dynamics using the self-organizing map
Single-cell transcriptomes depicted as individual components of the self-organizing map (SOM). Boxes represent individual cells at defined stages of reprogramming, with clusters outlined in white. Significantly enriched gene ontology (GO) terms for indicated clusters are shown (Bonferroni-corrected P-values). See also Figure S2 and Table S1.
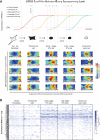
Figure 3. LncRNAs activated during reprogramming
(A) Schematic illustration of lncRNAs activated during defined stages of reprogramming (>10 RPKM) and lncRNA transcriptome analysis using the self-organizing map (SOM). Five representative SOM components are shown for each cell type. (D) Hierarchical clustering of activated lncRNA genes during the reprogramming time course using genes expressed at >10 RPKM in non-TTFs and <10 RPKM in all TTFs. See also Table S2.
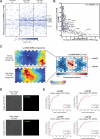
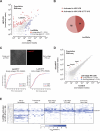
Figure 4. Activated lncRNA expression variability in iPS cells
(A) Heatmap of activated lncRNAs previously shown to physically associate with Polycomb repressive complex 2 in pluripotent stem cells. (B) Plot showing the relationship between average lncRNA expression and coefficient of variation in single late-stage iPS cells . (C) Individual cell components of the lncRNA SOM (left) and component variance for each hexagonal unit of the lncRNA SOM (right). (D) Representative phase contrast (merged with fluorescence) and fluorescence images of a single early-stage iPS cell using smFISH. Scale bar, 10 um. (E) Cumulative distribution function plots of lncRNA molecules per cell, as determined by smFISH. See also Figure S3 and Table S3.
Figure 5. Repression of developmental genes by Ladr49 and Ladr83
(A) Differential expression analysis of significantly upregulated or downregulated genes in late-stage iPS cells deficient for Ladr49, as determined by population level RNA-seq, and gene ontology (GO) analysis for significantly enriched GO terms in upregulated genes. Bonferroni-corrected P-values are shown. (B) Individual cell SOM components of indicated cell types with muscle-related genes labeled. (C) Effective read counts (normalized reads) for muscle-related (top) and reprogramming/pluripotency (bottom) genes in late-stage iPS cells, as determined by population level RNA-seq. (D) Differential expression analysis of significantly upregulated or downregulated lncRNA genes in ES cells versus TTF cells, as determined by population level RNA-seq. (E) Fraction of upregulated or downregulated lncRNAs that are physically associate with Polycomb repressive complex 2 in ES cells. See also Figure S4.
Figure 6. Lineage-specific role for Ladr317 in hematopoietic reprogramming
(A) Differential expression analysis of significantly upregulated or downregulated lncRNA genes in HPC versus HPC-iPS cells, as determined by population level RNA-seq. (B) Fraction of lncRNAs that are upregulated in HPC-iPS or both HPC-iPS and TTF-iPS cells. (C) Representative phase contrast (merged with fluorescence) and fluorescence images of a single early-stage iPS cell using smFISH, and cumulative distribution function plots of lncRNA molecules per cell, as determined by smFISH. Scale bar, 10 um. (D) Differential expression analysis of significantly upregulated or downregulated genes in late-stage iPS cells deficient for Ladr317, as determined by population level RNA-seq. (E) Hierarchical clustering of lncRNAs activated in HPC-iPS cells, as determined by single-cell RNA-seq. RPKM, reads per kilobase per million mapped reads.
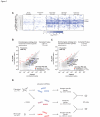
Figure 7. Regulation of metabolic genes by Ladr86 and Ladr91
(A) Hierarchical clustering of lncRNAs activated in both HPC-iPS and TTF-iPS cells, as determined by single-cell RNA-seq. RPKM, reads per kilobase per million mapped reads. Differential expression analysis of significantly upregulated or downregulated genes in late-stage iPS cells deficient for Ladr86 (B) or Ladr91 (C), as determined by population level RNA-seq, and gene ontology (GO) analysis for significantly enriched GO terms in downregulated genes. Bonferroni-corrected P-values are shown. (D) Model showing lineage-specific and lineage-independent functions of activated lncRNAs during fibroblast and blood cell reprogramming. See also Figures S5-S7 and Tables S4-S5.
Similar articles
- Combined RNA-seq and RAT-seq mapping of long noncoding RNAs in pluripotent reprogramming.
Du Z, Jia L, Wang Y, Wang C, Wen X, Chen J, Zhu Y, Yu D, Zhou L, Chen N, Zhang S, Celik I, Ay F, Gao S, Zhang S, Li W, Hoffman AR, Cui J, Hu JF. Du Z, et al. Sci Data. 2018 Nov 20;5:180255. doi: 10.1038/sdata.2018.255. Sci Data. 2018. PMID: 30457566 Free PMC article. - Role of Long Non-coding RNAs in Reprogramming to Induced Pluripotency.
Kanwal S, Guo X, Ward C, Volpe G, Qin B, Esteban MA, Bao X. Kanwal S, et al. Genomics Proteomics Bioinformatics. 2020 Feb;18(1):16-25. doi: 10.1016/j.gpb.2019.06.003. Epub 2020 May 21. Genomics Proteomics Bioinformatics. 2020. PMID: 32445708 Free PMC article. Review. - Long noncoding RNAs of single hematopoietic stem and progenitor cells in healthy and dysplastic human bone marrow.
Wu Z, Gao S, Zhao X, Chen J, Keyvanfar K, Feng X, Kajigaya S, Young NS. Wu Z, et al. Haematologica. 2019 May;104(5):894-906. doi: 10.3324/haematol.2018.208926. Epub 2018 Dec 13. Haematologica. 2019. PMID: 30545929 Free PMC article. - Genome-wide characterization of the routes to pluripotency.
Hussein SM, Puri MC, Tonge PD, Benevento M, Corso AJ, Clancy JL, Mosbergen R, Li M, Lee DS, Cloonan N, Wood DL, Munoz J, Middleton R, Korn O, Patel HR, White CA, Shin JY, Gauthier ME, Lê Cao KA, Kim JI, Mar JC, Shakiba N, Ritchie W, Rasko JE, Grimmond SM, Zandstra PW, Wells CA, Preiss T, Seo JS, Heck AJ, Rogers IM, Nagy A. Hussein SM, et al. Nature. 2014 Dec 11;516(7530):198-206. doi: 10.1038/nature14046. Nature. 2014. PMID: 25503233 - Single-Cell Transcriptome Analysis as a Promising Tool to Study Pluripotent Stem Cell Reprogramming.
Kim HK, Ha TW, Lee MR. Kim HK, et al. Int J Mol Sci. 2021 Jun 1;22(11):5988. doi: 10.3390/ijms22115988. Int J Mol Sci. 2021. PMID: 34206025 Free PMC article. Review.
Cited by
- Novel Approaches to Profile Functional Long Noncoding RNAs Associated with Stem Cell Pluripotency.
Zhu Y, Yan Z, Tang Z, Li W. Zhu Y, et al. Curr Genomics. 2020 Jan;21(1):37-45. doi: 10.2174/1389202921666200210142840. Curr Genomics. 2020. PMID: 32655297 Free PMC article. Review. - Optimal-Transport Analysis of Single-Cell Gene Expression Identifies Developmental Trajectories in Reprogramming.
Schiebinger G, Shu J, Tabaka M, Cleary B, Subramanian V, Solomon A, Gould J, Liu S, Lin S, Berube P, Lee L, Chen J, Brumbaugh J, Rigollet P, Hochedlinger K, Jaenisch R, Regev A, Lander ES. Schiebinger G, et al. Cell. 2019 Feb 7;176(4):928-943.e22. doi: 10.1016/j.cell.2019.01.006. Epub 2019 Jan 31. Cell. 2019. PMID: 30712874 Free PMC article. - Context-Dependent Impact of RAS Oncogene Expression on Cellular Reprogramming to Pluripotency.
Ferreirós A, Pedrosa P, Da Silva-Álvarez S, Triana-Martínez F, Vilas JM, Picallos-Rabina P, González P, Gómez M, Li H, García-Caballero T, González-Barcia M, Vidal A, Collado M. Ferreirós A, et al. Stem Cell Reports. 2019 May 14;12(5):1099-1112. doi: 10.1016/j.stemcr.2019.04.006. Epub 2019 May 2. Stem Cell Reports. 2019. PMID: 31056476 Free PMC article. - Gender Differences in Global but Not Targeted Demethylation in iPSC Reprogramming.
Milagre I, Stubbs TM, King MR, Spindel J, Santos F, Krueger F, Bachman M, Segonds-Pichon A, Balasubramanian S, Andrews SR, Dean W, Reik W. Milagre I, et al. Cell Rep. 2017 Jan 31;18(5):1079-1089. doi: 10.1016/j.celrep.2017.01.008. Cell Rep. 2017. PMID: 28147265 Free PMC article. - JSOM: Jointly-evolving self-organizing maps for alignment of biological datasets and identification of related clusters.
Lim HS, Qiu P. Lim HS, et al. PLoS Comput Biol. 2021 Mar 16;17(3):e1008804. doi: 10.1371/journal.pcbi.1008804. eCollection 2021 Mar. PLoS Comput Biol. 2021. PMID: 33724985 Free PMC article.
References
Publication types
MeSH terms
Substances
Grants and funding
- R01HD075605A/HD/NICHD NIH HHS/United States
- R01 HD075605/HD/NICHD NIH HHS/United States
- Howard Hughes Medical Institute/United States
- U54 HG007990/HG/NHGRI NIH HHS/United States
- U54 HG006998/HG/NHGRI NIH HHS/United States
LinkOut - more resources
Full Text Sources
Other Literature Sources
Molecular Biology Databases
