The APC tumor suppressor is required for epithelial cell polarization and three-dimensional morphogenesis - PubMed (original) (raw)
The APC tumor suppressor is required for epithelial cell polarization and three-dimensional morphogenesis
Alyssa C Lesko et al. Biochim Biophys Acta. 2015 Mar.
Abstract
The Adenomatous Polyposis Coli (APC) tumor suppressor has been previously implicated in the control of apical-basal polarity; yet, the consequence of APC loss-of-function in epithelial polarization and morphogenesis has not been characterized. To test the hypothesis that APC is required for the establishment of normal epithelial polarity and morphogenesis programs, we generated APC-knockdown epithelial cell lines. APC depletion resulted in loss of polarity and multi-layering on permeable supports, and enlarged, filled spheroids with disrupted polarity in 3D culture. Importantly, these effects of APC knockdown were independent of Wnt/β-catenin signaling, but were rescued with either full-length or a carboxy (c)-terminal segment of APC. Moreover, we identified a gene expression signature associated with APC knockdown that points to several candidates known to regulate cell-cell and cell-matrix communication. Analysis of epithelial tissues from mice and humans carrying heterozygous APC mutations further supports the importance of APC as a regulator of epithelial behavior and tissue architecture. These data also suggest that the initiation of epithelial-derived tumors as a result of APC mutation or gene silencing may be driven by loss of polarity and dysmorphogenesis.
Keywords: Adenomatous Polyposis Coli; Epithelial polarity; Madin–Darby Canine Kidney.
Copyright © 2015 Elsevier B.V. All rights reserved.
Figures
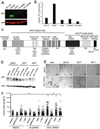
Figure 1. APC knockdown disrupts polarization and morphogenesis in mammary epithelial cells
A) APC protein expression in HC11 cells was analyzed by Western blot. B) Western Blot analysis of APC expression in HC11 cells normalized to actin expression. C) Control and APC-knockdown HC11 cells were plated on Transwell permeable supports for 5 d and analyzed for the localization of polarized protein markers, β-catenin (top row, green), Dlg (2nd row, green), Scribble (3rd row, red) and MUC1 (bottom row, red). All were co-stained with phalloidin and Hoechst (blue). Arrows show basolateral (β-catenin, Dlg and Scrib) and apical (MUC1) distribution of the markers in control cells and mislocalization and intracellular accumulation in the APC-knockdown cells. Multi-layering is apparent in the APC-knockdown cells. X-Z confocal planes are shown. Scale bars, 10 µm. D) Phase-contrast images of HC11 cells grown in 3D Matrigel cultures demonstrate larger, disorganized acini in cells with APC silencing compared to controls. Scale bars, 100 µm. E) Quantification of the acinus size indicated that APC-knockdown HC11 cells generated larger acini (*p < 0.05 via Fisher’s exact test). Representative images are shown of experiments, which were all performed three times.
Figure 2. MDCK 3D morphogenesis is perturbed by APC knockdown and restored by re-introduction of APC
A) APC protein expression in MDCK cells was analyzed by Western blot. B) APC protein expression in MDCK cells was quantified and normalized to actin expression. C) Schematic of the full-length APC protein including functional domains (top) and binding partners (bottom) and APCmid and APCc-ter fragments. D) APC protein expression in MDCK cells with expression of human full-length APC (hAPC-FL), the central fragment of APC (APCmid), and the c-terminus of APC (APCc-ter) was analyzed by Western Blot and normalized to actin expression. E) Phase-contrast images of MDCK and APC-knockdown MDCK cysts show an increase in cyst size and altered morphology in APC-knockdown cell compared to controls (left panels). The 2nd-4th columns show the phenotype with ectopic expression of human full-length APC (hAPC-FL), APCmid, or APCc-ter. Scale bars, 100 µm. F) Cyst size was increased in APC-knockdown cells compared to controls, and this size difference was reversed with the introduction of hAPC-FL. The enhanced cyst size was significantly abrogated by introduction of the APCc-ter construct. Shown is a a bar graph with average cyst size. Representative images are shown of experiments, which were all performed three times.
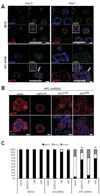
Figure 3. APC knockdown disrupts MDCK cell polarity in cysts grown 3D culture
A) Control and APC-knockdown MDCK cells were grown in Matrigel for 3 or 7 d and stained for the apical marker gp135 (red) and phalloidin (green). Control MDCK cells show apical localization of gp135 over the time course, but basal localization (white arrows) of gp135 is observed as early as 3 d post-plating in the APC-knockdown MDCK cells and the cysts are generally larger and have a less spherical morphology. Insets are higher magnification images of interest. Scale bars, 20 µm. B) Cysts from APC rescue cells (using hAPC-FL, APCc-ter, and APCmid) were grown for 7 d and stained for the apical marker, gp135, which as shown in Figure 3A is inverted in the APC-knockdown cells. With re-introduction of full-length APC or the APCc-ter construct, gp135 localization is restored to the apical surface in knockdown cells. Scale bars, 20 µm. Shown is a bar graph (C) quantifying the polarity phenotypes as percent apical (normal), and basal or mixed (abnormal). 100 cysts were counted for each cell line with the various APC constructs re-introduced. Significance was determined using Fisher’s exact test (* p < .05 compared to APC shRNA vector cells). Representative images are shown of experiments, which were all performed three times.
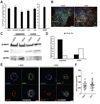
Figure 4. The phenotypes observed in APC-knockdown MDCK cells are not associated with Wnt/β-catenin pathway activation
A) TOPflash reporter assays were performed and no change in TCF reporter activity in the APC-knockdown cells or T23-S37A with stabilized β-catenin was detected. Human colorectal cancer cells harboring an APC mutation, SW480, were used as a positive control. B) The T23-S37A β-catenin MDCK cells, expressing inducible stabilized β-catenin were stained with anti-β-catenin (green) and anti-HA (red) antibodies. The presence of doxycycline (DOX) suppresses stable β-catenin expression, and removal of DOX results in expression of HA-tagged mutant β-catenin. Scale bars, 20 µm. C) Nuclear expression of β-catenin was increased in T23-S37A in the absence of DOX. Expression was analyzed by Western blot and is shown in a bar graph (D). E) Cells grown in 3D Matrigel culture for 12 d were stained for the apical marker gp135 (red) or phalloidin (green) and show apical localization of gp135. Scale bars, 20 µm. F) Cyst size was unchanged in the T23-S37A β-catenin MDCK cells in the presence or absence of DOX. Representative images are shown of experiments, which were all performed three times.
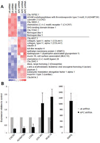
Figure 5. An APC-knockdown gene signature is associated with altered cell-cell and cell-matrix communication
A) Microarray analysis was performed on RNA from cells grown in 3D Matrigel culture for 5 d. Four wells were pooled to generate a single RNA sample, and 3 independent RNA samples per cell line were utilized in these studies. Global gene expression changes are shown in the heat map where overexpression is shown in red and underexpression is blue. B) Real-time PCR was used to validate some key gene expression differences, including CXCR7, ADAMTS6, LCN2, COL4A1, MUC16, and EMP2. Normalized expression relative to 18S rRNA is shown for real-time data.
Figure 6. Heterozygous APC mutation is associated with disrupted epithelial tissue architecture in vivo
A) In Apc+/+ colon, β-catenin (green) and E-cadherin (red) were analyzed by immunofluorescence and are basolaterally localized. Their localization is more disorganized, diffuse and often basally located in ApcMin/+ tissues. Nuclear β-catenin is only observed in microadenomas (white oval). Insets are higher magnification areas of interest. Scale bars, 20 µm. B) Immunohistochemistry for MUC1 (brown) shows that it is mislocalized and not restricted to the apical membrane in kidney tissues from ApcMin/+ mice compared Apc+/+ tissues. Tissues from ApcMin/+ are characterized by gaps between tubules and multi-layering of epithelial cells (black arrows). Scale bars, 20 µm. C) In non-adenomatous FAP colon tissues, β-catenin (green) is basolateral located, and MUC1 (red) is apical, in some areas (top), but other areas (middle/bottom panels) show cyosolic and basal β-catenin (black arrows) and intracellular MUC1 (white arrows). Multi-layering is evident (small white arrows). Insets are higher magnification areas of interest. Scale bars, 20 µm.
Similar articles
- Epithelial Membrane Protein 2 and β1 integrin signaling regulate APC-mediated processes.
Lesko AC, Prosperi JR. Lesko AC, et al. Exp Cell Res. 2017 Jan 1;350(1):190-198. doi: 10.1016/j.yexcr.2016.11.021. Epub 2016 Nov 24. Exp Cell Res. 2017. PMID: 27890644 - The APC tumor suppressor is required for epithelial integrity in the mouse mammary gland.
Prosperi JR, Becher KR, Willson TA, Collins MH, Witte DP, Goss KH. Prosperi JR, et al. J Cell Physiol. 2009 Aug;220(2):319-31. doi: 10.1002/jcp.21766. J Cell Physiol. 2009. PMID: 19326388 - N-terminal truncation mutations of adenomatous polyposis coli are associated with primary cilia defects.
Song L, Jia Y, Zhu W, Newton IP, Li Z, Li W. Song L, et al. Int J Biochem Cell Biol. 2014 Oct;55:79-86. doi: 10.1016/j.biocel.2014.08.010. Epub 2014 Aug 21. Int J Biochem Cell Biol. 2014. PMID: 25150829 - APC in cell migration.
Etienne-Manneville S. Etienne-Manneville S. Adv Exp Med Biol. 2009;656:30-40. doi: 10.1007/978-1-4419-1145-2_3. Adv Exp Med Biol. 2009. PMID: 19928350 Review. - Tissue-specific tumour suppression by APC.
Sansom O. Sansom O. Adv Exp Med Biol. 2009;656:107-18. Adv Exp Med Biol. 2009. PMID: 19928356 Review.
Cited by
- Genetic mutation and tumor microbiota determine heterogenicity of tumor immune signature: Evidence from gastric and colorectal synchronous cancers.
Yang W, Zhao Y, Ge Q, Wang X, Jing Y, Zhao J, Liu G, Huang H, Cheng F, Wang X, Ye Y, Song W, Liu X, Du J, Sheng J, Cao X. Yang W, et al. Front Immunol. 2022 Nov 7;13:947080. doi: 10.3389/fimmu.2022.947080. eCollection 2022. Front Immunol. 2022. PMID: 36420271 Free PMC article. - Cytoskeletal Control and Wnt Signaling-APC's Dual Contributions in Stem Cell Division and Colorectal Cancer.
Juanes MA. Juanes MA. Cancers (Basel). 2020 Dec 17;12(12):3811. doi: 10.3390/cancers12123811. Cancers (Basel). 2020. PMID: 33348689 Free PMC article. Review. - Adenomatous Polyposis Coli (APC) in cell migration.
Fang X, Svitkina TM. Fang X, et al. Eur J Cell Biol. 2022 Jun-Aug;101(3):151228. doi: 10.1016/j.ejcb.2022.151228. Epub 2022 Apr 22. Eur J Cell Biol. 2022. PMID: 35483122 Free PMC article. Review. - The roles of connexins and gap junctions in the progression of cancer.
Zhou M, Zheng M, Zhou X, Tian S, Yang X, Ning Y, Li Y, Zhang S. Zhou M, et al. Cell Commun Signal. 2023 Jan 13;21(1):8. doi: 10.1186/s12964-022-01009-9. Cell Commun Signal. 2023. PMID: 36639804 Free PMC article. Review. - Connexin43 as a Tumor Suppressor: Proposed Connexin43 mRNA-circularRNAs-microRNAs Axis Towards Prevention and Early Detection in Breast Cancer.
Naser Al Deen N, AbouHaidar M, Talhouk R. Naser Al Deen N, et al. Front Med (Lausanne). 2019 Aug 28;6:192. doi: 10.3389/fmed.2019.00192. eCollection 2019. Front Med (Lausanne). 2019. PMID: 31555649 Free PMC article. Review.
References
- Askham JM, Moncur P, Markham AF, Morrison EE. Regulation and function of the interaction between the APC tumour suppressor protein and EB1. Oncogene. 2000;19:1950–1958. - PubMed
Publication types
MeSH terms
Substances
LinkOut - more resources
Full Text Sources
Other Literature Sources
Molecular Biology Databases


