Different patterns of electrical activity lead to long-term potentiation by activating different intracellular pathways - PubMed (original) (raw)
Different patterns of electrical activity lead to long-term potentiation by activating different intracellular pathways
Guoqi Zhu et al. J Neurosci. 2015.
Abstract
Deciphering and storing information coded in different firing patterns are important properties of neuronal networks, as they allow organisms to respond and adapt to external and internal events. Here we report that hippocampal CA1 pyramidal neurons respond to brief bursts of high-frequency stimulation (HFS) and θ burst stimulation (TBS) with long-lasting enhanced responses (long-term potentiation [LTP]), albeit by engaging different signaling pathways. TBS induces LTP through calpain-1-mediated suprachiasmatic nucleus circadian oscillatory protein degradation, ERK activation, and actin polymerization, whereas HFS requires adenosine A2 receptors, PKA, and actin polymerization. TBS- but not HFS-induced LTP is impaired in calpain-1 knock-out mice. However, TBS-induced LTP and learning impairment in knock-out mice are restored by activating the HFS pathway. Thus, different patterns of rhythmic activities trigger potentiation by activating different pathways, and cross talks between these can be used to restore LTP and learning when elements of the pathways are impaired.
Keywords: ERK; PKA; calpain; hippocampus; learning; long-term potentiation.
Copyright © 2015 the authors 0270-6474/15/350621-13$15.00/0.
Figures
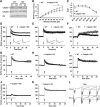
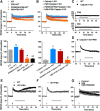
Figure 1.
TBS-, but not HFS-induced LTP, is impaired in hippocampal slices from calpain-1 KO mice. A, Lack of calpain-1, but normal calpain-2, levels in calpain-1 KO mice. B, Input–output response curves for WT and calpain-1 KO mice. Black line indicates significant difference between the two groups (two-tailed Student's t test). C, Paired-pulse facilitation at various time intervals in calpain-1 KO and WT mice. D, TBS (10 bursts, 4 pulses) does not induce LTP in calpain-1 KO mice. E, HFS (1 s, 100 Hz) induces LTP in calpain-1 KO mice. F, Impaired θ frequency stimulation (30 s, 5 Hz) induced LTP in calpain-1 KO mice. G, Stimulation intensity was decreased in slices from WT mice to elicit 20% of the maximal response. Under this condition, LTP was still induced. H, In calpain-1 KO mice, the current was increased to induce 65% of the maximal response. LTP was still impaired. I, A different TBS (TBS′; 10 bursts, 4 pulses, pulse duration 400 μs) induced LTP in calpain-1 KO mice. J, TBS′-induced LTP in calpain-1 KO mice was NMDA receptor-dependent, as it was blocked by AP5 (10 μ
m
, black bar). K, A nonselective calpain inhibitor (calpain inhibitor III, 10 μ
m
, gray bar) did not affect TBS′-LTP in calpain-1 KO mice. In all cases, data are means ± SEM for 6–10 slices from 3–5 mice in each group. Insets, Representative traces from baseline (gray) and 40 min after TBS (black) or HFS. Calibration: 0.5 mV, 10 ms. L, TBS with 400 μs stimulation duration elicited many spikes between bursts.
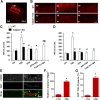
Figure 2.
TBS, but not HFS, triggers calpain-mediated spectrin degradation. A, Representative image with SBP staining after TBS in hippocampal slices from WT mice. B, Baseline, TBS-, and HFS-induced spectrin truncation in slices from WT (top row) and calpain-1 KO mice (bottom row). Scale bar, 50 μm. sp, Stratum pyramidale; sr, stratum radiatum. C, D, Quantification of SBP mean fluorescence intensity around the stimulus electrode in stratum radiatum and stratum pyramidale of CA1. E, Colocalization of SBP and the postsynaptic marker, PSD-95. Scale bar, 5 μm. F, Quantification of SBP punctas after TBS. G, Quantification of SBP-positive PSD-95 punctas, calculated as percentage of PSD-95 punctas (for quantification description, see Material and Methods). In all cases, data are means ± SEM for 6 slices from 3 animals in each group. *p < 0.05, compared with Ctrl in WT (two-way ANOVA followed by Bonferroni test). #p < 0.05, compared with TBS in WT (two-way ANOVA followed by Bonferroni test). @p < 0.05, compared with AP5 + TBS in WT (two-way ANOVA followed by Bonferroni test).
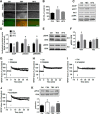
Figure 3.
TBS- and HFS activate different signaling pathways. A, Immunohistochemical staining of p-ERK 10 min after TBS and HFS in WT mice. Scale bar, 50 μm. B, Quantification of p-ERK fluorescence intensity in control, TBS, and HFS. n = 4 slices from 3 animals in each group. *p < 0.05, compared with Ctrl (one-way ANOVA followed by Bonferroni test). C, Western blots for SCOP, p-AKT and AKT, and p-ERK and ERK 10 min following TBS or HFS in CA1 mini-slices. D, Quantitative data for SCOP, p-Akt/Akt, and p-ERK/ERK. Data are means ± SEM of 3 experiments. *p < 0.05, compared with Ctrl (one-way ANOVA followed by Bonferroni test). E, TBS, but not HFS, induced ERK activation in WT, but not in calpain-1 KO, mice. F, Quantification data for p-ERK levels. n = 4. *p < 0.05, compared with Ctrl (one-way ANOVA followed by Bonferroni test). G, H, Effect of the MEK inhibitor, PD98059 (50 μ
m
, starting 20 min before TBS, black line) on TBS-LTP (G) and HFS-LTP (H) in WT mice. I, J, Effect of the adenosine A2 receptor blocker, SCH58261 (50 n
m
) (starting 20 min before TBS, black line) on TBS-LTP (I) and HFS-LTP (J). K, Effect of FSK, TBS, and HFS on PKA activation/phosphorylation. Top, Representative Western blot. Bottom, Quantitative analysis of Western blots. Data are means ± SEM for 3 slices from 3 animals in each group. *p < 0.05, compared with LFS control (one-way ANOVA followed by Bonferroni test). PD98059 or SCH58261 was applied 30 min before stimulation.
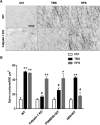
Figure 4.
Effect of PKA activation/inhibition on TBS- or HFS-induced calpain-mediated spectrin truncation. A, Representative images of SBP staining after TBS or HFS delivered in the absence or presence of the PKA activator, FSK (10 μ
m
), or the PKA inhibitor, H89 (10 μ
m
). SCH58261 was applied 30 min before stimulation. FSK was applied 10 min before stimulation for 20 min. Blocking PKA with H89 enabled HFS-induced spectrin truncation but did not affect TBS-induced spectrin truncation, whereas activating PKA with FSK did not affect the lack of HFS-induced calpain activation but blocked TBS-induced spectrin truncation in WT mice. Scale bar, 80 μm. B, Quantification of SBP staining in CA1 region around the stimulating electrode. Data are means ± SEM of 3–5 experiments. *p < 0.05, compared with TBS (one-way ANOVA followed by Bonferroni test). #p < 0.05, compared with HFS (one-way ANOVA followed by Bonferroni test).
Figure 5.
Effect of TBS and HFS on actin polymerization. A, Representative images of phalloidin staining in slices from WT and calpain-1 KO mice after 10 min baseline stimulation (Ctrl), TBS, and HFS. Scale bar, 15 μm. B, Quantitative analysis of F-actin staining. Data are means ± SEM of three experiments. **p < 0.01, compared with Ctl (two-way ANOVA followed by Bonferroni test). *p < 0.05, compared with Ctrl (two-way ANOVA followed by Bonferroni test). #p < 0.05, compared with corresponding stimulation conditions in WT mice (two-way ANOVA followed by Bonferroni test). n = 5 for each experimental group.
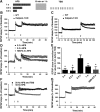
Figure 6.
Effect of FSK on TBS-induced LTP in WT and calpain-1 KO mice. A, Effects of FSK (10 μ
m
), PD98059 (10 μ
m
), and H89 (10 μ
m
) on TBS-induced LTP in hippocampal slices from WT mice. Horizontal line indicates FSK application. PD98059 and H89 were applied at least 30 min before TBS (black arrow). LTP magnitude measured 40 min after TBS. Data are percentage of the fEPSP slope normalized to the average value during the 10 min baseline period and expressed as means ± SEM of 5 experiments. B, Effects of FSK (10 μ
m
), PD98059 (10 μ
m
), and H89 (10 μ
m
) on TBS-induced LTP in hippocampal slices from calpain-1 KO mice. Drugs were applied together during the period indicated by the horizontal line. TBS (black arrow) was delivered at t = 0. LTP magnitude 40 min after TBS. Data are percentage of the fEPSP slope normalized to the average value during the 10 min baseline period and expressed as means ± SEM of 5 experiments. *p < 0.05, compared with the groups without drug application (two-way ANOVA followed by Bonferroni test). #p < 0.05, compared with FSK groups (two-way ANOVA followed by Bonferroni test). C, Effect of 10 μ
m
FSK (20 min) and 10 μ
m
H89 (30 min) on baseline synaptic transmission in slices from both WT and calpain-1 KO mice. D, E, Effects of postapplication of FSK (10 μ
m
, 20 min, black line) on TBS-LTP in calpain-1 KO (D) and WT (E) mice. F, Effect of postapplication of FSK (10 μ
m
, 20 min) on HFS-LTP in WT mice. G, Effect of preapplication of H89 (10 μ
m
) on HFS-induced LTP in the absence or presence of PD98059 (10 μ
m
). PD98059 and H89 were applied 30 min before stimulation. Black arrow indicates TBS. Gray arrow indicates HFS.
Figure 7.
Effect of HFS/γ stimulation on TBS-LTP in calpain-1 KO mice. A, Schematic illustration of the paradigm used in the experiment. HFS of different durations was applied before TBS. B, Effects of HFS delivered 10 min before TBS on LTP in WT and calpain-1 KO mice. C, Effects of HFS delivered 1 h before TBS on LTP in WT and calpain-1 KO mice. D, Effects of HFS of various durations delivered 10 min before TBS on LTP in calpain-1 KO mice. H89 (10 μ
m
) blocked the effects of 0.5 s HFS. E, LTP magnitudes measured 40 min after TBS and normalized to the values measured 2 min before TBS in calpain-1 KO mice. *p < 0.05, compared with 0.5 s HFS group (two-way ANOVA followed by Bonferroni test). n = 4–8 for each experimental group. F, Effects of a 1 s 50 Hz HFS on TBS-LTP in calpain-1 KO mice. *p < 0.05, compared with 0.5 s HFS group (two-tailed Student's t test). n = 4–7 for each experimental group. Black arrow indicates TBS. Gray arrow indicates HFS. G, Effect of HFS 10 min after TBS in WT mice.
Figure 8.
Effects of pretraining and post-training injections of rolipram on learning in calpain-1 KO and WT mice. A, Effects of pretraining or post-training injection of rolipram (1 mg/kg, i.p.) on novel object recognition learning in WT and calpain-1 KO mice. *p < 0.05, compared with saline in calpain-1 KO mice (two-way ANOVA followed by Bonferroni test). #p < 0.05, compared with saline after in WT mice (two-way ANOVA followed by Bonferroni test). n = 6–8 animals for each experimental group. B, Effects of pretraining injection of rolipram on context fear conditioning 24 h after one footshock pairing in WT and calpain-1 KO mice. Data are means ± SEM of 6–8 animals. **p < 0.01, compared with calpain-1 KO saline before group (two-way ANOVA followed by Bonferroni test). *p < 0.05, compared with calpain-1 KO saline before group (two-way ANOVA followed by Bonferroni test). C, Effects of pretraining injection of rolipram on tone fear conditioning 24 h after one footshock pairing in WT and calpain-1 KO mice. D, Context and tone fear conditioning are not affected in calpain-1 KO mice 24 h after training with 3 footshock pairings. Data are means ± SEM of 4 animals in each group.
Similar articles
- A calpain-2 selective inhibitor enhances learning & memory by prolonging ERK activation.
Liu Y, Wang Y, Zhu G, Sun J, Bi X, Baudry M. Liu Y, et al. Neuropharmacology. 2016 Jun;105:471-477. doi: 10.1016/j.neuropharm.2016.02.022. Epub 2016 Feb 18. Neuropharmacology. 2016. PMID: 26907807 Free PMC article. - Estradiol rapidly modulates synaptic plasticity of hippocampal neurons: Involvement of kinase networks.
Hasegawa Y, Hojo Y, Kojima H, Ikeda M, Hotta K, Sato R, Ooishi Y, Yoshiya M, Chung BC, Yamazaki T, Kawato S. Hasegawa Y, et al. Brain Res. 2015 Sep 24;1621:147-61. doi: 10.1016/j.brainres.2014.12.056. Epub 2015 Jan 13. Brain Res. 2015. PMID: 25595055 - Brief theta-burst stimulation induces a transcription-dependent late phase of LTP requiring cAMP in area CA1 of the mouse hippocampus.
Nguyen PV, Kandel ER. Nguyen PV, et al. Learn Mem. 1997 Jul-Aug;4(2):230-43. doi: 10.1101/lm.4.2.230. Learn Mem. 1997. PMID: 10456066 - Multiple cellular cascades participate in long-term potentiation and in hippocampus-dependent learning.
Baudry M, Zhu G, Liu Y, Wang Y, Briz V, Bi X. Baudry M, et al. Brain Res. 2015 Sep 24;1621:73-81. doi: 10.1016/j.brainres.2014.11.033. Epub 2014 Dec 4. Brain Res. 2015. PMID: 25482663 Free PMC article. Review. - Impaired cerebellar plasticity and eye-blink conditioning in calpain-1 knock-out mice.
Heysieattalab S, Lee KH, Liu Y, Wang Y, Foy MR, Bi X, Baudry M. Heysieattalab S, et al. Neurobiol Learn Mem. 2020 Apr;170:106995. doi: 10.1016/j.nlm.2019.02.005. Epub 2019 Feb 5. Neurobiol Learn Mem. 2020. PMID: 30735788 Review.
Cited by
- PKA and Ube3a regulate SK2 channel trafficking to promote synaptic plasticity in hippocampus: Implications for Angelman Syndrome.
Sun J, Liu Y, Zhu G, Cato C, Hao X, Qian L, Lin W, Adhikari R, Luo Y, Baudry M, Bi X. Sun J, et al. Sci Rep. 2020 Jun 17;10(1):9824. doi: 10.1038/s41598-020-66790-4. Sci Rep. 2020. PMID: 32555345 Free PMC article. - Balanced actions of protein synthesis and degradation in memory formation.
Park H, Kaang BK. Park H, et al. Learn Mem. 2019 Aug 15;26(9):299-306. doi: 10.1101/lm.048785.118. Print 2019 Sep. Learn Mem. 2019. PMID: 31416903 Free PMC article. Review. - Desumoylating Isopeptidase 2 (DESI2) Inhibits Proliferation and Promotes Apoptosis of Pancreatic Cancer Cells through Regulating PI3K/AKT/mTOR Signaling Pathway.
Ou X, Zhang GT, Xu Z, Chen JS, Xie Y, Liu JK, Liu XP. Ou X, et al. Pathol Oncol Res. 2019 Apr;25(2):635-646. doi: 10.1007/s12253-018-0487-4. Epub 2018 Nov 8. Pathol Oncol Res. 2019. PMID: 30411297 - Metabotropic NMDAR Signaling Contributes to Sex Differences in Synaptic Plasticity and Episodic Memory.
Le AA, Lauterborn JC, Jia Y, Cox CD, Lynch G, Gall CM. Le AA, et al. J Neurosci. 2024 Dec 11;44(50):e0438242024. doi: 10.1523/JNEUROSCI.0438-24.2024. J Neurosci. 2024. PMID: 39424366 Free PMC article. - Calpain-2 as a Treatment Target in Prenatal Stress-induced Epileptic Spasms in Infant Rats.
Kwon HH, Neupane C, Shin J, Gwon DH, Yin Y, Shin N, Shin HJ, Hong J, Park JB, Yi Y, Kim DW, Kang JW. Kwon HH, et al. Exp Neurobiol. 2019 Aug 31;28(4):529-536. doi: 10.5607/en.2019.28.4.529. Exp Neurobiol. 2019. PMID: 31495081 Free PMC article.
References
- Amini M, Ma CL, Farazifard R, Zhu G, Zhang Y, Vanderluit J, Zoltewicz JS, Hage F, Savitt JM, Lagace DC, Slack RS, Beique JC, Baudry M, Greer PA, Bergeron R, Park DS. Conditional disruption of calpain in the CNS alters dendrite morphology, impairs LTP, and promotes neuronal survival following injury. J Neurosci. 2013;33:5773–5784. doi: 10.1523/JNEUROSCI.4247-12.2013. - DOI - PMC - PubMed
- Barad M, Bourtchouladze R, Winder DG, Golan H, Kandel E. Rolipram, a type IV-specific phosphodiesterase inhibitor, facilitates the establishment of long-lasting long-term potentiation and improves memory. Proc Natl Acad Sci U S A. 1998;95:15020–15025. doi: 10.1073/pnas.95.25.15020. - DOI - PMC - PubMed
Publication types
MeSH terms
Substances
Grants and funding
- R15 MH101703/MH/NIMH NIH HHS/United States
- P01NS045260-01/NS/NINDS NIH HHS/United States
- P01 NS045260/NS/NINDS NIH HHS/United States
- R01NS057128/NS/NINDS NIH HHS/United States
- R01 NS057128/NS/NINDS NIH HHS/United States
LinkOut - more resources
Full Text Sources
Molecular Biology Databases
Miscellaneous
