Molecular and genetic properties of tumors associated with local immune cytolytic activity - PubMed (original) (raw)
Molecular and genetic properties of tumors associated with local immune cytolytic activity
Michael S Rooney et al. Cell. 2015.
Abstract
How the genomic landscape of a tumor shapes and is shaped by anti-tumor immunity has not been systematically explored. Using large-scale genomic data sets of solid tissue tumor biopsies, we quantified the cytolytic activity of the local immune infiltrate and identified associated properties across 18 tumor types. The number of predicted MHC Class I-associated neoantigens was correlated with cytolytic activity and was lower than expected in colorectal and other tumors, suggesting immune-mediated elimination. We identified recurrently mutated genes that showed positive association with cytolytic activity, including beta-2-microglobulin (B2M), HLA-A, -B and -C and Caspase 8 (CASP8), highlighting loss of antigen presentation and blockade of extrinsic apoptosis as key strategies of resistance to cytolytic activity. Genetic amplifications were also associated with high cytolytic activity, including immunosuppressive factors such as PDL1/2 and ALOX12B/15B. Our genetic findings thus provide evidence for immunoediting in tumors and uncover mechanisms of tumor-intrinsic resistance to cytolytic activity.
Copyright © 2015 Elsevier Inc. All rights reserved.
Figures
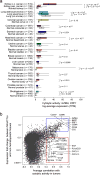
Figure 1. Immune cytolytic activity (CYT) varies across tumor types and is associated with suppressive factors
(A) Cytolytic activity (CYT), defined as the log-average (geometric mean) of GZMA and PRF1 expression in transcripts per million (TPM), is shown for each of 18 TCGA tumor types and normal tissues. Normal tissue samples include TCGA controls and GTEx samples, excluding smokers for lung tissues. Boxes in box plot represent interquartile ranges and vertical lines represent 5th–95th percentile ranges, with a notch for the median. P-values are unadjusted and calculated by Wilcoxon rank-sum test (comparison to relevant normal), and asterisks denote events significant at 10% FDR. (B) The correlation of a gene with CYT across all tumor types is shown (X-axis) relative to its relative expression in CTL/NK cells. Top right, genes expressed in CTL/NK cells that are associated with CYT. Bottom right, non-CTL/NK genes associated with CYT. Average Spearman correlation of expression with CYT was calculated across 18 tumor types. Y-axis: for each gene, median expression in NKs and CTLs divided by median expression in non-hematopoietic cells using CAGE data from Fantom5. See also Data S1 and Table S1.
Figure 2. Viral infection is tumor-specific and associated with higher CYT in a subset of tumor types
(A) Rates of viral infection, as defined by viral RNA-Seq read counts exceeding those observed in GTEx, for tumor types exhibiting at least one case. Isolated cases of several other viruses were also observed. (B) Distribution of CYT in tumor samples with (+) or without (−) viral infection. In tumor types affected by multiple viruses, “negative” samples include only those negative for all viruses. Box plots as in Figure 1. P-values are according to Wilcoxon rank-sum test. See also Data S2 and Table S2.
Figure 3. Count of predicted antigenic mutations per sample is linked with cytolytic activity and selectively depleted in certain tumor types
(A) Local regression curves showing significant relationships between CYT and total mutation count in eight tumor types (p<0.1, Spearman rank correlation), plus melanoma (dotted line). Curves span the 5th to 95th percentile of the mutation count variable. Colors correspond to tumor type and are the same as appear in Figure 1. (B) Analogous to (a), but based on the count of point mutations predicted to yield an antigenic neo-epitope. Potential for antigenicity was defined based on gene expression and potential to bind the corresponding patient’s imputed HLA with high affinity. (C) For each tumor, the count of point mutations predicted to generate neo-epitopes was divided by the total count of non-silent point mutations to yield Bobs/Nobs. This observed ratio was compared to an expected ratio, Bpred/Npred, estimated from the mutational spectra of the silent point mutations in the given sample using an empirical model (Methods). The ratio of the observed and predicted ratios represents the relative deviation of the neo-epitope rate from expectation. P-values reflect Wilcoxon rank-sum tests for deviation from 1. (D) Analogous to Figure 3C, but using neo-epitope prediction based on randomly re-permuted HLA genotype assignments (across patients). Asterisks denote trends significant at 10% FDR for all panels. See also Data S3, Table S3, and Table S4.
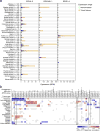
Figure 4. Endogenous retroviruses tied to local immunity
(A) RNA-Seq-derived ERV expression in reads per million (RPM) across 18 TCGA tumor types and 27 non-tumor tissue types (from TCGA and GTEX) for three elements found to be tumor-specific. The expression ranges (minimum value to maximum value) are highlighted in orange (for tumor tissues) or green (for non-tumor tissues). (B) Spearman-rank correlations between CYT and ERV expression. Gray squares indicate non-significant association (unadjusted p>0.05) and blank squares indicate no over-expression of the given ERV in the given tumor type (expression strictly below the normal tissue maximum). Asterisks (*) denote Bonferroni-significant associations (adj. p<0.05). See also Data S4 and Table S5.
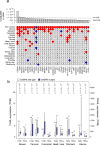
Figure 5. Gene mutations associated with high or low immune cytolytic activity
(A) Only genes showing pan-cancer significance (adj. p<0.1, red for positive, blue for negative and grey for non-significant association) for non-silent mutation association with CYT are shown in top row. Additional rows, clustered by similarity, show independent significant (unadjusted p<0.05) enrichment upon sub-analysis. The black wedges represent the share of samples exhibiting mutation. Bar plot indicates unadjusted pan-cancer p-values for mutational association with CYT, dashed lines indicating thresholds yielding 1% and 10% FDRs. (B) Association between CASP8 mutational status and FASLG (left axis) and TRAIL (right axis) gene expression (TPM) for tumor types demonstrating at least 5 instances of nonsynonymous CASP8 mutation. Light and dark bars correspond to wild type and (nonsynonymous) mutant samples, respectively. Box plots as in Figure 1. P-values are calculated by Wilcoxon rank-sum test. See also Data S5 and Table S6.
Figure 6. Amplifications and deletions are associated with cytolytic activity in tumors
(A) The significance of association between CYT and amplification (orange) and between CYT and deletion (green) for all genic loci. Rightward lines show unadjusted p values for instances in which the lesion was positively associated with CYT, and leftward lines show unadjusted p values for instances in which the lesion was negatively associated with CYT. Dotted lines represent the significance cutoff yielding 1% and 10% FDRs (and also appear in parts B–E). Labels on the right side mark events significant at the 10% FDR, plus B2M. Potential driver genes appear in parentheses. (B) Locus zoom on the 9p24.2-p23 amplification, each bar corresponding to a single gene. Labeled genes include those with driver potential or those on the locus boundary. (C) Locus zoom on the region containing B2M, which was not genome-wide significant. (D) Locus zoom on the 17p13.1 amplification. (E) Significant associations between CNAs and CYT on the pan-cancer and cancer-specific level (as in Figure 5). Pan-cancer significance was defined at a 10% FDR, and significance for individual tumor types was defined at unadjusted p<0.05. Positive association is indicated with red circles, negative with blue circles, and non-association with gray circles. Black wedges indicate the share of samples exhibiting the event (ie. non-zero GISTIC score at the locus). Bar plot indicates unadjusted pan-cancer p-values for CNAs, sorted by significance, with dashed lines indicating thresholds yielding 1% and 10% FDRs. See also Data S6 and Table S7.
Figure 7. Proposed model for evolution of tumor-immune associations
(A) As the tumor develops, we propose that intrinsic tumor factors – such as mutated neoantigens or viruses – induce local immune infiltrates (blue circles) that include cytolytic effector cells (expressing GZMA/PRF1; red circles) that kill tumors (daggers). These factors are expected to be positively correlated with CYT across tumors. (B,C) Under pressure from cytolytic immune cells, subclones with resistance mutations will grow out over time. (B) One subset of these mutations would enable tumors to evade killing, but does not impact the infiltrate, and are positively correlated with CYT (i.e. higher infiltrate samples are enriched for these mutations). (C) Another subset suppresses the immune infiltrate (i.e. lower infiltrate samples are enriched for these mutations), and is negatively correlated with CYT. Notably, p53 mutations and ALOX amplifications were also significantly negatively associated with CD8A, suggesting a reduction in cell numbers and not just activity. See also Data S7 and Table S8.
Comment in
- Cancer genetics: omics analyses of tumour immunity.
Burgess DJ. Burgess DJ. Nat Rev Genet. 2015 Mar;16(3):130-1. doi: 10.1038/nrg3906. Epub 2015 Feb 10. Nat Rev Genet. 2015. PMID: 25668786 No abstract available.
Similar articles
- Immune Cytolytic Activity Stratifies Molecular Subsets of Human Pancreatic Cancer.
Balli D, Rech AJ, Stanger BZ, Vonderheide RH. Balli D, et al. Clin Cancer Res. 2017 Jun 15;23(12):3129-3138. doi: 10.1158/1078-0432.CCR-16-2128. Epub 2016 Dec 22. Clin Cancer Res. 2017. PMID: 28007776 - Presentation of native TROP-2 tumor antigens to human cytotoxic T lymphocytes by engineered antigen-presenting cells.
Mangino G, Grazia Capri M, Barnaba V, Alberti S. Mangino G, et al. Int J Cancer. 2002 Oct 1;101(4):353-9. doi: 10.1002/ijc.10616. Int J Cancer. 2002. PMID: 12209960 - NLRC5/MHC class I transactivator is a target for immune evasion in cancer.
Yoshihama S, Roszik J, Downs I, Meissner TB, Vijayan S, Chapuy B, Sidiq T, Shipp MA, Lizee GA, Kobayashi KS. Yoshihama S, et al. Proc Natl Acad Sci U S A. 2016 May 24;113(21):5999-6004. doi: 10.1073/pnas.1602069113. Epub 2016 May 9. Proc Natl Acad Sci U S A. 2016. PMID: 27162338 Free PMC article. - MHC class I antigens, immune surveillance, and tumor immune escape.
Garcia-Lora A, Algarra I, Garrido F. Garcia-Lora A, et al. J Cell Physiol. 2003 Jun;195(3):346-55. doi: 10.1002/jcp.10290. J Cell Physiol. 2003. PMID: 12704644 Review. - Message in a bottle: role of the 70-kDa heat shock protein family in anti-tumor immunity.
Calderwood SK, Theriault JR, Gong J. Calderwood SK, et al. Eur J Immunol. 2005 Sep;35(9):2518-27. doi: 10.1002/eji.200535002. Eur J Immunol. 2005. PMID: 16144035 Review.
Cited by
- Genomic instability as a driver and suppressor of anti-tumor immunity.
Requesens M, Foijer F, Nijman HW, de Bruyn M. Requesens M, et al. Front Immunol. 2024 Oct 11;15:1462496. doi: 10.3389/fimmu.2024.1462496. eCollection 2024. Front Immunol. 2024. PMID: 39544936 Free PMC article. Review. - Comprehensive multi-omics analysis identifies chromatin regulator-related signatures and TFF1 as a therapeutic target in lung adenocarcinoma through a 429-combination machine learning approach.
Fan J, Chen B, Wu H, Liang X, Shen W, Miao X. Fan J, et al. Front Immunol. 2024 Oct 30;15:1481753. doi: 10.3389/fimmu.2024.1481753. eCollection 2024. Front Immunol. 2024. PMID: 39539551 Free PMC article. - The Roles of H3K9me3 Writers, Readers, and Erasers in Cancer Immunotherapy.
Oleksiewicz U, Kuciak M, Jaworska A, Adamczak D, Bisok A, Mierzejewska J, Sadowska J, Czerwinska P, Mackiewicz AA. Oleksiewicz U, et al. Int J Mol Sci. 2024 Oct 25;25(21):11466. doi: 10.3390/ijms252111466. Int J Mol Sci. 2024. PMID: 39519018 Free PMC article. Review. - Systematic multiomics analysis and in vitro experiments suggest that ITGA5 could serve as a promising therapeutic target for ccRCC.
Che X, Tian X, Wang Z, Zhu S, Ye S, Wang Y, Chen Y, Huang Y, Anwaier A, Yao P, Chen Y, Wu K, Liu Y, Xu W, Zhang H, Ye D. Che X, et al. Cancer Cell Int. 2024 Nov 5;24(1):363. doi: 10.1186/s12935-024-03546-4. Cancer Cell Int. 2024. PMID: 39501306 Free PMC article. - Association of tumour mutation burden with prognosis and its clinical significance in stage III gastric cancer.
Han YL, Chen L, Wang XN, Xu ML, Qin R, Gong FM, Sun P, Liu HY, Teng ZP, Li ZX, Dai GH. Han YL, et al. Bioimpacts. 2024;14(6):30118. doi: 10.34172/bi.2024.30118. Epub 2024 Mar 2. Bioimpacts. 2024. PMID: 39493897 Free PMC article.
References
- Bindea G, Mlecnik B, Tosolini M, Kirilovsky A, Waldner M, Obenauf AC, Angell H, Fredriksen T, Lafontaine L, Berger A, et al. Spatiotemporal dynamics of intratumoral immune cells reveal the immune landscape in human cancer. Immunity. 2013;39:782–795. - PubMed
Publication types
MeSH terms
Substances
LinkOut - more resources
Full Text Sources
Other Literature Sources
Research Materials
Miscellaneous


