Gab1 is essential for membrane translocation, activity and integrity of mTORCs after EGF stimulation in urothelial cell carcinoma - PubMed (original) (raw)
Gab1 is essential for membrane translocation, activity and integrity of mTORCs after EGF stimulation in urothelial cell carcinoma
Chi-Hao Chang et al. Oncotarget. 2015.
Abstract
Urothelial carcinoma is the most common type of malignancy in long-term dialysis patients and kidney transplant recipients in Taiwan. mTORCs (mammalian target of rapamycin complexes) and EGF are important in urothelial carcinoma. To identify the regulation of mTORCs upon EGF stimulation is necessary. mTOR integrates signals from growth factors via mTOR Complex 1 (mTORC1) and mTOR Complex 2 (mTORC2). The mechanism of mTORC1 action has been widely studied; however, the regulation of mTORC2 has not been well studied. Here, we demonstrate that Gab1 is an important upstream regulator in EGF-mediated activation of mTORCs. In our study, we confirm that mTORCs translocate from the cytoplasm to the plasma membrane via the PH domain of Gab1 upon EGF stimulation. Moreover, Gab1 associates with mTORCs. This association stabilizes the integrity of mTORCs and induces mTORC activity. Compared to normal bladder tissue, the expression of Gab1 and activity of mTORCs are elevated in urothelial carcinoma. Collectively, our results suggest that Gab1 is an essential regulator of the EGF-mediated mTORC pathways and may potentially be used as a biomarker for urothelial carcinoma to predict diagnosis and drug response.
Conflict of interest statement
Conflict of interest
The authors declare that they have no competing interests.
Figures
Figure 1. Elevated expression of Gab1 is associated with increased activation of mTORCs in urothelial carcinoma
(A, B) Immunohistochemical staining was performed on paraffin-embedded human urothelial carcinoma tissues and normal urothelial tissues. The sample pictures of immunohistochemical staining of Gab1, mTOR-pS2481 and AKT-pS473 are shown (400X). The lysates from human urothelial carcinoma tissues and normal urothelial tissues were immunoblotted to detect mTOR-pS2448, mTOR-pS2481, p70S6K-pT389, AKT-pS473 and Gab1. N, Normal. T, Tumor. (C, D) Paraffin-embedded tissues from both normal control rats and urothelial carcinoma rats induced by 0.05% N-butyl-N-(4-hydroxybutyl) nitrosamine (BBN) were immunohistochemically stained for Gab1, mTOR-pS2481 and AKT-pS473 (400X). The lysates from normal control rats and rats with urothelial carcinoma were immunoblotted to detect mTOR-pS2448, mTOR-pS2481, p70S6K-pT389, AKT-pS473 and Gab1. N, Normal. T, Tumor.
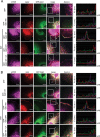
Figure 2. Knockdown of Gab1 reduces plasma membrane translocation of mTORCs after EGF stimulation
(A) T24 cells transfected with Gab1 siRNA were serum-starved and treated with 100 ng/ml EGF (10 min). To detect the localization of mTORC1 in T24 cells, immunofluorescence staining was performed. Staining of mTOR (red), raptor (green) and DAPI (blue) are shown. The right panel shows the relative fluorescence intensity (F.I.) at the lines that were scanned by confocal microscopy. a.u., arbitrary unit. (B) The experiments were performed in a manner similar to that described in A. To detect the location of mTORC2 in T24 cells, immunofluorescence staining was performed. Staining of mTOR (red), rictor (green) and DAPI (blue) are shown. The knockdown efficiency of Gab1 by Gab1 siRNA was shown in Figure S2. m, mock. Scale bar, 10 μm. All experiments, n = 3.
Figure 3. Overexpression of Gab1 promotes plasma membrane of mTORCs after EGF stimulation
(A) E6 cells transfected with GFP-Gab1wt and GFP-Gab1ΔPH were serum-starved and treated with 100 ng/ml EGF (10 min) and 20 μM LY294002 (60 min). To detect the localization of mTORC1 and Gab1 in E6 cells, immunofluorescence staining was performed. Staining of mTOR (purple), raptor (red), Gab1 (green) and DAPI (blue) are shown. The right panel shows the relative fluorescence intensity (F.I.) at the lines that were scanned by confocal microscopy. a.u., arbitrary unit. (B) The experiments were performed in a manner similar to that described in A. To detect the localization of mTORC2 and Gab1 in E6 cells, immunofluorescence staining was performed. Staining of mTOR (purple), rictor (red), Gab1 (green) and DAPI (blue) are shown. m, mock. LY, LY294002. Scale bar, 10 μm. All experiments, n = 3.
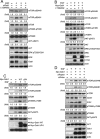
Figure 4. Gab1 is important for the activation of mTORC signaling after EGF stimulation
(A) T24 cells were transfected with Gab1 siRNA, treated with LY294002 (20 μM) for 60 min, stimulated with 100 ng/ml EGF for 10 min and then immunoblotted to detect mTOR-pS2448, mTOR-pS2481, p70S6K-pT389, AKT-pS473, ERK-pT202/Y204 and Gab1. (B) E6 cells transfected with Myc-Gab1wt were serum-starved, and the treatment was performed in a similar manner to that described in A. Immunoblotting was performed to detect mTOR-pS2448, mTOR-pS2481, p70S6K-pT389, AKT-pS473, ERK-pT202/Y204, Gab1 and myc. (C) E6 cells were transfected with Myc-Gab1wt and Myc-Gab1ΔPH, treated with 100 ng/ml EGF for 10 min and then immunoblotted to detect mTOR-pS2448, mTOR-pS2481, p70S6K-pT389, AKT-pS473 and Gab1. (D) T24 cells were transfected with raptor siRNA, rictor siRNA and Myc-Gab1wt, treated with 100 ng/ml EGF for 10 min and then immunoblotted to detect mTOR-pS2448, mTOR-pS2481, raptor, rictor, p70S6K-pT389, AKT-pS473, Gab1 and myc. For all experiments, n = 3.
Figure 5. Gab1 forms complexes with mTORCs
(A) Some T24 cells were serum-starved and then treated with 100 ng/ml EGF for 10 min, and other T24 cells were transfected with Gab1 and raptor siRNA and serum starved. Next, immunoprecipitation of raptor proteins with anti-raptor antibody was performed, and the supernatants from the immunoprecipitations were immunoblotted to detect mTOR, raptor and Gab1. The whole cell lysates (WCLs) were analyzed to detect the same proteins via immunoprecipitation. Quantification of immunoblotting was performed (mean ± SD; p < 0.005). The negative control was shown in Figure S3A. (B) Some T24 cells were serum-starved and then treated with 100 ng/ml EGF for 10 min, and other T24 cells were transfected with Gab1 and rictor siRNA and serum starved. Next, immunoprecipitation of rictor proteins with anti-rictor antibody was performed, and the supernatants from immunoprecipitation were immunoblotted to detect mTOR, rictor and Gab1. WCLs were analyzed to detect the same proteins via immunoprecipitation. Quantification of immunoblotting was performed (mean ± SD; p < 0.001). The negative control was shown in Figure S3B. (C) The E6 cells transfected with Myc-Gab1wt were serum starved, and immunoprecipitation of raptor and rictor proteins with raptor and rictor antibodies was performed. The supernatants from the immunoprecipitation were immunoblotted to detect mTOR, raptor, rictor and Gab1. The WCLs were analyzed to detect the same proteins via immunoprecipitation. The right panel shows quantification of immunoblotting (mean ± SD; p < 0.05). The negative control were shown in Figure S3C and S3D. The All experiments, n = 3.
Figure 6. The model of regulation of mTORCs via Gab1 after EGF stimulation in urothelial carcinoma
The proposed model that depicts Gab1 regulates mTORC activities via associating with mTORCs and plasma membrane translocation after EGF stimulation in urothelial carcinoma.
Similar articles
- Participation of both Gab1 and Gab2 in the activation of the ERK/MAPK pathway by epidermal growth factor.
Meng S, Chen Z, Munoz-Antonia T, Wu J. Meng S, et al. Biochem J. 2005 Oct 1;391(Pt 1):143-51. doi: 10.1042/BJ20050229. Biochem J. 2005. PMID: 15952937 Free PMC article. - High prevalence of mTOR complex activity can be targeted using Torin2 in papillary thyroid carcinoma.
Ahmed M, Hussain AR, Bavi P, Ahmed SO, Al Sobhi SS, Al-Dayel F, Uddin S, Al-Kuraya KS. Ahmed M, et al. Carcinogenesis. 2014 Jul;35(7):1564-72. doi: 10.1093/carcin/bgu051. Epub 2014 Feb 28. Carcinogenesis. 2014. PMID: 24583924 - PtdIns(3,4,5)P3-Dependent Activation of the mTORC2 Kinase Complex.
Liu P, Gan W, Chin YR, Ogura K, Guo J, Zhang J, Wang B, Blenis J, Cantley LC, Toker A, Su B, Wei W. Liu P, et al. Cancer Discov. 2015 Nov;5(11):1194-209. doi: 10.1158/2159-8290.CD-15-0460. Epub 2015 Aug 20. Cancer Discov. 2015. PMID: 26293922 Free PMC article. - Stoichiometry and assembly of mTOR complexes revealed by single-molecule pulldown.
Jain A, Arauz E, Aggarwal V, Ikon N, Chen J, Ha T. Jain A, et al. Proc Natl Acad Sci U S A. 2014 Dec 16;111(50):17833-8. doi: 10.1073/pnas.1419425111. Epub 2014 Dec 1. Proc Natl Acad Sci U S A. 2014. PMID: 25453101 Free PMC article. - Nutrition, Nitrogen Requirements, Exercise and Chemotherapy-Induced Toxicity in Cancer Patients. A puzzle of Contrasting Truths?
Flati V, Corsetti G, Pasini E, Rufo A, Romano C, Dioguardi FS. Flati V, et al. Anticancer Agents Med Chem. 2016;16(1):89-100. doi: 10.2174/1871520615666150824152900. Anticancer Agents Med Chem. 2016. PMID: 26299664 Review.
Cited by
- Comprehensive analysis of differentially expressed profiles of lncRNAs and circRNAs with associated co-expression and ceRNA networks in bladder carcinoma.
Huang M, Zhong Z, Lv M, Shu J, Tian Q, Chen J. Huang M, et al. Oncotarget. 2016 Jul 26;7(30):47186-47200. doi: 10.18632/oncotarget.9706. Oncotarget. 2016. PMID: 27363013 Free PMC article. - DDR2 overexpression in urothelial carcinoma indicates an unfavorable prognosis: a large cohort study.
Tsai MC, Li WM, Huang CN, Ke HL, Li CC, Yeh HC, Chan TC, Liang PI, Yeh BW, Wu WJ, Lim SW, Li CF. Tsai MC, et al. Oncotarget. 2016 Nov 29;7(48):78918-78931. doi: 10.18632/oncotarget.12912. Oncotarget. 2016. PMID: 27793038 Free PMC article. - An integrated genetic analysis of epileptogenic brain malformed lesions.
Fujita A, Kato M, Sugano H, Iimura Y, Suzuki H, Tohyama J, Fukuda M, Ito Y, Baba S, Okanishi T, Enoki H, Fujimoto A, Yamamoto A, Kawamura K, Kato S, Honda R, Ono T, Shiraishi H, Egawa K, Shirai K, Yamamoto S, Hayakawa I, Kawawaki H, Saida K, Tsuchida N, Uchiyama Y, Hamanaka K, Miyatake S, Mizuguchi T, Nakashima M, Saitsu H, Miyake N, Kakita A, Matsumoto N. Fujita A, et al. Acta Neuropathol Commun. 2023 Mar 2;11(1):33. doi: 10.1186/s40478-023-01532-x. Acta Neuropathol Commun. 2023. PMID: 36864519 Free PMC article. - DPP4/CD26 overexpression in urothelial carcinoma confers an independent prognostic impact and correlates with intrinsic biological aggressiveness.
Liang PI, Yeh BW, Li WM, Chan TC, Chang IW, Huang CN, Li CC, Ke HL, Yeh HC, Wu WJ, Li CF. Liang PI, et al. Oncotarget. 2017 Jan 10;8(2):2995-3008. doi: 10.18632/oncotarget.13820. Oncotarget. 2017. PMID: 27936466 Free PMC article. - The Role of GAB1 in Cancer.
Pérez-Baena MJ, Cordero-Pérez FJ, Pérez-Losada J, Holgado-Madruga M. Pérez-Baena MJ, et al. Cancers (Basel). 2023 Aug 20;15(16):4179. doi: 10.3390/cancers15164179. Cancers (Basel). 2023. PMID: 37627207 Free PMC article. Review.
References
- Wu MJ, Lian JD, Yang CR, Cheng CH, Chen CH, Lee WC, Shu KH, Tang MJ. High cumulative incidence of urinary tract transitional cell carcinoma after kidney transplantation in Taiwan. Am J Kidney Dis. 2004;43:1091–1097. - PubMed
- Wu MJ, Chang CH, Chiu YT, Wen MC, Shu KH, Li JR, Chiu KY, Chen YT. Rictor-dependent AKT activation and inhibition of urothelial carcinoma by rapamycin. Urol Oncol. 2012;30:69–77. - PubMed
- Wullschleger S, Loewith R, Hall MN. TOR signaling in growth and metabolism. Cell. 2006;124:471–484. - PubMed
- Loewith R, Jacinto E, Wullschleger S, Lorberg A, Crespo JL, Bonenfant D, Oppliger W, Jenoe P, Hall MN. Two TOR complexes, only one of which is rapamycin sensitive, have distinct roles in cell growth control. Mol Cell. 2002;10:457–468. - PubMed
Publication types
MeSH terms
Substances
LinkOut - more resources
Full Text Sources
Other Literature Sources
Medical
Molecular Biology Databases
Miscellaneous


