Il10 deficiency rebalances innate immunity to mitigate Alzheimer-like pathology - PubMed (original) (raw)
Il10 deficiency rebalances innate immunity to mitigate Alzheimer-like pathology
Marie-Victoire Guillot-Sestier et al. Neuron. 2015.
Abstract
The impact of inflammation suppressor pathways on Alzheimer's disease (AD) evolution remains poorly understood. Human genetic evidence suggests involvement of the cardinal anti-inflammatory cytokine, interleukin-10 (IL10). We crossed the APP/PS1 mouse model of cerebral amyloidosis with a mouse deficient in Il10 (APP/PS1(+)Il10(-/-)). Quantitative in silico 3D modeling revealed activated Aβ phagocytic microglia in APP/PS1(+)Il10(-/-) mice that restricted cerebral amyloidosis. Genome-wide RNA sequencing of APP/PS1(+)Il10(-/-) brains showed selective modulation of innate immune genes that drive neuroinflammation. Il10 deficiency preserved synaptic integrity and mitigated cognitive disturbance in APP/PS1 mice. In vitro knockdown of microglial Il10-Stat3 signaling endorsed Aβ phagocytosis, while exogenous IL-10 had the converse effect. Il10 deficiency also partially overcame inhibition of microglial Aβ uptake by human Apolipoprotein E. Finally, the IL-10 signaling pathway was abnormally elevated in AD patient brains. Our results suggest that "rebalancing" innate immunity by blocking the IL-10 anti-inflammatory response may be therapeutically relevant for AD.
Copyright © 2015 Elsevier Inc. All rights reserved.
Figures
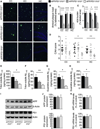
Figure 1. Il10 deficiency reduces cerebral amyloidosis in APP/PS1 mice
(A) Representative micrographs of amyloid plaques labeled with thioflavinS from the cingulate cortex (CC), entorhinal cortex (EC) and hippocampus (HC) of APP/PS1 mice homozygous, heterozygous or completely deficient for Il10. Scale bar denotes 100 µm. (B, C) Quantitation of thioflavinS (B) and 4G8 (C) labeling. (D) Semi-quantitative analysis of cerebral amyloid angiopathy severity (CAA score) from thioflavinS-labeled brain sections. (E–H) ELISA analysis of frontal cortex detergent-soluble (E, F) or guanidine-HCl-extracted (G, H) Aβ1–40 and Aβ1–42 species from mice with the indicated genotypes. For (B–H), data are presented as mean ± SEM for APP/PS1+Il10+/+ (n=10–18), APP/PS1+Il10+/− (n=9–24), and APP/PS1+Il10−/− mice (n=3–10); * p<0.05, ** p<0.01, *** p<0.001. (I) Western blots of human (h) APP or hPS1 levels in frontal cortex homogenates of APP/PS1 mice with the indicated genotypes. Beta-actin is shown as a loading control. (J) Quantitation of hAPP or hPS1 protein levels in frontal cortex homogenates from APP/PS1 mice of the indicated genotypes. Expression levels are normalized to β-actin. Data are represented as mean ± SEM for n=6 samples for each group, with APP/PS1+Il10+/+ signal normalized to 100%; non-significant. (K) Q-PCR analysis of APP and PS1 mRNA levels in frontal cortex from mice with the indicated genotypes. The mRNA levels are normalized to HPRT, and n=6 per group; non-significant. See also Figure S1.
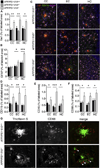
Figure 2. Il10 deficient APP/PS1 mice activate cerebral innate immunity
(A–F) Microgliosis and astrogliosis were quantified in coronal sections labeled with Iba1 (A), GFAP (B), CD11b (D), CD45 (E) or CD68 (F) antibodies in mice with the indicated genotypes. Data are represented as mean ± SEM for APP/PS1+Il10+/+ (n=8–13), APP/PS1+Il10+/− (n=8–16), and APP/PS1+Il10−/− mice (n=3–10); * p<0.05, ** p<0.01, *** p<0.001. (C) Representative micrographs of cingulate cortex (CC), entorhinal cortex (EC) and hippocampus (HC) from APP/PS1 mice homozygous, heterozygous or completely deficient for Il10. Amyloid plaques were labeled using 4G8 antibody, and CD11b+ microglia or GFAP+ astrocytes were found associated with β-amyloid deposits. Scale bar denotes 50 µm. (G) Representative microphotographs are shown of β-amyloid plaque morphology in cortex of APP/PS1+Il10−/− versus APP/PS1+Il10+/+ mice. Amyloid plaques are labeled with thioflavinS while phagocytic microglia are marked by CD68 antibody. White arrows represent CD68+ cells co-localized with amyloid deposits. Scale bar denotes 20 µm. See also Figure S2.
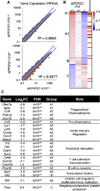
Figure 3. Transcriptome analysis of brains from APP/PS1 mice deficient in Il10
(A) Scatterplot of the average expression per gene (RPKM) of APP/PS1+Il10+/+ (n=5) plotted against APP/PS1+Il10+/− (n=5) or APP/PS1+Il10−/− mice (n=5). The blue line represents a 2-fold change. (B) A heat map of k-means cluster analysis of log2 transformed expression (RPKM) is shown for 117 genes with 2-fold or greater change. Genes that are immune-related (as reported by the KEGG database) are indicated in orange. (C) A table of immune- and inflammation-related genes identified from the heat map with log2 (fold change) of APP/PS1+Il10+/+ versus APP/PS1+Il10−/− mice is shown, and false discovery rate is calculated by the edgeR package in Bioconductor. See also Figure S3.
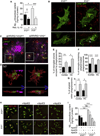
Figure 4. Il10 deficiency increases microglial β-amyloid phagocytosis
(A) ELISA analysis of Aβ1–42 intracellular content in cultured Il10+/+ or Il10−/− mouse primary microglia. Cultures were treated for 2 h with recombinant IL-10 before challenge with human synthetic Aβ1–42 microaggregates for 6 h. Data are presented as mean ± SEM of 4 independent experiments carried out in duplicate; †p=0.06, * p<0.05, *** p<0.001. (B) Representative microphotographs of Lamp1-GFP transfected primary cultures of microglia (Il10+/+ or Il10−/−) challenged with Aβ1–42-cy3 microaggregates. White arrows designate enlarged Lamp1+ phagolysosomes containing Aβ1–42-cy3 in Il10−/− microglia. (C) Representative microphotographs of amyloid deposits in cortex of APP/PS1+Il10−/− versus APP/PS1+Il10+/+ mice. Amyloid deposits are labeled with 4G8, and microglia, with Iba1 and Lamp1. (D) Three-dimensional reconstruction from confocal image stacks showing 4G8+ Aβ encapsulated within Lamp1+ structures in Iba1+ microglia present in brains of APP/PS1+Il10−/− versus APP/PS1+Il10+/+ mice. Blue arrows indicate rotation of insets in the Z-plane to show presence of Aβ within phagolysosomes. (E–G) Quantitation of microglial volume occupied by Lamp1+ phagolysosomes (E), percent of Iba1+ microglia containing amyloid-loaded phagolysosomes (F) or 4G8+ amyloid encapsulated in phagolysosomes (G) in the entorhinal cortex and hippocampus (HC) of mice with the indicated genotypes. Data are represented as mean ± SEM for APP/PS1+Il10+/+ (n=4) or APP/PS1+Il10−/− (n=5) mice; * p<0.05, ** p<0.01. (H) Representative microphotographs of Iba1+ primary cultures of microglia (Il10+/+ or Il10−/−) challenged with Aβ1–42-cy3 microaggregates preincubated with human recombinant ApoE2, ApoE3 or ApoE4. (I) ELISA analysis of Aβ1–42 intracellular content in cultured mouse primary microglia (Il10+/+ or Il10−/−). Cells were treated for 6 h with human synthetic Aβ1–42 pre-aggregated in presence of recombinant ApoE2, ApoE3 or ApoE4. Data are presented as mean ± SEM of 2 independent experiments carried out in duplicate; ** p<0.01, *** p<0.001. See also Figure S4 and Movies S1 and S2.
Figure 5. Preservation of synaptic integrity in Il10 deficient APP/PS1 mice
(A, B) Representative microphotographs of synaptophysin labeling in hippocampus (A) or cortex (B) of mice with the indicated genotypes. Lower panels are 3.5x higher magnification of the upper images. Scale bars denote (A) 87 µm or (B), 25 µm. (C) Quantitation of synaptophysin labeling in hippocampus and cortex is shown as mean ± SEM (n=4 per group); * p< 0.05, ** p<0.01. (D) Western blot of synaptophysin levels in frontal cortex homogenates of mice with the indicated genotypes. Beta-actin served as a loading control.
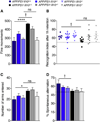
Figure 6. Il10 deficiency partially restores cognitive function in APP/PS1 mice
(A) Spontaneous activity was tested in the open field over a 30 min period. Bars represent fine movements of the mice. (B) Evaluation of episodic memory in the novel object recognition test after 1 h of retention. Plots represent the recognition index. (C, D) Determination of spontaneous alternation in the Y-maze. Bars represent number of arms entered (C) or percent spontaneous alternation (D). Data are represented as mean ± SEM for Il10+/+ (n=5–6), Il10+/− (n=15–16), Il10−/− (n=8–11), APP/PS1+Il10+/+ (n=8–10), APP/PS1+Il10+/− (n=8–9) and APP/PS1+Il10−/− mice (n=7); Compared to APP/PS1 groups: †p≤0.1, *p≤0.05, ****p<0.0001. See also Figure S5.
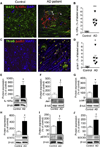
Figure 7. IL-10 signaling is elevated in AD patient brains
(A) Representative microphotographs of IL10Rα (red) and MAP-2 (green) labeling in hippocampal sections of AD patients and age-matched, non-demented control subjects. (B) Quantitation of IL10Rα immunoreactivity in AD (n=6) and control (n=3) brain sections; data are presented as mean ± SEM of labeled area for 3 optical sections per subject; ** p<0.01. (C) Representative microphotographs of thioflavinS+ amyloid plaques (green), MAP-2 (blue) and phospho-Jak1 (pJak1, red) signals in hippocampal sections of AD patients and age-matched, non-demented controls. (D) Quantitation of pJak1 levels in AD (n=6) and control (n=3) brain sections; data are presented as mean ± SEM of labeled area for 3 optical sections per subject; * p<0.05. (E–J) Quantification and representative Western blots of IL10Rα (E), Jak1 (F), pJak1 (G), STAT3 (H), pSTAT3 (I) and SOCS (J) in hippocampal homogenates of AD patients and age-matched, non-demented controls. Expression levels are normalized to β-tubulin. Data are represented as mean ± SEM for controls (n=6) and AD (n=8) patients; †p<0.1, * p<0.05.
Comment in
- Anti-inflammatory signaling in microglia exacerbates Alzheimer's disease-related pathology.
Michaud JP, Rivest S. Michaud JP, et al. Neuron. 2015 Feb 4;85(3):450-2. doi: 10.1016/j.neuron.2015.01.021. Neuron. 2015. PMID: 25654250
Similar articles
- CXCR3 promotes plaque formation and behavioral deficits in an Alzheimer's disease model.
Krauthausen M, Kummer MP, Zimmermann J, Reyes-Irisarri E, Terwel D, Bulic B, Heneka MT, Müller M. Krauthausen M, et al. J Clin Invest. 2015 Jan;125(1):365-78. doi: 10.1172/JCI66771. Epub 2014 Dec 15. J Clin Invest. 2015. PMID: 25500888 Free PMC article. - Cytokine-producing microglia have an altered beta-amyloid load in aged APP/PS1 Tg mice.
Babcock AA, Ilkjær L, Clausen BH, Villadsen B, Dissing-Olesen L, Bendixen AT, Lyck L, Lambertsen KL, Finsen B. Babcock AA, et al. Brain Behav Immun. 2015 Aug;48:86-101. doi: 10.1016/j.bbi.2015.03.006. Epub 2015 Mar 12. Brain Behav Immun. 2015. PMID: 25774009 - The effect of focal brain injury on beta-amyloid plaque deposition, inflammation and synapses in the APP/PS1 mouse model of Alzheimer's disease.
Collins JM, King AE, Woodhouse A, Kirkcaldie MT, Vickers JC. Collins JM, et al. Exp Neurol. 2015 May;267:219-29. doi: 10.1016/j.expneurol.2015.02.034. Epub 2015 Mar 4. Exp Neurol. 2015. PMID: 25747037 - Innate Immunity Fights Alzheimer's Disease.
Guillot-Sestier MV, Doty KR, Town T. Guillot-Sestier MV, et al. Trends Neurosci. 2015 Nov;38(11):674-681. doi: 10.1016/j.tins.2015.08.008. Trends Neurosci. 2015. PMID: 26549882 Free PMC article. Review. - The early involvement of the innate immunity in the pathogenesis of late-onset Alzheimer's disease: neuropathological, epidemiological and genetic evidence.
Eikelenboom P, Veerhuis R, van Exel E, Hoozemans JJ, Rozemuller AJ, van Gool WA. Eikelenboom P, et al. Curr Alzheimer Res. 2011 Mar;8(2):142-50. doi: 10.2174/156720511795256080. Curr Alzheimer Res. 2011. PMID: 21345167 Review.
Cited by
- Targeting neuroinflammation in Alzheimer's disease: from mechanisms to clinical applications.
Si ZZ, Zou CJ, Mei X, Li XF, Luo H, Shen Y, Hu J, Li XX, Wu L, Liu Y. Si ZZ, et al. Neural Regen Res. 2023 Apr;18(4):708-715. doi: 10.4103/1673-5374.353484. Neural Regen Res. 2023. PMID: 36204826 Free PMC article. Review. - Deletion of the type-1 interferon receptor in APPSWE/PS1ΔE9 mice preserves cognitive function and alters glial phenotype.
Minter MR, Moore Z, Zhang M, Brody KM, Jones NC, Shultz SR, Taylor JM, Crack PJ. Minter MR, et al. Acta Neuropathol Commun. 2016 Jul 11;4(1):72. doi: 10.1186/s40478-016-0341-4. Acta Neuropathol Commun. 2016. PMID: 27400725 Free PMC article. - Aging-associated deficit in CCR7 is linked to worsened glymphatic function, cognition, neuroinflammation, and β-amyloid pathology.
Da Mesquita S, Herz J, Wall M, Dykstra T, de Lima KA, Norris GT, Dabhi N, Kennedy T, Baker W, Kipnis J. Da Mesquita S, et al. Sci Adv. 2021 May 21;7(21):eabe4601. doi: 10.1126/sciadv.abe4601. Print 2021 May. Sci Adv. 2021. PMID: 34020948 Free PMC article. - Association of preoperative to postoperative change in cerebrospinal fluid fibrinogen with postoperative delirium.
Payne T, Taylor J, Kunkel D, Konieczka K, Ingram F, Blennow K, Zetterberg H, Pearce RA, Meyer-Franke A, Terrando N, Akassoglou K, Sanders RD, Lennertz RC. Payne T, et al. BJA Open. 2024 Oct 5;12:100349. doi: 10.1016/j.bjao.2024.100349. eCollection 2024 Dec. BJA Open. 2024. PMID: 39429436 Free PMC article. - TREM2 dependent and independent functions of microglia in Alzheimer's disease.
Hou J, Chen Y, Grajales-Reyes G, Colonna M. Hou J, et al. Mol Neurodegener. 2022 Dec 23;17(1):84. doi: 10.1186/s13024-022-00588-y. Mol Neurodegener. 2022. PMID: 36564824 Free PMC article. Review.
References
- Ahmed Z, Shaw G, Sharma VP, Yang C, McGowan E, Dickson DW. Actin-binding proteins coronin-1a and IBA-1 are effective microglial markers for immunohistochemistry. J Histochem Cytochem. 2007;55:687–700. - PubMed
- Angelopoulos P, Agouridaki H, Vaiopoulos H, Siskou E, Doutsou K, Costa V, Baloyiannis SI. Cytokines in Alzheimer’s disease and vascular dementia. Int J Neurosci. 2008;118:1659–1672. - PubMed
- Apelt J, Schliebs R. Beta-amyloid-induced glial expression of both pro-and anti-inflammatory cytokines in cerebral cortex of aged transgenic Tg2576 mice with Alzheimer plaque pathology. Brain Res. 2001;894:21–30. - PubMed
- Arosio B, Trabattoni D, Galimberti L, Bucciarelli P, Fasano F, Calabresi C, Cazzullo CL, Vergani C, Annoni G, Clerici M. Interleukin-10 and interleukin-6 gene polymorphisms as risk factors for Alzheimer’s disease. Neurobiol Aging. 2004;25:1009–1015. - PubMed
Publication types
MeSH terms
Substances
Grants and funding
- 1R01NS076794-01/NS/NINDS NIH HHS/United States
- 3R00AG029726-04S1/AG/NIA NIH HHS/United States
- R01 NS076794/NS/NINDS NIH HHS/United States
- R00 AG029726/AG/NIA NIH HHS/United States
- 1F31NS083339-01A1/NS/NINDS NIH HHS/United States
- 5R00AG029726-04/AG/NIA NIH HHS/United States
LinkOut - more resources
Full Text Sources
Other Literature Sources
Medical
Molecular Biology Databases
Miscellaneous
