Transcription-coupled recruitment of human CHD1 and CHD2 influences chromatin accessibility and histone H3 and H3.3 occupancy at active chromatin regions - PubMed (original) (raw)
Transcription-coupled recruitment of human CHD1 and CHD2 influences chromatin accessibility and histone H3 and H3.3 occupancy at active chromatin regions
Lee Siggens et al. Epigenetics Chromatin. 2015.
Abstract
Background: CHD1 and CHD2 chromatin remodeling enzymes play important roles in development, cancer and differentiation. At a molecular level, the mechanisms are not fully understood but include transcriptional regulation, nucleosome organization and turnover.
Results: Here we show human CHD1 and CHD2 enzymes co-occupy active chromatin regions associated with transcription start sites (TSS), enhancer like regions and active tRNA genes. We demonstrate that their recruitment is transcription-coupled. CHD1 and CHD2 show distinct binding profiles across active TSS regions. Depletion of CHD1 influences chromatin accessibility at TSS and enhancer-like chromatin regions. CHD2 depletion causes increased histone H3 and reduced histone variant H3.3 occupancy.
Conclusions: We conclude that transcription-coupled recruitment of CHD1 and CHD2 occurs at transcribed gene TSSs and at intragenic and intergenic enhancer-like sites. The recruitment of CHD1 and CHD2 regulates the architecture of active chromatin regions through chromatin accessibility and nucleosome disassembly.
Keywords: CHD1; CHD2; DNase; ENCODE; H3; H3.3; chromatin remodeling.
Figures
Figure 1
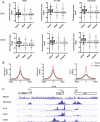
CHD1 and CHD2 are recruited to active but not weak or inactive promoters in association with Pol II. (A) CHD1 and CHD2 occupancy is strongest in the active promoter chromatin state in K562 H1 embryonic stem cell (ESC) and GM12878 cells. CHD1 and CHD2 chromatin immunoprecipitation high throughput sequencing (ChIP-seq) data were normalized to input. Box plots illustrate the median and 25th to 75th percentile with whisker length determined by the Tukey method. In all cell types examined for both CHD1 and CHD2, enrichment at active promoters is statistically higher than at weak and inactive promoters (Kruskall-Wallis test with Dunn’s post test correction, k = 3, P <0.0001) (B) H3K4me2 and H3K4me3 are present at both active and weak promoters, while Pol II enrichment distinguishes the active and weak promoter chromatin state. (C) Examples of the transcription start site (TSS) of genes marked by H3K4me2/3 with differential Pol II, CHD1 and CHD2 binding. The GAL1K1 promoter - TSS1 is marked by H3K4me2/3 but is not bound by Pol II, CHD1 or CHD2, while the H3F3B promoter, TSS2, is strongly bound by Pol II along with CHD1 and CHD2. TSS3 of the UNK gene promoter displays H3K4me2/3 enrichment on a similar scale to the H3F3B gene but has weaker Pol II, CHD1 and CHD2 binding.
Figure 2
Recruitment of CHD1 and CHD2 at CpG island (CGI) promoters correlates with RNA polymerase II (Pol II) occupancy independently of micrococcal nuclease (MNase) sensitivity. Genes with CGI overlapping the transcription start sites (TSS) were organized into quintiles of ascending Pol II occupancy in K562 cells. The average MNase-seq signal, CHD1 and CHD2 occupancy was then plotted across the region from -2500 to +2500 bases from the annotated TSS. Light gray lines represent the bottom quintile, medium gray the second lowest quintile, dark gray the third quintile, black the fourth and red the fifth quintile of Pol II occupancy.
Figure 3
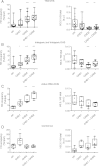
**CHD1 and CHD2 are enriched at an enhancer-like chromatin state with RNA polymerase II (Pol II). (A)**The occupancy of CHD1 and CHD2 occurs primarily at enhancer-like chromatin state 4, which also showed the strongest binding by Pol II (Kruskall-Wallis test with Dunn’s post test correction, k = 3, P <0.0001, comparing enhancer state 4 to all other enhancer-like chromatin states). (B) In contrast H3K4 methylation was observed to different extents at all enhancer-like chromatin states.
Figure 4
CHD1 and CHD2 co-occupy active promoters but show different binding profiles across the transcription start site (TSS). (A) Statistically significant high confidence peaks from CHD1 and CHD2 chromatin immunoprecipitation sequencing (ChIP-seq) data were intersected with chromatin state annotations from K562 cells using model-based analysis for ChIP-seq (MACS) with a stringent cut-off p value of 1 x 10-15. The majority of CHD1 (94%) and CHD2 (78%) binding sites fall within an active promoter or enhancer chromatin state or both as defined by Ernst et al. (B) The majority of CHD1 and CHD2 bound sites are overlapping; 60% of the 7,736 CHD2 binding sites overlap with at least one of 9,827 CHD1 peaks. (C) At highly expressed genes defined in the top 20% expression quintile, CHD1 binding profile follows the enrichment of H3k4me2/3-marked nucleosomes. In contrast, CHD2 binds strongest across the micrococcal nuclease (MNase) sensitive nucleosome depleted region (NDR) at the TSS.
Figure 5
Prolonged RNA polymerase II (Pol II) elongation inhibition leads to an accumulation of Pol II, a reduction in nucleosome occupancy and recruitment of CHD1 and CHD2. (A) Chromatin immunoprecipitation sequencing (ChIP-seq) data in asynchronous cultures reflect the complex dynamics associated with cells at different stages of transcription such as the inactive off state, the initiation stage when the Pol II machinery assembles and the elongation phase following promoter escape. Elongation inhibitor 5,6-dichloro-1-β-D-ribofuranosyl-1H-benzimidazole (DRB) synchronizes transcription in cells by preventing elongation and promoter escape. (B) Prolonged DRB inhibition results in Pol II accumulation and H3 depletion at the transcription start site (TSS) of an expressed gene (NPM1) but not inactive gene (PRSS1). Pol II accumulation associates with increased CHD1 and CHD2 recruitment (significant differences between means of control and DRB tested with the students t-test, ***P <0.001).
Figure 6
CHD1 regulates chromatin accessibility at transcription start site (TSS)-associated, intergenic, intragenic and active tRNA DNase hypersensitivity sites (DHS). (A-B) Knockdown of CHD1 reduces the accessibility of TSS-associated, intragenic and intergenic DHS sites in K562 cells. (A) Data showing the accessibility of selected loci representing non-CGI TSS DHS sites (C1ORF159 and HGB1) CGI TSS sites (PIN1 and H3F3B), intragenic DHS sites (HGB2 and CD19 intra) and two intergenic loci. Centromeric repeats were used as inaccessible controls. Data represent biological replicates and error bars standard deviation. (B) Mean accessibility values from three biological replicates for each loci tested were plotted as the percentage of accessibility in control siRNA treated cells. Differences compared to control were tested by one-way ANOVA, **P <0.01, ***P <0.001.
Figure 7
CHD1 and CHD2 control H3 and H3.3 occupancy at active regulatory regions. (A) Chromatin immunoprecipitation (ChIP-qPCR) analysis of control CHD1, CHD2 and double knockdown experiments at promoters associated with DNase hypersensitivity sites (DHS) show increased H3 occupancy with CHD1, CHD2 and double knockdowns in K562 cells. The strongest effect on H3 occupancy is observed with CHD2 knockdown. CHD2 knockdown also reduced H3.3 enrichment. (B) At intergenic and intragenic DNase sensitivity sites CHD1 and CHD2 knockdown increase H3 occupancy with the strongest trend observed in CHD2 and double knockdown cells. As for promoter sites, CHD2 knockdown reduced H3.3 enrichment. (C) Active tRNA loci-associated DNase sensitive sites show similar trends for both H3 and H3.3 occupancy. (D) Control loci from nonaccessible chromatin demonstrate the effects of CHD2 knockdown on H3 and H3.3 occupancy are specific to active regions. All data points represent mean values plotted from three biological replicates per loci tested. Differences compared to control were tested by one-way ANOVA, *P <0.05, **P <0.01, ***P <0.001.
Similar articles
- Genome-wide analysis of H3.3 dissociation reveals high nucleosome turnover at distal regulatory regions of embryonic stem cells.
Ha M, Kraushaar DC, Zhao K. Ha M, et al. Epigenetics Chromatin. 2014 Dec 20;7(1):38. doi: 10.1186/1756-8935-7-38. eCollection 2014. Epigenetics Chromatin. 2014. PMID: 25598842 Free PMC article. - CHD1 regulates cell fate determination by activation of differentiation-induced genes.
Baumgart SJ, Najafova Z, Hossan T, Xie W, Nagarajan S, Kari V, Ditzel N, Kassem M, Johnsen SA. Baumgart SJ, et al. Nucleic Acids Res. 2017 Jul 27;45(13):7722-7735. doi: 10.1093/nar/gkx377. Nucleic Acids Res. 2017. PMID: 28475736 Free PMC article. - A key role for Chd1 in histone H3 dynamics at the 3' ends of long genes in yeast.
Radman-Livaja M, Quan TK, Valenzuela L, Armstrong JA, van Welsem T, Kim T, Lee LJ, Buratowski S, van Leeuwen F, Rando OJ, Hartzog GA. Radman-Livaja M, et al. PLoS Genet. 2012;8(7):e1002811. doi: 10.1371/journal.pgen.1002811. Epub 2012 Jul 12. PLoS Genet. 2012. PMID: 22807688 Free PMC article. - Chromatin Remodeling Proteins in Epilepsy: Lessons From _CHD2_-Associated Epilepsy.
Lamar KJ, Carvill GL. Lamar KJ, et al. Front Mol Neurosci. 2018 Jun 15;11:208. doi: 10.3389/fnmol.2018.00208. eCollection 2018. Front Mol Neurosci. 2018. PMID: 29962935 Free PMC article. Review. - H3.3 turnover: a mechanism to poise chromatin for transcription, or a response to open chromatin?
Huang C, Zhu B. Huang C, et al. Bioessays. 2014 Jun;36(6):579-84. doi: 10.1002/bies.201400005. Epub 2014 Apr 3. Bioessays. 2014. PMID: 24700556 Review.
Cited by
- HIRA stabilizes skeletal muscle lineage identity.
Esteves de Lima J, Bou Akar R, Machado L, Li Y, Drayton-Libotte B, Dilworth FJ, Relaix F. Esteves de Lima J, et al. Nat Commun. 2021 Jun 8;12(1):3450. doi: 10.1038/s41467-021-23775-9. Nat Commun. 2021. PMID: 34103504 Free PMC article. - The dynamic broad epigenetic (H3K4me3, H3K27ac) domain as a mark of essential genes.
Beacon TH, Delcuve GP, López C, Nardocci G, Kovalchuk I, van Wijnen AJ, Davie JR. Beacon TH, et al. Clin Epigenetics. 2021 Jul 8;13(1):138. doi: 10.1186/s13148-021-01126-1. Clin Epigenetics. 2021. PMID: 34238359 Free PMC article. Review. - Epigenome Maintenance in Response to DNA Damage.
Dabin J, Fortuny A, Polo SE. Dabin J, et al. Mol Cell. 2016 Jun 2;62(5):712-27. doi: 10.1016/j.molcel.2016.04.006. Mol Cell. 2016. PMID: 27259203 Free PMC article. Review. - A regulatory role for CHD2 in myelopoiesis.
Shahin Varnoosfaderani F, Palau A, Dong W, Persson J, Durand-Dubief M, Svensson JP, Lennartsson A. Shahin Varnoosfaderani F, et al. Epigenetics. 2020 Jun-Jul;15(6-7):702-714. doi: 10.1080/15592294.2019.1710913. Epub 2020 Jan 10. Epigenetics. 2020. PMID: 31900031 Free PMC article. - CHD1 Loss Alters AR Binding at Lineage-Specific Enhancers and Modulates Distinct Transcriptional Programs to Drive Prostate Tumorigenesis.
Augello MA, Liu D, Deonarine LD, Robinson BD, Huang D, Stelloo S, Blattner M, Doane AS, Wong EWP, Chen Y, Rubin MA, Beltran H, Elemento O, Bergman AM, Zwart W, Sboner A, Dephoure N, Barbieri CE. Augello MA, et al. Cancer Cell. 2019 Apr 15;35(4):603-617.e8. doi: 10.1016/j.ccell.2019.03.001. Epub 2019 Mar 28. Cancer Cell. 2019. PMID: 30930119 Free PMC article.
References
LinkOut - more resources
Full Text Sources
Other Literature Sources


