Tracking replication enzymology in vivo by genome-wide mapping of ribonucleotide incorporation - PubMed (original) (raw)
Tracking replication enzymology in vivo by genome-wide mapping of ribonucleotide incorporation
Anders R Clausen et al. Nat Struct Mol Biol. 2015 Mar.
Abstract
Ribonucleotides are frequently incorporated into DNA during replication in eukaryotes. Here we map genome-wide distribution of these ribonucleotides as markers of replication enzymology in budding yeast, using a new 5' DNA end-mapping method, hydrolytic end sequencing (HydEn-seq). HydEn-seq of DNA from ribonucleotide excision repair-deficient strains reveals replicase- and strand-specific patterns of ribonucleotides in the nuclear genome. These patterns support the roles of DNA polymerases α and δ in lagging-strand replication and of DNA polymerase ɛ in leading-strand replication. They identify replication origins, termination zones and variations in ribonucleotide incorporation frequency across the genome that exceed three orders of magnitude. HydEn-seq also reveals strand-specific 5' DNA ends at mitochondrial replication origins, thus suggesting unidirectional replication of a circular genome. Given the conservation of enzymes that incorporate and process ribonucleotides in DNA, HydEn-seq can be used to track replication enzymology in other organisms.
Conflict of interest statement
COMPETING FINANCIAL INTERESTS
The authors declare no competing financial interests. The authors declare no competing financial interests.
Figures
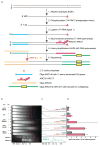
Figure 1. Mapping ribonucleotides by HydEn-Seq
(a) HydEn-Seq protocol. The procedure was performed as described in Methods, using the oligonucleotides listed in Supplementary Table 1. (b) Alkaline agarose gel electrophoresis. The analysis was performed as previously described . Genomic DNA samples from the indicated yeast strains (lanes 1–10) were treated with alkali, separated by 1% alkaline agarose gel electrophoresis, and imaged after staining with SYBR Gold. Migration positions of two DNA size standards are indicated. (c) Densitometry scans of the gel image in (b). The Y-axis is scaled to maximum intensity for each pair of lanes. (d) Mean HydEn-seq end counts per haploid genome (see Nends calculation in Methods; error bars represent ranges of two to four independent measurements).
Figure 2. Strand-specific ribonucleotide mapping of chromosome 10
(a) Top, map of chromosome 10 showing the fraction of end reads mapped to the top strand in bins of 200 base pairs, after background subtraction (see Methods). Origin prediction was complicated at chromosome ends (I) and in other highly repetitive regions (II). Middle, an expanded 200 kbp region of chromosome 10. Excursions (in purple) from the simplest polymerase division of labor (Pol α or δ lagging, Pol ε leading) fall into two classes: unexpected Pol α, δ or ε correspondence (III) and Pol α or δ divergence (IV). Bottom, 100 kbp region of chromosome 10. Inter-origin regions are more (e.g. ARS1012-ARS1014) or less (e.g. ARS1011-ARS1012) symmetrical, depending on fork progression rates and origins firing times. Some origins in the origin database have little effect on ribonucleotide strand bias (e.g. ARS1013), indicating either an incorrect call, minority participation in normally growing cells, unidirectional origin firing, or simply later firing, such that forks proceeding from adjacent origins approach to within current detection thresholds. (b) A stylized chromosome with two replication origins, showing the division of polymerase labor, as predicted from the direction of strand bias transitions at origins (compare with the ARS1012-ARS1014 region above). Roughly three quarters of previously confirmed replication origins (orange diamonds in panel (a); S. cerevisiae OriDB) align with abrupt transitions in strand preference (see Methods for quantitation). This allows algorithmic prediction of origins (black diamonds). ARS1013 was not detected via HydEn-seq. It is indicated (orange diamond) but not labeled.
Figure 3. Genome-wide replication origins located by HydEn-Seq
(a) A 60 kbp segment of chromosome 1 showing the fraction of ends, after background subtraction, that mapped to the top strand from Pol ε data (pol2-M644G rnh201Δ; blue) and the fraction mapped to the bottom strand for Pol α and δ data (pol1-Y869A and pol3-L612G, in red and green, respectively). Grey points are the weighted average of the other three data sets in each bin (see Methods). All curves are trend lines smoothed over 10 bins. (b) As per (a), but for all 16 S. cerevisiae chromosomes. Shown for reference are the locations of the URA3 mutational reporter gene (near ARS306; used in our previous studies of leading and lagging strand replication fidelity , and the rDNA locus in chromosome 12 (not drawn to scale; the highly repetitive sequence precludes read mapping).
Figure 4. Distribution of ribonucleotides near origins in RER-deficient strains
(a) Heat maps for the top and bottom strands of the nuclear genome in five different _rnh201_Δ strains, scaled per million reads and centered across a 4 kbp window of the 394 replication origins reported in the yeast origin database . (b) Meta-analysis of strand-specific ribonucleotides at 214 replication origins analyzed in a previous study , again scaled per million reads, in bins of 50 bp.
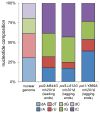
Figure 5. Ribonucleotide base identity
The proportion of each ribonucleotide base present in the nuclear genome of the three _rnh201_Δ strains encoding the indicated variant replicases. The base composition of the genome is shown on the left. Ribonucleotide proportions were calculated from the most highly strand-biased 10% of the genome (i.e. windows near replication origins; examples in Fig. 2a).
Figure 6. Meta-analysis of ribonucleotides at the nucleosome dyad
(a) Meta-analysis of strand-specific ribonucleotide mapping at 37,888 nucleosome dyads for the _rnh201_Δ strain, scaled per million reads and centered within a 400 bp window. Each dot indicates the number of 5′-DNA ends reads at one base pair. The vertical dotted line indicates the dyad. (b) As in (a) but for the _pol2-M644G rnh201_Δ strain. (c) As in (a) but for the _pol1-Y869A rnh201_Δ strain. (d) As in (a) but for the _pol3-L612G rnh201_Δ strain. The solid lines are the smoothed averages for a sliding window. (e) The base composition surrounding the nucleosome dyad.
Figure 7. HydEn-Seq maps of mitochondrial DNA
Mitochondrial genomes for six strains are shown to indicate the base pair (bp) locations and proportions of strand-specific 5′-DNA ends detected by HydEn-Seq (blue for plus strand, red for minus). Previously assigned replication origins are shaded in green, coding sequences in grey, tRNA genes in orange and genes for other non-coding RNAs in pink. Total mitochondrial end counts are shown for each strain with the number of replicate HydEn-Seq libraries for each in parentheses.
Similar articles
- Mapping Ribonucleotides Incorporated into DNA by Hydrolytic End-Sequencing.
Orebaugh CD, Lujan SA, Burkholder AB, Clausen AR, Kunkel TA. Orebaugh CD, et al. Methods Mol Biol. 2018;1672:329-345. doi: 10.1007/978-1-4939-7306-4_23. Methods Mol Biol. 2018. PMID: 29043634 - Analysis of Replicative Polymerase Usage by Ribonucleotide Incorporation.
Keszthelyi A, Miyabe I, Ptasińska K, Daigaku Y, Naiman K, Carr AM. Keszthelyi A, et al. Methods Mol Biol. 2018;1672:239-259. doi: 10.1007/978-1-4939-7306-4_18. Methods Mol Biol. 2018. PMID: 29043629 - Unraveling the complexity of asymmetric DNA replication: Advancements in ribonucleotide mapping techniques and beyond.
Bugallo A, Segurado M. Bugallo A, et al. Genomics. 2024 Sep;116(5):110908. doi: 10.1016/j.ygeno.2024.110908. Epub 2024 Aug 5. Genomics. 2024. PMID: 39106913 Review. - Ribose-seq: global mapping of ribonucleotides embedded in genomic DNA.
Koh KD, Balachander S, Hesselberth JR, Storici F. Koh KD, et al. Nat Methods. 2015 Mar;12(3):251-7, 3 p following 257. doi: 10.1038/nmeth.3259. Epub 2015 Jan 26. Nat Methods. 2015. PMID: 25622106 Free PMC article. - Genome instabilities arising from ribonucleotides in DNA.
Klein HL. Klein HL. DNA Repair (Amst). 2017 Aug;56:26-32. doi: 10.1016/j.dnarep.2017.06.004. Epub 2017 Jun 9. DNA Repair (Amst). 2017. PMID: 28629774 Free PMC article. Review.
Cited by
- Reconstitution of a eukaryotic replisome reveals the mechanism of asymmetric distribution of DNA polymerases.
Yurieva O, O'Donnell M. Yurieva O, et al. Nucleus. 2016 Jul 3;7(4):360-8. doi: 10.1080/19491034.2016.1205774. Nucleus. 2016. PMID: 27416113 Free PMC article. Review. - Strand specificity of ribonucleotide excision repair in Escherichia coli.
Łazowski K, Faraz M, Vaisman A, Ashton NW, Jonczyk P, Fijalkowska IJ, Clausen AR, Woodgate R, Makiela-Dzbenska K. Łazowski K, et al. Nucleic Acids Res. 2023 Feb 28;51(4):1766-1782. doi: 10.1093/nar/gkad038. Nucleic Acids Res. 2023. PMID: 36762476 Free PMC article. - DNA polymerase ε relies on a unique domain for efficient replisome assembly and strand synthesis.
Meng X, Wei L, Devbhandari S, Zhang T, Xiang J, Remus D, Zhao X. Meng X, et al. Nat Commun. 2020 May 15;11(1):2437. doi: 10.1038/s41467-020-16095-x. Nat Commun. 2020. PMID: 32415104 Free PMC article. - Methodologies for detecting environmentally induced DNA damage and repair.
Li W, Sancar A. Li W, et al. Environ Mol Mutagen. 2020 Aug;61(7):664-679. doi: 10.1002/em.22365. Epub 2020 Feb 29. Environ Mol Mutagen. 2020. PMID: 32083352 Free PMC article. Review.
References
Publication types
MeSH terms
Substances
Grants and funding
- R01 GM052319/GM/NIGMS NIH HHS/United States
- Z01 ES065070/ImNIH/Intramural NIH HHS/United States
- ZIA ES065070/ImNIH/Intramural NIH HHS/United States
- 2R01GM052319-16A1/GM/NIGMS NIH HHS/United States
LinkOut - more resources
Full Text Sources
Other Literature Sources
Molecular Biology Databases


