Localization and abundance analysis of human lncRNAs at single-cell and single-molecule resolution - PubMed (original) (raw)
Localization and abundance analysis of human lncRNAs at single-cell and single-molecule resolution
Moran N Cabili et al. Genome Biol. 2015.
Abstract
Background: Long non-coding RNAs (lncRNAs) have been implicated in diverse biological processes. In contrast to extensive genomic annotation of lncRNA transcripts, far fewer have been characterized for subcellular localization and cell-to-cell variability. Addressing this requires systematic, direct visualization of lncRNAs in single cells at single-molecule resolution.
Results: We use single-molecule RNA-FISH to systematically quantify and categorize the subcellular localization patterns of a representative set of 61 lncRNAs in three different cell types. Our survey yields high-resolution quantification and stringent validation of the number and spatial positions of these lncRNA, with an mRNA set for comparison. Using this highly quantitative image-based dataset, we observe a variety of subcellular localization patterns, ranging from bright sub-nuclear foci to almost exclusively cytoplasmic localization. We also find that the low abundance of lncRNAs observed from cell population measurements cannot be explained by high expression in a small subset of 'jackpot' cells. Additionally, nuclear lncRNA foci dissolve during mitosis and become widely dispersed, suggesting these lncRNAs are not mitotic bookmarking factors. Moreover, we see that divergently transcribed lncRNAs do not always correlate with their cognate mRNA, nor do they have a characteristic localization pattern.
Conclusions: Our systematic, high-resolution survey of lncRNA localization reveals aspects of lncRNAs that are similar to mRNAs, such as cell-to-cell variability, but also several distinct properties. These characteristics may correspond to particular functional roles. Our study also provides a quantitative description of lncRNAs at the single-cell level and a universally applicable framework for future study and validation of lncRNAs.
Figures
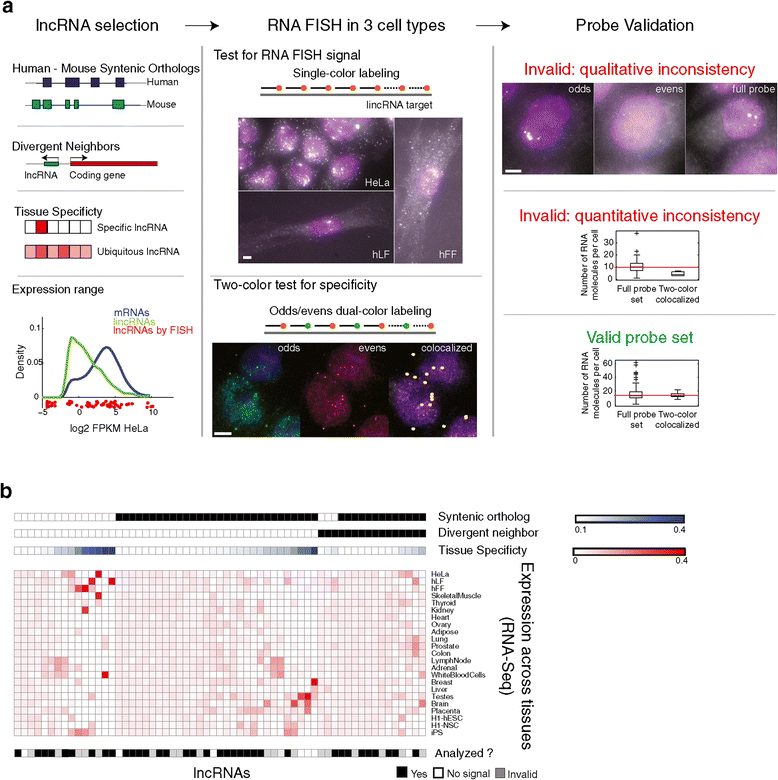
Figure 1
An RNA-FISH survey of lncRNAs. (a) Study workflow. (b) Key features of 61 lincRNAs for which probe sets were successfully designed and were imaged in the study. Shown are for each of 61 lincRNA (column) the following features from top to bottom: whether it has a syntenic ortholog (black: has ortholog) or a divergently transcribed mRNA neighbor (black: has such neighbor), the extent of tissue specificity across 23 tissues (blue color intensity: maximal tissue specificity score as in [9] across the tissues presented in the figure; white to blue color bar), its expression level as measured by RNA-Seq (red intensity: the fractional density across the row of log2(FPKM) as estimated by Cufflinks; white to red color bar) in each of 23 tissues (heatmap rows; Additional file 2), and the extent of analysis performed (black: lncRNAs with valid probe set that were included in the final analysis; white: lncRNAs showing no signal; gray: lncRNAs with an invalid probe based on the two-color co-localization assay).
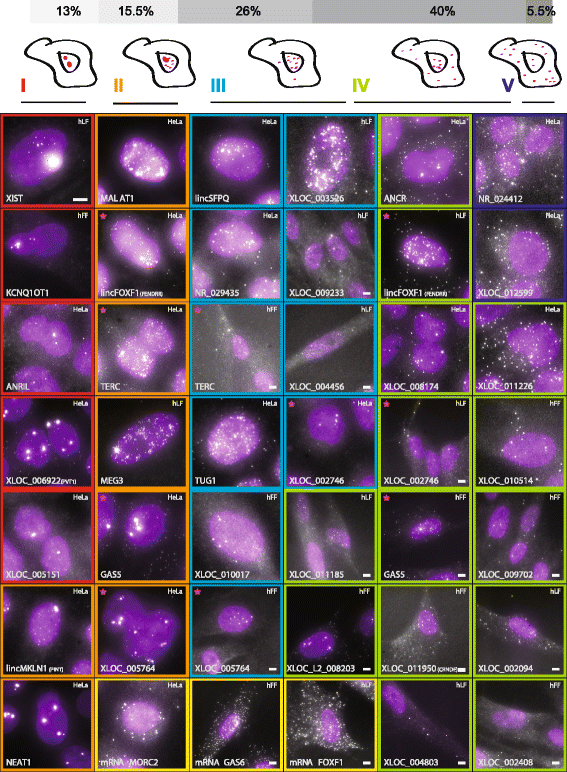
Figure 2
LncRNAs exhibit a variety of cellular localization patterns. Florescence micrographs of representative expressing cells for each of 34 lncRNAs with a validated probe set. LncRNA-cell pairs are classified to cellular localization types I to V as described in the Methods (marked by their border color). Magenta stars mark five lncRNAs that are presented in two different cell types and two different classes (see same row for comparison). Scale bar, 5 μm; when a scale bar is not specified, reference the scale bar within the top left image. Top panel: fraction of each classification for each type across the full set of 70 valid lncRNA-cell pairs imaged.
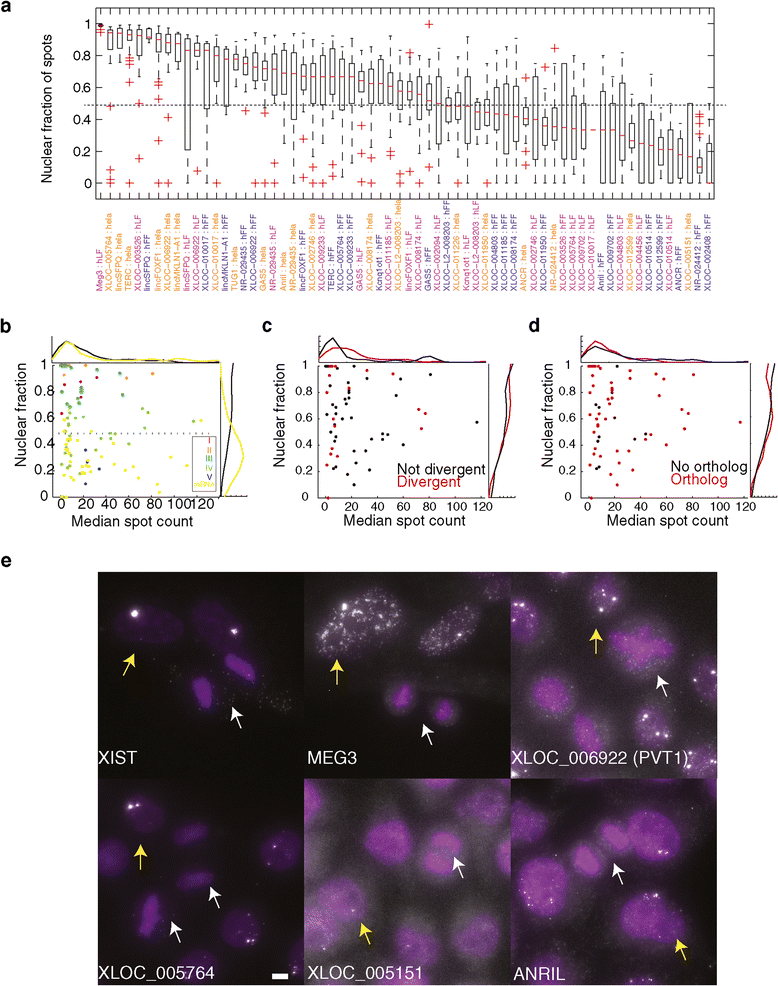
Figure 3
Most lincRNAs are predominantly localized to the nucleus. (a) Boxplots describing the distribution of the fraction of molecules localized to the nucleus (Y axis) for each validated lncRNA-cell pair (X axis, orange: HeLa, blue: hFF, purple: hLF). Red bar: medians. Whiskers are at 1.5* the inner quartile range. (b) Scatter plot of the relationship between expression level (X axis; median number of molecules per cell) and nuclear localization (Y axis, median fraction of nuclear spots across all expressing cells). Each data point is one gene-cell pair and is colored by its classification to the localization classes I to V (Methods) of Figure 2. mRNA sets 1 to 2 (yellow) serve as a reference. Histograms on top and right are the distribution of all lncRNAs- (black) and mRNA- (yellow) cell pairs. (c) Scatter and histograms as in (b) but for lncRNA with (red) or without (black) a divergently transcribed mRNA counterpart. (d) Scatter and histograms as (b) but for lncRNA with (red) or without (black) a syntenic ortholog. (e) Representative image of mitotic cells (marked with white arrows) lacking foci that are seen in interphase cells (marked with yellow arrows). Scale bar, 5 μm.
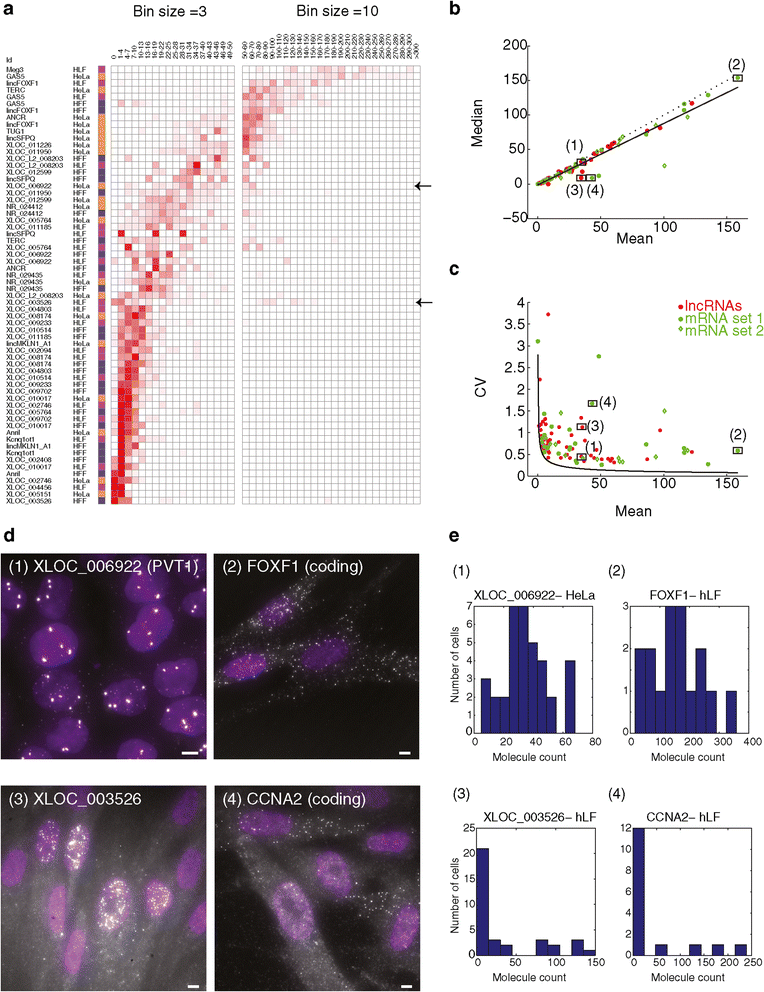
Figure 4
Cell-to-cell variability does not appear to explain the low abundance of the lncRNAs in our survey. (a) Distribution of RNA single molecules counts (bins, columns; Red intensity: fractional density of molecule counts across the population) for the 64 lncRNA-cell pairs in the validated set that are quantitative (rows, Methods). Cell type color coding: orange - HeLa, blue - hFF, purple - hLF. Left bins are sized 3 (0 to 50 molecules ), where right in bins are sized 10 (50 to 300 molecules). A heterogeneously expressed lncRNA (XLOC_003526) and a homogenously expressed lncRNA (XLOC_006922), are pointed by black arrows and referenced in figures b and c. (b, c) The relationship between the mean molecule count (X axis) vs. median molecule count (Y axis, b) or vs. variability in molecule counts (Y axis, coefficient of variation, c) for the 64 lncRNA-cell pairs in the quantitative validated set (red), mRNA set 1 (green circles; Methods) and mRNA set 2 (green diamonds; Methods). A linear regression line in b (black) supports the consistency of the majority of transcript-cell pairs with a unimodal distribution (Y = 0.87X-1.25, Pearson r = 0.96). Dotted line is Y = X. Black curve in (c) is the theoretic Poisson distribution. Four transcripts marked (1 to 4) are analyzed further in d and e. LncRNA pairs with mean >170 (less than 10% of all pairs) are not presented, but show a similar pattern on a log scale. (d) Fluorescence micrographs of single molecule RNA FISH of a homogenously expressed lncRNA (1-XLOC_006922; top left) and mRNA (2-FOXF1; top right) and of a heterogeneously expressed lncRNA (3- XLOC_003526; bottom left) and mRNA (4 - CCNA2; bottom right). XLOC_003526 and CCNA2 are both heterogeneous but do not correlate with each other based on co-staining in two colors. Scale bar, 5 μm. (e) Molecule count distributions for each of the example transcript 1 to 4.
Figure 5
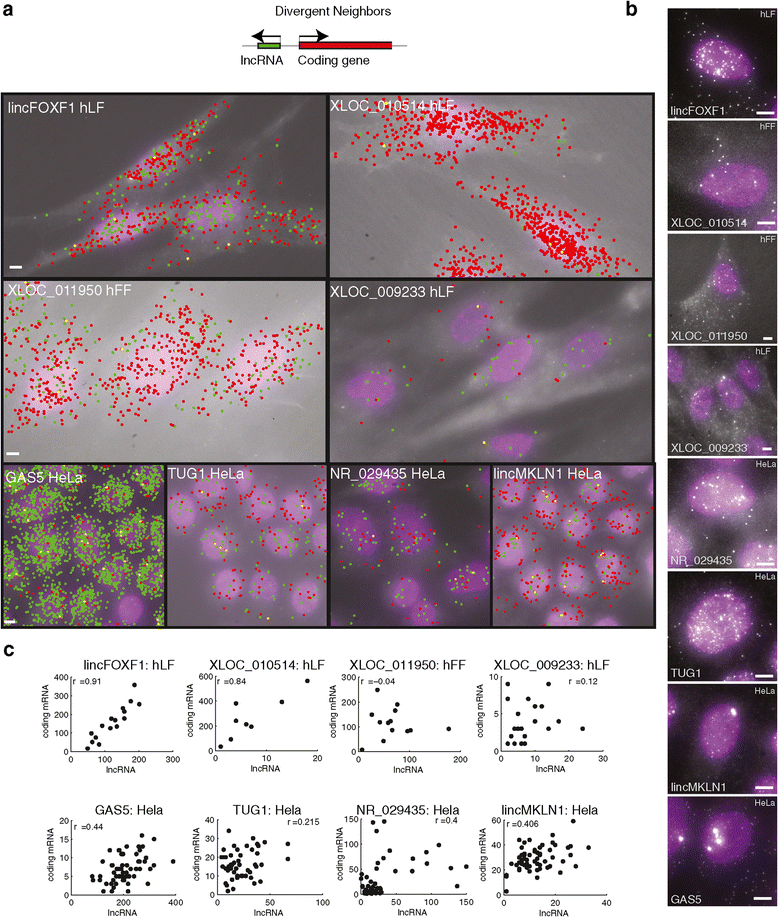
Cellular localization of divergent lincRNAs and their neighbors. (a) Two-color overlay micrograph presenting florescence probes targeting the lincRNA (green) and coding neighbor (red). Co-localized spots are marked yellow. The lincRNA and cell type are marked on the image. Scale bar, 5 μm; marked on the left most image. Top: illustration of the positional genomic orientation of a divergent lincRNA and its coding gene neighbor. (b) Representative fluorescence micrographs as shown in Figure 2 for the lincRNAs in a. Scale bar, 5 μm. (c) Scatter plots of the relationship in each cell between the expression level of the lincRNA (X axis, molecule count) and that of its neighboring coding gene (Y axis). Pearson correlation coefficients (r) after removal of outliers (Additional file 1) are denoted on top. Data in (a-c) are presented for eight of the nine lincRNA-gene neighbor pairs for which a valid probe set exists.
Similar articles
- A novel RNA motif mediates the strict nuclear localization of a long noncoding RNA.
Zhang B, Gunawardane L, Niazi F, Jahanbani F, Chen X, Valadkhan S. Zhang B, et al. Mol Cell Biol. 2014 Jun;34(12):2318-29. doi: 10.1128/MCB.01673-13. Epub 2014 Apr 14. Mol Cell Biol. 2014. PMID: 24732794 Free PMC article. - Nuclear compartmentalization of TERT mRNA and TUG1 lncRNA is driven by intron retention.
Dumbović G, Braunschweig U, Langner HK, Smallegan M, Biayna J, Hass EP, Jastrzebska K, Blencowe B, Cech TR, Caruthers MH, Rinn JL. Dumbović G, et al. Nat Commun. 2021 Jun 3;12(1):3308. doi: 10.1038/s41467-021-23221-w. Nat Commun. 2021. PMID: 34083519 Free PMC article. - Global Positioning System: Understanding Long Noncoding RNAs through Subcellular Localization.
Carlevaro-Fita J, Johnson R. Carlevaro-Fita J, et al. Mol Cell. 2019 Mar 7;73(5):869-883. doi: 10.1016/j.molcel.2019.02.008. Mol Cell. 2019. PMID: 30849394 Review. - Transcriptome analysis identified a novel 3-LncRNA regulatory network of transthyretin attenuating glucose induced hRECs dysfunction in diabetic retinopathy.
Shao J, Zhang Y, Fan G, Xin Y, Yao Y. Shao J, et al. BMC Med Genomics. 2019 Oct 15;12(1):134. doi: 10.1186/s12920-019-0596-2. BMC Med Genomics. 2019. PMID: 31615521 Free PMC article. - Mechanisms of Long Noncoding RNA Nuclear Retention.
Guo CJ, Xu G, Chen LL. Guo CJ, et al. Trends Biochem Sci. 2020 Nov;45(11):947-960. doi: 10.1016/j.tibs.2020.07.001. Epub 2020 Aug 13. Trends Biochem Sci. 2020. PMID: 32800670 Review.
Cited by
- LncRNAs in melanoma phenotypic plasticity: emerging targets for promising therapies.
Beatriz Cristina Biz T, Carolina de Sousa CS, Frank John S, Miriam Galvonas J. Beatriz Cristina Biz T, et al. RNA Biol. 2024 Jan;21(1):81-93. doi: 10.1080/15476286.2024.2421672. Epub 2024 Nov 5. RNA Biol. 2024. PMID: 39498940 Free PMC article. Review. - Mechanisms of tamoxifen resistance: insight from long non-coding RNAs.
Yan Y, Zhang J. Yan Y, et al. Front Oncol. 2024 Oct 8;14:1458588. doi: 10.3389/fonc.2024.1458588. eCollection 2024. Front Oncol. 2024. PMID: 39439957 Free PMC article. Review. - Network-based modelling reveals cell-type enriched patterns of non-coding RNA regulation during human skeletal muscle remodelling.
Mcleod JC, Lim C, Stokes T, Sharif JA, Zeynalli V, Wiens L, D'Souza AC, Colenso-Semple L, McKendry J, Morton RW, Mitchell CJ, Oikawa SY, Wahlestedt C, Paul Chapple J, McGlory C, Timmons JA, Phillips SM. Mcleod JC, et al. bioRxiv [Preprint]. 2024 Oct 9:2024.08.11.606848. doi: 10.1101/2024.08.11.606848. bioRxiv. 2024. PMID: 39416175 Free PMC article. Preprint. - Discovery of prognostic lncRNAs in colorectal cancer using spatial transcriptomics.
Pinkney HR, Ross CR, Hodgson TO, Pattison ST, Diermeier SD. Pinkney HR, et al. NPJ Precis Oncol. 2024 Oct 10;8(1):230. doi: 10.1038/s41698-024-00728-1. NPJ Precis Oncol. 2024. PMID: 39390212 Free PMC article. - An RNA-centric view of transcription and genome organization.
Henninger JE, Young RA. Henninger JE, et al. Mol Cell. 2024 Oct 3;84(19):3627-3643. doi: 10.1016/j.molcel.2024.08.021. Mol Cell. 2024. PMID: 39366351 Review.
References
Publication types
MeSH terms
Substances
Grants and funding
- DP2 OD006670/OD/NIH HHS/United States
- P01 GM099117/GM/NIGMS NIH HHS/United States
- P50 HG006193/HG/NHGRI NIH HHS/United States
- P50 HG006193-01/HG/NHGRI NIH HHS/United States
- Howard Hughes Medical Institute/United States
- DP2 OD008514/OD/NIH HHS/United States
- DP1 OD003958/OD/NIH HHS/United States
LinkOut - more resources
Full Text Sources
Other Literature Sources
