Norepinephrine preferentially modulates memory CD8 T cell function inducing inflammatory cytokine production and reducing proliferation in response to activation - PubMed (original) (raw)
Norepinephrine preferentially modulates memory CD8 T cell function inducing inflammatory cytokine production and reducing proliferation in response to activation
Christina Slota et al. Brain Behav Immun. 2015 May.
Abstract
Background: Norepinephrine (NE) is one of the primary catecholamines of the sympathetic nervous system released during a stress response and plays an important role in modulating immune function. NE binds to the adrenergic receptors on immune cells, including T cells, resulting in either suppressed or enhanced function depending on the type of cell, activation status of the cell, duration of NE exposure and concentration of NE. Here, we aim to analyze the effects of NE on the functionality of naïve (Tn), central memory (Tcm) and effector memory (Tem) CD8 T cells.
Methods: We isolated CD8 T cell subsets from healthy human adults and treated cells in vitro with NE (1×10(-6)M) for 16h; we then stimulated NE treated and untreated CD8 T cell subsets with antibodies for CD3 and CD28 for 24 and 72h. We assessed the level of beta-2 adrenergic receptor (ADRB2) expression in these cells as well as global gene expression changes in NE treated Tcm cells by microarray analysis. Altered expressed genes after NE treatment were identified and further confirmed by RT-qPCR, and by ELISA for protein changes. We further determined whether the observed NE effects on memory CD8 T cells are mediated by ADRB2 using specific adrenergic receptor agonist and antagonists. Finally, we examined the levels of mRNA and protein of the NE-induced genes in healthy adults with high serum levels of NE (>150pg/mL) compared to low levels (<150pg/mL).
Results: We found that memory (Tcm and Tem) CD8 T cells expressed a significantly higher level of ADRB2 compared to naïve cells. Consequently, memory CD8 T cells were significantly more sensitive than naïve cells to NE induced changes in gene expressions in vitro. Global gene expression analysis revealed that NE induced an elevated expression of inflammatory cytokines and chemokines in resting and activated memory CD8 T cells in addition to a reduced expression of growth-related cytokines. The effects of NE on memory CD8 T cells were primarily mediated by ADRB2 as confirmed by the adrenergic receptor agonist and antagonist assays. Finally, individuals with high serum levels of NE had similar elevated gene expressions observed in vitro compared to the low NE group.
Conclusions: Our results demonstrate that NE preferentially modulates the functions of memory CD8 T cells by inducing inflammatory cytokine production and reducing activation-induced memory CD8 T cell expansion.
Keywords: CD8 T cells; Inflammation; Norepinephrine; Stress.
Published by Elsevier Inc.
Conflict of interest statement
Conflict of Interest
The authors declare no conflicts of interest.
Figures
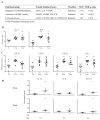
Figure 1. The beta-2 adrenergic receptor is highly expressed in the memory subsets compared to the naïve subset of CD8 T cells
(A) Representative figures of the flow cytometry staining for ADRB2 expression on CD8 T cell subsets. Lymphocytes were gated from the peripheral mononuclear cell (PBMC) sample followed by a CD8+ T cell (APC) gate. CD8 T cell subsets, naïve (CD45RA+CD62L+), central memory (CD45RA−CD62L+) and effector memory (CD45RA−CD62L−) cells were gated for measure of ADRB2 expression. Representative histograms of Tn, Tcm and Tem percentage of ADRB2 expression is presented. Staining for ADRB2 was described in the Methods. (B) ADRB2 expression in individual CD8 T cell subsets. ADRB2 expression is presented as a percentage for each CD8 T cell subset: naïve (Tn), central memory (Tcm) and effector memory (Tem). There was a significant difference in the percentage of ADRB2 expression between Tn and memory (Tcm and Tem) T cells (N=50, p<0.001). (C) Mean fluorescent intensity (MFI) of ADRB2 expression in CD8 T cell subsets. The MFI of each CD8 T cell subset was measured to examine the average expression of ADRB2 on each type of cell. Per subject, memory CD8 T cells expressed significantly more ADRB2 compared to naïve cells (N=50, p<0.001). (D) ADRB2 expression on the mRNA level of Tn, Tcm and Tem subsets in healthy human adults by RT-qPCR. Data is presented as the relative mRNA expression in the LOG10 value (N=6). Figures throughout this manuscript illustrated the results with the mean and SEM. Significance is identified as follows: * p<0.05, ** p<0.01, *** p<0.001
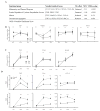
Figure 2. Increased gene expression of inflammatory cytokines in CD8 Tcm cells treated with norepinephrine
(A) Relevant Gene Ontology (GO) groups extracted from GSEA comparison between NE treated and untreated CD8 Tcm cells before activation. These groups had significant FDR q-values (<0.25), and representative genes were chosen from the set of core enriched genes, also derived from GSEA. (B) and (C) Significantly increased inflammatory cytokines and chemokines (mRNA) after NE treatment. RT-qPCR was done based on the microarray results for the selected cytokine genes significantly increased by NE treatment. Results are presented as a ratio (NE/Control) on the Log2 scale for the naïve (Tn), central memory (Tcm) and effector memory (Tem) subsets of CD8 T cells (N=7–11). (D) Protein levels of the selected cytokines and chemokines altered by NE treatment examined via ELISA. Results are presented as the concentration (ng/mL) of the cytokine or chemokine in the controls (untreated) and NE treated central memory (Tcm) and effector memory (Tem) cells at 0 hours (N=6–14).
Figure 3. Activation induces greater expression of inflammatory cytokines and chemokines in norepinephrine treated memory CD8T cells
(A) Relevant Gene Ontology (GO) groups extracted from GSEA comparison between treated and untreated CD8 Tcm cells after activation. These groups had significant FDR q-values (<0.25), and representative genes were chosen from the set of core enriched genes, also derived from GSEA. (B) Significantly increased inflammatory cytokines and chemokines (mRNA) in NE treated CD8 T cells before and activation. Results are presented as a ratio (NE/Control) on a LOG2 scale for 0, 24, and 72 hours in Tcm and Tem cells (N=6–14). (C) Significantly increased inflammatory cytokines and chemokines (mRNA) in NE treated CD8 T cells only after activation. Data is presented as a ratio (NE/Control) on a LOG2 scale for 0, 24, 72 hours in Tcm and Tem cells (N=6–14). (D) Protein level expression of selected cytokines and chemokines at 0, 24, 72 hours after activation in untreated (control) and NE treated Tcm and Tem cells. Data is presented as the concentration (ng/mL) (N=6–12).
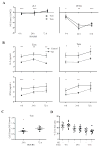
Figure 4. Activation of NE treated memory CD8 T cells led to decreased expression of IL2 and IFNG in the memory subsets resulting in a reduced activation-induced expansion
(A) Decrease in proliferation-related cytokines, IL2 and IFNG, at the mRNA level in memory CD8 T cells. RT-qPCR was used for confirmation of microarray results as well as examining gene expression changes in the naïve (Tn) and effector memory (Tem) subsets. Results are presented as a ratio (NE/Control) in the LOG2 value from baseline to 24 and 72 hours after activation (N=6–14). (B) Protein levels of memory subsets (Tcm and Tem) as measured by ELISA at baseline, 24 and 72 hours after activation in control and NE treated cells. Data is presented as the concentration (ng/mL) (N=7–12). (C) Cell counts of Tcm cells at 24 and 72 hours after activation. Results are presented as the ratio (NE/Control) at 24 and 72 hours after activation in central memory (Tcm) cells (N=15). (D) Viability of Tcm cells was examined by viability dye (7AAD) and apoptosis dye (Annexin V) at 0, 24 and 72 hours after activation. Data is presented as the percentage of live cells which was determined by the gated Tcm cells followed by 7AAD− and Annexin V− gated cells in flow cytometry of the NE treated and untreated cells (N=10).
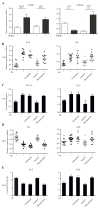
Figure 5. NE action in memory CD8 T cells is mediated by ADRB2
(A) ADRB2+ CD8 Tcm cells respond to NE treatment. We isolated ADRB2+ and ADRB2− CD8 Tcm cells from the blood of human donors. Relative mRNA levels of cytokines in the ADRB2+ cells compared to ADRB2− cells before (IL1A and IL6) and 24 hours after activation (IL2 and TNF) are presented (N=6). (B) The effect of ADRB2 agonist and antagonists on NE-induced cytokine expression (mRNA) before activation. Memory CD8 T cells were isolated and cultured with NE or an ADRB2 agonist (Terbutaline) alone or NE plus an antagonist (either an ADRB antagonist (Nadolol) or an ADRA antagonist (Phentalomine)). Relative expression changes of IL1A and IL6 under these treatments are presented (N=12). (C) The effect of the adrenergic receptor agonist and antagonists on NE-induced cytokine expression (protein) before activation. Similar changes of IL-1A and IL-6 protein concentration levels (ng/ml) in the culture supernatant under the treatments of the agonist (Terbutaline) and antagonists (Nadolol or Phentalomine) are presented (N=8). (D) The effect of the adrenergic receptor agonist and antagonists on NE induced cytokine expression (mRNA) after activation. Relative levels of IL2 and TNF mRNA changes after 24 hours of activation under NE alone, Terbutaline alone, NE plus Nadolol, and NE plus Phentalomine are presented (N=12). (E) The effect of the adrenergic receptor agonist and antagonists on NE induced cytokine expression (protein) after activation. IL-2 and TNF protein concentration levels (ng/ml) in the culture supernatant under the treatment of the agonist (Terbutaline) and antagonists (Nadolol or Phentalomine) are presented (N=8).
Figure 6. Altered inflammatory cytokines in adults with higher levels of norepinephrine
(A) Blood NE levels in study subjects. Blood NE levels are separated into two groups based on the approximate median: low NE levels (<150 pg/mL) (N=18) and high NE levels (>150 pg/mL) (N=14). Data is shown as NE levels measured in the serum (pg/mL) in the two groups (low and high) in which the following analyses were conducted. (B) Gene expression changes between the low NE group and the high NE group examined using RT-qPCR. Data is presented as the LOG10 value (N=9 for high and N=6 for the low blood NE group). (C) Cytokine protein levels (IL-2, IL1-α, TNF) in memory CD8 T cells measured by intracellular staining between the low and high NE groups. Data is presented as the percentage of cells in each group (N=14–17 for high and N=17–22 for the low NE group).
Similar articles
- Sympathetic neural signaling via the β2-adrenergic receptor suppresses T-cell receptor-mediated human and mouse CD8(+) T-cell effector function.
Estrada LD, Ağaç D, Farrar JD. Estrada LD, et al. Eur J Immunol. 2016 Aug;46(8):1948-58. doi: 10.1002/eji.201646395. Epub 2016 Jun 8. Eur J Immunol. 2016. PMID: 27222010 Free PMC article. - Mitochondrial Superoxide Signaling Contributes to Norepinephrine-Mediated T-Lymphocyte Cytokine Profiles.
Case AJ, Roessner CT, Tian J, Zimmerman MC. Case AJ, et al. PLoS One. 2016 Oct 11;11(10):e0164609. doi: 10.1371/journal.pone.0164609. eCollection 2016. PLoS One. 2016. PMID: 27727316 Free PMC article. - β-Adrenergic signaling blocks murine CD8+ T-cell metabolic reprogramming during activation: a mechanism for immunosuppression by adrenergic stress.
Qiao G, Bucsek MJ, Winder NM, Chen M, Giridharan T, Olejniczak SH, Hylander BL, Repasky EA. Qiao G, et al. Cancer Immunol Immunother. 2019 Jan;68(1):11-22. doi: 10.1007/s00262-018-2243-8. Epub 2018 Sep 18. Cancer Immunol Immunother. 2019. PMID: 30229289 Free PMC article. - The immune system in extreme longevity.
Sansoni P, Vescovini R, Fagnoni F, Biasini C, Zanni F, Zanlari L, Telera A, Lucchini G, Passeri G, Monti D, Franceschi C, Passeri M. Sansoni P, et al. Exp Gerontol. 2008 Feb;43(2):61-5. doi: 10.1016/j.exger.2007.06.008. Epub 2007 Jul 4. Exp Gerontol. 2008. PMID: 17870272 Review. - The beta2-adrenergic receptor on T and B lymphocytes: do we understand it yet?
Sanders VM. Sanders VM. Brain Behav Immun. 2012 Feb;26(2):195-200. doi: 10.1016/j.bbi.2011.08.001. Epub 2011 Aug 10. Brain Behav Immun. 2012. PMID: 21855626 Free PMC article. Review.
Cited by
- Beta-2 Adrenergic Receptor Gene Expression in HER2-Positive Early-Stage Breast Cancer Patients: A Post-hoc Analysis of the NCCTG-N9831 (Alliance) Trial.
Caparica R, Ma Y, De Angelis C, Richard F, Desmedt C, Awada A, Piccart M, Perez EA, Moreno-Aspitia A, Badve S, Thompson EA, de Azambuja E. Caparica R, et al. Clin Breast Cancer. 2022 Jun;22(4):308-318. doi: 10.1016/j.clbc.2021.11.012. Epub 2021 Dec 2. Clin Breast Cancer. 2022. PMID: 34980541 Free PMC article. Clinical Trial. - β2-and β3-Adrenergic Receptors Contribute to Cancer-Evoked Pain in a Mouse Model of Osteosarcoma via Modulation of Neural Macrophages.
Bruno G, De Logu F, Souza Monteiro de Araujo D, Subbiani A, Lunardi F, Rettori S, Nassini R, Favre C, Calvani M. Bruno G, et al. Front Pharmacol. 2021 Sep 27;12:697912. doi: 10.3389/fphar.2021.697912. eCollection 2021. Front Pharmacol. 2021. PMID: 34646131 Free PMC article. - Central catecholaminergic blockade with clonidine prevent SARS-CoV-2 complication: A case series.
Hyoju SK, Baral B, Jha PK. Hyoju SK, et al. IDCases. 2021;25:e01219. doi: 10.1016/j.idcr.2021.e01219. Epub 2021 Jul 6. IDCases. 2021. PMID: 34249614 Free PMC article. - Fever and the thermal regulation of immunity: the immune system feels the heat.
Evans SS, Repasky EA, Fisher DT. Evans SS, et al. Nat Rev Immunol. 2015 Jun;15(6):335-49. doi: 10.1038/nri3843. Epub 2015 May 15. Nat Rev Immunol. 2015. PMID: 25976513 Free PMC article. Review. - Synergistic Effects of Weightlessness, Isoproterenol, and Radiation on DNA Damage Response and Cytokine Production in Immune Cells.
Moreno-Villanueva M, Feiveson AH, Krieger S, Kay Brinda A, von Scheven G, Bürkle A, Crucian B, Wu H. Moreno-Villanueva M, et al. Int J Mol Sci. 2018 Nov 21;19(11):3689. doi: 10.3390/ijms19113689. Int J Mol Sci. 2018. PMID: 30469384 Free PMC article.
References
- Anstead MI, Hunt TA, Carlson SL, Burki NK. Variability of peripheral blood lymphocyte beta-2-adrenergic receptor density in humans. Am J Respir Crit Care Med. 1998;157:990–992. - PubMed
- Araki Y, Wang Z, Zang C, Wood WH, III, Schones D, Cui K, Roh TY, Lhotsky B, Wersto RP, Peng W, Becker KG, Zhao K, Weng NP. Genome-wide analysis of histone methylation reveals chromatin state-based regulation of gene transcription and function of memory CD8+ T cells. Immunity. 2009;30:912–925. - PMC - PubMed
- Asao H, Fu XY. Interferon-gamma has dual potentials in inhibiting or promoting cell proliferation. J Biol Chem. 2000;275:867–874. - PubMed
- Bonneau RH, Kiecolt-Glaser JK, Glaser R. Stress-induced modulation of the immune response. Ann N Y Acad Sci. 1990;594:253–269. - PubMed
- Carlson SL, Brooks WH, Roszman TL. Neurotransmitter-lymphocyte interactions: dual receptor modulation of lymphocyte proliferation and cAMP production. J Neuroimmunol. 1989;24:155–162. - PubMed
Publication types
MeSH terms
Substances
LinkOut - more resources
Full Text Sources
Other Literature Sources
Research Materials


