Intraciliary calcium oscillations initiate vertebrate left-right asymmetry - PubMed (original) (raw)
Intraciliary calcium oscillations initiate vertebrate left-right asymmetry
Shiaulou Yuan et al. Curr Biol. 2015.
Abstract
Background: Bilateral symmetry during vertebrate development is broken at the left-right organizer (LRO) by ciliary motility and the resultant directional flow of extracellular fluid. However, how ciliary motility is perceived and transduced into asymmetrical intracellular signaling at the LRO remains controversial. Previous work has indicated that sensory cilia and polycystin-2 (Pkd2), a cation channel, are required for sensing ciliary motility, yet their function and the molecular mechanism linking both to left-right signaling cascades are unknown.
Results: Here we report novel intraciliary calcium oscillations (ICOs) at the LRO that connect ciliary sensation of ciliary motility to downstream left-right signaling. Utilizing cilia-targeted genetically encoded calcium indicators in live zebrafish embryos, we show that ICOs depend on Pkd2 and are left-biased at the LRO in response to ciliary motility. Asymmetric ICOs occur with onset of LRO ciliary motility, thus representing the earliest known LR asymmetric molecular signal. Suppression of ICOs using a cilia-targeted calcium sink reveals that they are essential for LR development.
Conclusions: These findings demonstrate that intraciliary calcium initiates LR development and identify cilia as a functional ion signaling compartment connecting ciliary motility and flow to molecular LR signaling.
Copyright © 2015 Elsevier Ltd. All rights reserved.
Conflict of interest statement
The authors have no conflicting interests
Figures
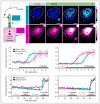
Figure 1. The PKD2 agonist triptolide initiates intraciliary calcium fluxes that precede cytosolic calcium waves
A. Schematic illustrating a ciliated LLC-PK1 cell expressing arl13b-GCaMP5 (cilium, in cyan) and HA-RGECO1 (cytosol, in magenta). Upon triptolide treatment, a robust calcium signal can be seen throughout the cilium, which subsequently propagates into the cytosol. Residual amounts of Arl13b-GCaMP5 in the cytosol allows simultaneous visualization of intraciliary and cytosolic calcium. B. Representative images of a ciliated LLC-PK1 cell co-transfected with arl13b-GCaMP5 and HA-RGECO1 at rest and following treatment with triptolide. Cell body is outlined in yellow, cilium is identified by a cyan bracket. Scalebars = 10 μm. C–D. Graphs depict intensity versus time plot from the mean of five independent cell recordings of intraciliary (cyan) and cytosolic (magenta) calcium fluxes recorded in LLC-PK1 cells in response to triptolide (C) and thapsigargin (D) treatment. Traces represent mean±SEM. E–F. Triptolide triggered calcium fluxes require extracellular calcium. Following triptolide/EGTA treatment, subsequent addition of triptolide/Ca2+ (E) or thapsigargin/EGTA (F) induces sequential rise of intraciliary (cyan) and cytosolic (magenta) calcium or vice versa, respectively. Both traces are representative of three independent experimental repeats with a total of 12 cells. Duration of triptolide and thapsigargin treatment is identified by the black bar, while EGTA washes are identified in orange and Ca2+-free media washes in gray. All quantified intensity is shown as F/F0. See also Figure S1.
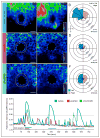
Figure 2. Cilia-targeted GECIs reveal the presence of ICOs in the LRO of zebrafish that are leftward-biased and dependent on Pkd2 and ciliary motility
A–F. Spatial mapping of ICOs in the zebrafish LRO. (A, C, E) Representative fluorescent live images of LRO from vehicle-injected (A), pkd2 morphant (MO) (C) and c21orf59 morphant (E) zebrafish embryos at the 1-somite stage expressing ratiometric GECI (arl13b-GCaMP6/mCherry; ratiometric signal shown and false-colored with rainbow intensometric scale). White arrowheads indicate LRO cilia at resting state, while magenta arrowhead (A) highlights an ICO inducing a cytosolic calcium wave. (B, D, F) Rose diagrams depicting the spatial distribution and mean percentage of cells per embryo displaying ICOs in the total LRO of vehicle (B), pkd2 MO (D) and c21orf59 MO (F) embryos spanning the entire course of LRO development (bud to 16-somite stage). Rings correlate with mean percentage of cells exhibiting calcium oscillations per embryo from bud to 16-somite stage (n = 10 embryos at all stages for pkd2 and vehicle; n = 5 embryos for c21orf59 and vehicle). Control and experimental samples were acquired in a pair-wise manner and analysis was performed on time-lapse recordings spanning bud to 16-somite stage. Control samples for c21orf59 morphants are not shown as the distribution and frequency was equivalent to controls for pkd2 morphants. Left-sided calcium, blue. Right-sided calcium, orange. G. Intraciliary calcium at the LRO exhibits oscillation-like dynamic. Ratiometric intensity over time plot of a single cilium exhibiting ICOs in vehicle (blue), pkd2 MO (magenta) and c21orf59 MO (green) LROs at the 1–4 somite stage. Each plot was aligned post-acquisition to the first detected ICOs (indicated by black arrowhead) and thresholded (indicated by black horizontal line) to facilitate analysis of calcium oscillation dynamics. A: Anterior, P: Posterior, L: Left, R: Right. Scalebars in A,C,E: 10 μm. See also Figures S2 and S3; and Movies 1–3.
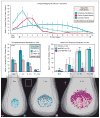
Figure 3. ICOs are spatiotemporally asymmetric and coincide with the initiation of cilia motility in the LRO
A. Temporal mapping of mean percentage of cells exhibiting calcium activity in vehicle LRO (n=29 embryos) from bud-stage to 16-somite-stage. Calcium activity in the LRO was categorized as ICOs (green), cilia-to-cytosolic waves (magenta) and cytosolic waves (cyan). B. Spatiotemporal mapping of mean percentage of cells per embryo exhibiting ICOs on the left or right-side of the LRO in vehicle embryos (n=10 embryos) during bud, 1–4 somite, 5–9 somite and 10–16 somite stages. Left-sided calcium oscillations = blue; right-sided calcium oscillations = orange. C–D. Spatiotemporal mapping of two cilia populations in the zebrafish LRO. (C) Temporal mapping of mean percentage of motile cilia in the vehicle (gray), pkd2 MO (green) and c21orf59 MO (violet) LROs over the course of LRO development. (D) Additive projections of motile (magenta) and immotile (cyan) cilia from vehicle embryos over the course of LRO development. Tailbud area and morphology (gray) of corresponding LROs are also assembled by additive projections. A: Anterior, P: Posterior, L: Left, R: Right. All data shown is mean±SEM. See also Figure S4.
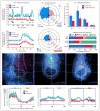
Figure 4. ICOs are required for establishing asymmetric mesendodermal calcium at the LRO
A–D. Suppression of ICOs by arl13b-Pvalb. (A–B) Ratiometric intensity (arl13b-GCaMP6/mCherry) over time plot of a single cilium from a representative embryo (A) or a mean trace representing five embryos (B) exhibiting ICOs in arl13b (cyan) and arl13b-Pvalb (magenta) LROs at the 1–4 somite stage. Each plot was aligned post-acquisition to the first detected ICOs (indicated by black arrowhead) and thresholded to facilitate analysis of calcium oscillation dynamics. (C) Rose diagrams depicting the spatial distribution and mean percentage of cells per embryo displaying ICOs in the total LRO of arl13b (upper) and arl13b-Pvalb (lower) embryos spanning the entire course of LRO development (bud to 16-somite stage). Rings correlate with mean percentage of cells exhibiting calcium oscillations per embryo from bud to 16-somite stage (n = 5 embryos at all stages for arl13b and arl13b-Pvalb). Control and experimental samples were acquired in a pair-wise manner and analysis was performed on time-lapse recordings spanning bud to 16-somite stage. Left-sided calcium, blue. Right-sided calcium, orange. (D) Temporal mapping of mean percentage of cells exhibiting ICOs per embryo in the entire LRO in arl13b (cyan) and arl13b-Pvalb (magenta) embryos across the entire course of LRO development (bud to 16-somite). Data is shown as mean±SEM. E–G. Disruption of mesendodermal calcium by arl13b-Pvalb. (E) Distribution of vehicle, arl13b-Pvalb and pkd2 MO embryos with normal left, or abnormal right, bilateral and absent mesendodermal calcium signal at the LRO. pkd2: **P=0.0033; arl13b-Pvalb: ***P=0.0002. (F) Representative live fluorescent images depicting cytoplasmic calcium in mesendodermal cells of vehicle, arl13b-Pvalb-mCherry and pkd2 MO zebrafish embryos at the 6 to 8-somite stage. Calcium is visualized with HA-GCaMP5 (cyan) and cilia are identified by Arl13b-mCherry (magenta). Scalebars = 30 μm. A: Anterior, P: Posterior, L: Left, R: Right. (G) Ratiometric intensity plot (GCaMP5/mCherry) of cytoplasmic mesendodermal calcium levels corresponding to images in F, relative to position at the LRO level (green) and posterior notochord level (red) across the left-right axis. See also Figures S5, and Movies 4–6.
Figure 5. Intraciliary calcium is essential for vertebrate LR development
A. Representative brightfield and fluorescent images showing heart position in zebrafish embryos at ~30-somite stage highlighted by a GFP transgene driven by the promoter of cardiac myosin light chain 2 (cmlc2). The embryo is seen from the ventral side, showing normal left (blue), and abnormal middle (red) and right (green) heart loops. Graph shows distribution of heart position in response to expression of parvalbumin (PVALB) and mutant parvalbumin (PVALB-CD) targeted to cilia or cytoplasm of wildtype embryos. Data shown is pooled from nine total independent experiments. B. Representative images of whole-mount in situ hybridization for dand5 (charon) expression in the LRO of zebrafish embryos at the 8–10 somite stage. The embryo is seen from the dorsal side, showing normal right-sided (blue) expression and abnormal bilateral (red), left-sided (green) or absent (orange) expression. Graph shows distribution of dand5 in response to expression of PVALB and mutant parvalbumin (PVALB-CD) targeted to cilia or cytoplasm. Data shown is pooled from three independent experiments. Statistical comparison was analyzed by one-way ANOVA with Tukey’s multiple comparison test. *P < 0.05, while ** P < 0.005, ***P < 0.0005, respectively. NS (not significant): P ≥ 0.05. Asterisks above brackets denote comparisons between samples indicated by the bracket, while asterisks above a single sample denote comparisons between that sample and the control. n = Total number of embryos analyzed for each experimental condition (in parentheses). See also Figure S6.
Figure 6. Intraciliary calcium is autonomously required at the LRO for proper LR patterning
A–C. The LR defects induced by arl13b-Pvalb are LRO autonomous. Microinjection into the yolk at 3.0 hpf (A) facilitates transcript delivery into the dorsal forerunner cells (DFCs, LRO precursor cells in zebrafish), while microinjection into the yolk at 4.0 hpf (B) traps transcripts in the yolk-only (control). (C) Graph shows distribution of heart looping defects resulting from DFC-specific expression of arl13b-Pvalb. Data shown pooled from three total independent experiments. Statistical comparison was analyzed by one-way ANOVA with Tukey’s multiple comparison test. *P < 0.05, while ** P < 0.005, ***P < 0.0005, respectively. NS (not significant): P ≥ 0.05. Asterisks above brackets denote comparisons between samples indicated by the bracket, while asterisks above a single sample denote comparisons between that sample and the control. n = Total number of embryos analyzed for each experimental condition (in parentheses).
Comment in
- Left-right asymmetry: cilia and calcium revisited.
Blum M, Vick P. Blum M, et al. Curr Biol. 2015 Mar 2;25(5):R205-7. doi: 10.1016/j.cub.2015.01.031. Curr Biol. 2015. PMID: 25734272
Similar articles
- Left-right asymmetry: cilia and calcium revisited.
Blum M, Vick P. Blum M, et al. Curr Biol. 2015 Mar 2;25(5):R205-7. doi: 10.1016/j.cub.2015.01.031. Curr Biol. 2015. PMID: 25734272 - Cilia function as calcium-mediated mechanosensors that instruct left-right asymmetry.
Djenoune L, Mahamdeh M, Truong TV, Nguyen CT, Fraser SE, Brueckner M, Howard J, Yuan S. Djenoune L, et al. Science. 2023 Jan 6;379(6627):71-78. doi: 10.1126/science.abq7317. Epub 2023 Jan 5. Science. 2023. PMID: 36603098 Free PMC article. - Kupffer's vesicle is a ciliated organ of asymmetry in the zebrafish embryo that initiates left-right development of the brain, heart and gut.
Essner JJ, Amack JD, Nyholm MK, Harris EB, Yost HJ. Essner JJ, et al. Development. 2005 Mar;132(6):1247-60. doi: 10.1242/dev.01663. Epub 2005 Feb 16. Development. 2005. PMID: 15716348 - New insights into ion channel-dependent signalling during left-right patterning.
Tajhya R, Delling M. Tajhya R, et al. J Physiol. 2020 May;598(9):1741-1752. doi: 10.1113/JP277835. Epub 2019 Jun 13. J Physiol. 2020. PMID: 31106399 Review. - Cilia multifunctional organelles at the center of vertebrate left-right asymmetry.
Basu B, Brueckner M. Basu B, et al. Curr Top Dev Biol. 2008;85:151-74. doi: 10.1016/S0070-2153(08)00806-5. Curr Top Dev Biol. 2008. PMID: 19147005 Review.
Cited by
- Functions of cilia in cardiac development and disease.
Shaikh Qureshi WM, Hentges KE. Shaikh Qureshi WM, et al. Ann Hum Genet. 2024 Jan;88(1):4-26. doi: 10.1111/ahg.12534. Epub 2023 Oct 23. Ann Hum Genet. 2024. PMID: 37872827 Free PMC article. Review. - Identification and Expression Analysis of the Complete Family of Zebrafish pkd Genes.
England SJ, Campbell PC, Banerjee S, Swanson AJ, Lewis KE. England SJ, et al. Front Cell Dev Biol. 2017 Feb 21;5:5. doi: 10.3389/fcell.2017.00005. eCollection 2017. Front Cell Dev Biol. 2017. PMID: 28271061 Free PMC article. - Spatial Allocation and Specification of Cardiomyocytes during Zebrafish Embryogenesis.
Fukui H, Chiba A, Miyazaki T, Takano H, Ishikawa H, Omori T, Mochiuzki N. Fukui H, et al. Korean Circ J. 2017 Mar;47(2):160-167. doi: 10.4070/kcj.2016.0280. Epub 2017 Mar 13. Korean Circ J. 2017. PMID: 28382067 Free PMC article. Review. - The molecular structure of mammalian primary cilia revealed by cryo-electron tomography.
Kiesel P, Alvarez Viar G, Tsoy N, Maraspini R, Gorilak P, Varga V, Honigmann A, Pigino G. Kiesel P, et al. Nat Struct Mol Biol. 2020 Dec;27(12):1115-1124. doi: 10.1038/s41594-020-0507-4. Epub 2020 Sep 28. Nat Struct Mol Biol. 2020. PMID: 32989303 Free PMC article. - Nephronophthisis-Pathobiology and Molecular Pathogenesis of a Rare Kidney Genetic Disease.
Gupta S, Ozimek-Kulik JE, Phillips JK. Gupta S, et al. Genes (Basel). 2021 Nov 5;12(11):1762. doi: 10.3390/genes12111762. Genes (Basel). 2021. PMID: 34828368 Free PMC article. Review.
References
- Basu B, Brueckner M. Cilia multifunctional organelles at the center of vertebrate left-right asymmetry. Curr Top Dev Biol. 2008;85:151–174. - PubMed
- Brown NA, Wolpert L. The development of handedness in left/right asymmetry. Development. 1990;109:1–9. - PubMed
- Essner JJ, Amack JD, Nyholm MK, Harris EB, Yost HJ. Kupffer’s vesicle is a ciliated organ of asymmetry in the zebrafish embryo that initiates left-right development of the brain, heart and gut. Development. 2005;132:1247–1260. - PubMed
- Kramer-Zucker AG, Olale F, Haycraft CJ, Yoder BK, Schier AF, Drummond IA. Cilia-driven fluid flow in the zebrafish pronephros, brain and Kupffer’s vesicle is required for normal organogenesis. Development. 2005;132:1907–1921. - PubMed
Publication types
MeSH terms
Substances
Supplementary concepts
Grants and funding
- R01 HL093280/HL/NHLBI NIH HHS/United States
- R01 DK092808/DK/NIDDK NIH HHS/United States
- T32 HD007094/HD/NICHD NIH HHS/United States
- 1P30DK090744-01/DK/NIDDK NIH HHS/United States
- 5T32HD00709436/HD/NICHD NIH HHS/United States
- R01 HL125885/HL/NHLBI NIH HHS/United States
- R01DK092808-01A1/DK/NIDDK NIH HHS/United States
- R01HL093280/HL/NHLBI NIH HHS/United States
- P30 DK090744/DK/NIDDK NIH HHS/United States
LinkOut - more resources
Full Text Sources
Other Literature Sources
Molecular Biology Databases
Miscellaneous


