Ski regulates Hippo and TAZ signaling to suppress breast cancer progression - PubMed (original) (raw)
Ski regulates Hippo and TAZ signaling to suppress breast cancer progression
Juliet Rashidian et al. Sci Signal. 2015.
Abstract
Ski, the transforming protein of the avian Sloan-Kettering retrovirus, inhibits transforming growth factor-β (TGF-β)/Smad signaling and displays both pro-oncogenic and anti-oncogenic activities in human cancer. Inhibition of TGF-β signaling is likely responsible for the pro-oncogenic activity of Ski. We investigated the mechanism(s) underlying the tumor suppressor activity of Ski and found that Ski suppressed the activity of the Hippo signaling effectors TAZ and YAP to inhibit breast cancer progression. TAZ and YAP are transcriptional coactivators that can contribute to cancer by promoting proliferation, tumorigenesis, and cancer stem cell expansion. Hippo signaling activates the the Lats family of kinases, which phosphorylate TAZ and YAP, resulting in cytoplasmic retention and degradation and inhibition of their transcriptional activity. We showed that Ski interacted with multiple components of the Hippo pathway to facilitate activation of Lats2, resulting in increased phosphorylation and subsequent degradation of TAZ. Ski also promoted the degradation of a constitutively active TAZ mutant that is not phosphorylated by Lats, suggesting the existence of a Lats2-independent degradation pathway. Finally, we showed that Ski repressed the transcriptional activity of TAZ by binding to the TAZ partner TEAD and recruiting the transcriptional co-repressor NCoR1 to the TEAD-TAZ complex. Ski effectively reversed transformation and epithelial-to-mesenchyme transition in cultured breast cancer cells and metastasis in TAZ-expressing xenografted tumors. Thus, Ski inhibited the function of TAZ through multiple mechanisms in human cancer cells.
Copyright © 2015, American Association for the Advancement of Science.
Conflict of interest statement
Competing interests: The authors declare that they have no competing interests.
Figures
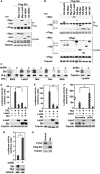
Fig. 1. Ski interacts with multiple components of the Hippo pathway and inhibits the transcriptional activity of TAZ and YAP
(A) Lysates from 293T cells expressing Flag-Ski together with control vector, Myc-Lats1, Myc-Lats2, HA-NDR1, or HA-NDR2 were subjected to immunoprecipitation (IP) with anti-Flag beads, and proteins associated with Flag-Ski were detected by Western blotting (WB) with anti-Myc or anti-HA antibodies (upper panel). The abundance of these proteins in the lysates was examined by Western blotting (lower panel). (B) Myc-or HA-tagged Hippo signaling proteins associated with Ski were isolated by immunoprecipitation with anti-Flag beads and detected by Western blotting with anti-Myc or anti-HA antibodies. Smad3 was used as a positive control for binding to Ski. Tubulin was used as a loading control. (C) Interactions between endogenous Ski and various Hippo signaling proteins were examined in MDA-MB-231 cells transfected or not with Ski shRNA (shSki) by immunoprecipitation with antibodies against Mst2, Lats2, Mer, Sav, and Mob followed by Western blotting with anti-Ski (upper panels). The abundance of Mst2, Lats2, Mer, Sav, and Mob in the immunoprecipitates was assessed by Western blotting with the corresponding antibodies (lower panels). The knockdown of Ski was evaluated by Western blotting with anti-Ski antibody in cell lysates (right panel). (D and E) Luciferase activity was measured in human embryonic kidney (HEK) 293 cells expressing HA-TAZ (D) or HA-YAP (E) in the presence or absence of HA-Lats2 or Flag-Ski. (F) Reducing endogenous Ski by siRNA increases the transcriptional activity of TAZ. (G) Reducing endogenous Ski by shRNA enhanced the transcriptional activity of endogenous TAZ in MDA-MB-231 cells. (H) Ski decreases the abundance of endogenous CTGF. CTGF and Ski abundance in MCF10A control or Ski-overexpressing cells was examined by Western blotting. Tubulin was used as a loading control. Data in the graphs in (D) to (G) were derived from at least three independent experiments and are presented as means ± SEM (Student’s t test, *P < 0.05). Western blots in (A) to (C) and (H) are representative of three independent experiments.
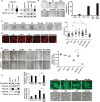
Fig. 2. Ski reverses TAZ-induced oncogenic transformation and EMT
(A) Western blot analysis of Ski and TAZ abundance in MCF10A or MCF10A/TAZ cells stably infected with Ski cDNA or shSki. Western blots are representative of two independent experiments. (B) Ski blocked anchorage-independent growth induced by TAZ. Soft agar colonies formed by MCF10A cells stably expressing various cDNAs and shRNAs as indicated were stained and quantified. Data in the graph were derived from at least three independent experiments and are presented as means ± SEM [Student’s t test, *P < 0.05 (P value was calculated after colony counts were averaged and converted to logarithmic scale)]. Scale bar, 3 mm. (C) Phase-contrast images of 3D acini formed by MCF10A cells stably expressing various constructs as indicated. The size of an acinus was determined by the number of nuclei in each acinus. Forty acini from three independent experiments were quantified for each cell line and presented in the graph as means ± SEM [analysis of variance (ANOVA), Newman-Keuls multiple comparison test; *P < 0.05, **P < 0.01]. Scale bar, 40 μm. Significant differences between the control and shSki or TAZ cells and between shSki and shSki + TAZ siRNA (siTAZ) cells (**P<0.01) and between TAZ and Ski-TAZ cells (*P< 0.05) were detected. (D) Actin stress fiber formation was visualized by staining with rhodamine-conjugated phalloidin. Images are representative of three independent experiments. Scale bar, 20 μm. (E) Wound healing assay. Data in the graph were derived from at least three independent experiments and are presented as means ± SEM (ANOVA, Newman-Keuls multiple comparison test; *P < 0.05). Scale bar, 300 μm. (F) Ski reversed the effect of TAZ on the abundance of E-cadherin and vimentin as determined by Western blotting. Data in the graph were derived from at least three independent experiments and are presented as means ± SEM (Student’s t test, *P < 0.05 and **P < 0.01). The cell morphology (scale bar, 50 μm) and E-cadherin localization (scale bar, 20 μm) are shown in the panels to the right. Images are representative of three independent experiments.
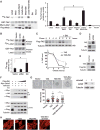
Fig. 3. Ski enhances phosphorylation of TAZ by Lats2
(A) Ski enhanced the kinase activity of Lats2. Myc-Lats2 was immunoprecipitated from 293T cells expressing Myc-Lats2 alone or together with Mst2 and Ski as indicated and subjected to in vitro kinase assay using GST-TAZ as a substrate. The abundance of GST-TAZ, Myc-Lats2, and Flag-Mst2 was measured by Western blotting (lower panels). Western blots are representative of three independent experiments. 32P-TAZ abundance was quantified from at least three independent experiments, and data are presented as means ± SEM (Student’s t test, *P < 0.05). (B) Endogenous Lats2 was immunoprecipitated from MCF10A cells stably expressing control vector, Ski, and shSki and subjected to an in vitro kinase assay with GST-TAZ as an exogenous substrate. The abundance of GST-TAZ and Lats2 was measured by Western blotting. Western blots are representative of three independent experiments. Data are presented as means ± SEM (Student’s t test, *P < 0.05). (C) Pulse-chase assays. 35S-labeled Flag-TAZ was immunoprecipitated with anti-Flag beads and detected by autoradiography. Data in the graph were derived from at least three independent experiments and are presented as means ± SEM (Student’s t test, *P < 0.05). (D and E) Western blot analysis indicated that endogenous TAZ abundance was enhanced in shSki-expressing cells (D) and reduced in Ski over-expressing cells (E). Western blots are representative of three independent experiments. (F) Ski enhanced the Lats2-Sav interaction. HA-Sav was immunoprecipitated from cells transfected with fixed amounts of Myc-Lats2 and HA-Sav and increasing amounts of Flag-Ski, and the associated Myc-Lats2 was detected by Western blotting with anti-Myc antibody. Cells transfected with Flag-Ski and Myc-Lats2 were used as negative controls for anti-Myc immunoprecipitation. Western blots are representative of three independent experiments. (G) Reducing Lats2 by siRNA reversed the inhibition of TAZ by Ski in 3D morphogenesis. Top: Phase-contrast images of 3D acini. Bottom: Forty acini from three independent experiments were quantified for each cell line and presented in the graph as means ± SEM (ANOVA, Newman-Keuls multiple comparison test). Significant differences between TAZ+Ski cells expressing control vector and Lats2 siRNA (siLats2) were detected (**P < 0.05). Scale bar, 40 μm. (H) Reducing Lats2 reversed the Ski inhibition of TAZ-dependent actin stress fiber formation. Images are representative of three independent experiments. Scale bar, 20 μm.
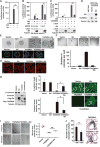
Fig. 4. Ski also inhibits TAZ through a Lats2-independent mechanism
(A) Ski inhibited TAZ transcription activity in Sav−/− ACHN cells as measured by a luciferase assay. (B) Ski could inhibit TAZ independently of Lats2. Luciferase activity was measured in HEK293 cells that were transfected with Lats2 siRNA before being transfected with HA-TAZ, Flag-Ski, and a luciferase reporter. (C) Ski inhibited the transcriptional activity of TAZS89A in a luciferase assay. WT TAZ with Lats2 or Ski was used as a positive control. Data in the graphs in (A) to (C) were derived from at least three independent experiments and are presented as means ± SEM (Student’s t test, *P < 0.05, **P < 0.01). (D) The abundance of Ski and TAZS89A in MCF10A cells stably expressing TAZS89A with or without Ski was measured by Western blotting. Western blots are representative of two independent experiments. (E) Ski reversed transformation induced by TAZS89A. Top: Phase-contrast images of acini cultured in 3D Matrigel. Bottom: Confocal images of acini stained for α6-integrin (green) and Golgi matrix protein of 130 kD (GM130; red). Nuclei are stained with 4′,6-diamidino-2-phenylindole (blue). Images are representative of three independent experiments. Scale bar, 40 μm. (F) Ski inhibited anchorage-independent growth induced by TAZ-S89A. Soft agar colonies formed by MCF10A/TAZS89A cells with or without Ski were stained with 3-(4,5-dimethylthiazol-2-yl)-2,5-diphenyltetrazolium bromide (MTT) and quantified. Data in the graph were derived from at least three independent experiments and are presented as means ± SEM [Student’s t test, *P < 0.05 (P value was calculated after colony counts were averaged and converted to logarithmic scale)]. Scale bar, 3 mm. (G) Actin stress fiber formation was analyzed by staining with rhodamine-conjugated phalloidin. Images are representative of three independent experiments. Scale bar, 20 μm. (H) Ski reversed the effects of TAZS89A on E-cadherin (partially) and vimentin abundance as shown by Western blotting (left) and immunofluorescence staining (right). Data shown in the graphs (middle) were derived from at least three independent experiments and are presented as means ± SEM (Student’s t test, *P < 0.05). Scale bar, 20 μm. (I) Wound healing assay. Ski partially reversed the increase in cell motility caused by TAZS89A. Data in the graph were derived from at least three independent experiments and are presented as means ± SEM (ANOVA, Newman-Keuls multiple comparison test). ns, nonsignificant differences. (J) Ski reduced the metastatic potential of TAZ in vivo. Representative images of the metastatic nodules in hematoxylin and eosin (H&E)–stained lung sections from mice injected with cells expressing TAZS89A or Ski+TAZS89A are shown on the right. Scale bar, 100 μm. Quantification of the number of metastatic nodules from three sections per mouse and six mice per cell line is shown in the bar graph on the left. Data are presented as means ± SEM (Student’s t test, *P = 0.004).
Fig. 5. Ski also destabilizes TAZ through a Lats2-independent mechanism
(A) Ski decreased the stability of TAZS89A. Cells transfected with Flag-TAZS89A together with or without Flag-Ski were subjected to a pulse-chase assay. Data in the graph were derived from at least three independent experiments and are presented as means ± SEM (Student’s t test, *P < 0.05). (B and C) Western blotting analysis shows that overexpression of Ski decreased the abundance of TAZS89A (B) and TAZS311A (C). Western blots are representative of two independent experiments. (D) Suppression of TAZ and TAZS89A by Ski required the proteasome. The abundance of endogenous TAZ (left) or TAZS89A (right) was measured in MG132-treated cells expressing Flag-Ski alone (left) or Flag-Ski plus TAZS89A (right) by Western blotting. Western blots are representative of three independent experiments.
Fig. 6. Ski recruits NCoR1 to the TEAD/TAZ complex
(A) Ski bound to TEAD. Endogenous Ski was immunoprecipitated from control or shSki-expressing MDA-MB-231 cells with anti-Ski, and associated endogenous TEAD was detected by Western blotting with an anti-TEAD antibody that cross-reacts with multiple TEAD isoforms. Western blots are representative of two independent experiments. (B) Ski did not affect the TAZ-TEAD interaction. 293T cells expressing fixed amounts of HA-TAZ and Myc-TEAD4 and increasing amounts of Flag-Ski were pretreated with MG132 before being subjected to anti-HA immunoprecipitation followed by Western blotting with anti-Myc. Western blots are representative of two independent experiments. (C) TEAD formed a complex with NCoR1 in the presence of Ski. 293T cells were transfected with Myc-TEAD4 alone, Flag-Ski alone, or the two together. TEAD4 was immunoprecipitated with anti-Myc, and associated endogenous NCoR1 was detected by Western blotting with anti-NCoR1. Western blots are representative of two independent experiments. (D) Endogenous TEAD and NCoR1 formed a complex in the presence of Ski. TEAD4 was immunoprecipitated from MCF10A/Ski cells with anti-TEAD, and associated endogenous NCoR1 was detected by Western blotting with anti-NCoR1. Western blots are representative of two independent experiments. (E) Luciferase activity was measured in HEK293T cells expressing HA-TAZ together with various cDNA and siRNA constructs as indicated. siNCoR1, NCoR1 siRNA. Data in the graph were derived from at least three independent experiments and are presented as mean ± SEM (Student’s t test, **P < 0.01).
Similar articles
- Ski regulates Smads and TAZ signaling to suppress lung cancer progression.
Xie M, Wu X, Zhang J, Zhang J, Li X. Xie M, et al. Mol Carcinog. 2017 Oct;56(10):2178-2189. doi: 10.1002/mc.22661. Epub 2017 Jul 28. Mol Carcinog. 2017. PMID: 28398634 - Hippo pathway effectors YAP, TAZ and TEAD are associated with EMT master regulators ZEB, Snail and with aggressive phenotype in phyllodes breast tumors.
Akrida I, Makrygianni M, Nikou S, Mulita F, Bravou V, Papadaki H. Akrida I, et al. Pathol Res Pract. 2024 Oct;262:155551. doi: 10.1016/j.prp.2024.155551. Epub 2024 Aug 15. Pathol Res Pract. 2024. PMID: 39153238 - A feed forward loop enforces YAP/TAZ signaling during tumorigenesis.
Gill MK, Christova T, Zhang YY, Gregorieff A, Zhang L, Narimatsu M, Song S, Xiong S, Couzens AL, Tong J, Krieger JR, Moran MF, Zlotta AR, van der Kwast TH, Gingras AC, Sicheri F, Wrana JL, Attisano L. Gill MK, et al. Nat Commun. 2018 Aug 29;9(1):3510. doi: 10.1038/s41467-018-05939-2. Nat Commun. 2018. PMID: 30158528 Free PMC article. - Reciprocal regulation of YAP/TAZ by the Hippo pathway and the Small GTPase pathway.
Jang JW, Kim MK, Bae SC. Jang JW, et al. Small GTPases. 2020 Jul;11(4):280-288. doi: 10.1080/21541248.2018.1435986. Epub 2018 Apr 20. Small GTPases. 2020. PMID: 29457552 Free PMC article. Review. - The Hippo Pathway and YAP/TAZ-TEAD Protein-Protein Interaction as Targets for Regenerative Medicine and Cancer Treatment.
Santucci M, Vignudelli T, Ferrari S, Mor M, Scalvini L, Bolognesi ML, Uliassi E, Costi MP. Santucci M, et al. J Med Chem. 2015 Jun 25;58(12):4857-73. doi: 10.1021/jm501615v. Epub 2015 Mar 11. J Med Chem. 2015. PMID: 25719868 Review.
Cited by
- Mechanical regulation of chromatin and transcription.
Dupont S, Wickström SA. Dupont S, et al. Nat Rev Genet. 2022 Oct;23(10):624-643. doi: 10.1038/s41576-022-00493-6. Epub 2022 May 23. Nat Rev Genet. 2022. PMID: 35606569 Review. - The role of Hippo signal pathway in breast cancer metastasis.
Wei C, Wang Y, Li X. Wei C, et al. Onco Targets Ther. 2018 Apr 17;11:2185-2193. doi: 10.2147/OTT.S157058. eCollection 2018. Onco Targets Ther. 2018. PMID: 29713187 Free PMC article. Review. - DNA binding partners of YAP/TAZ.
Kim MK, Jang JW, Bae SC. Kim MK, et al. BMB Rep. 2018 Mar;51(3):126-133. doi: 10.5483/bmbrep.2018.51.3.015. BMB Rep. 2018. PMID: 29366442 Free PMC article. Review. - Signaling Cross Talk between TGF-β/Smad and Other Signaling Pathways.
Luo K. Luo K. Cold Spring Harb Perspect Biol. 2017 Jan 3;9(1):a022137. doi: 10.1101/cshperspect.a022137. Cold Spring Harb Perspect Biol. 2017. PMID: 27836834 Free PMC article. Review. - Mechanobiology of YAP and TAZ in physiology and disease.
Panciera T, Azzolin L, Cordenonsi M, Piccolo S. Panciera T, et al. Nat Rev Mol Cell Biol. 2017 Dec;18(12):758-770. doi: 10.1038/nrm.2017.87. Epub 2017 Sep 27. Nat Rev Mol Cell Biol. 2017. PMID: 28951564 Free PMC article. Review.
References
- Reed JA, Bales E, Xu W, Okan NA, Bandyopadhyay D, Medrano EE. Cytoplasmic localization of the oncogenic protein Ski in human cutaneous melanomas in vivo: Functional implications for transforming growth factor β signaling. Cancer Res. 2001;61:8074–8078. - PubMed
- Fukuchi M, Nakajima M, Fukai Y, Miyazaki T, Masuda N, Sohda M, Manda R, Tsukada K, Kato H, Kuwano H. Increased expression of c-Ski as a co-repressor in transforming growth factor-β signaling correlates with progression of esophageal squamous cell carcinoma. Int J Cancer. 2004;108:818–824. - PubMed
Publication types
MeSH terms
Substances
Grants and funding
- R01 CA172667/CA/NCI NIH HHS/United States
- NIH RO1 CA101891/CA/NCI NIH HHS/United States
- R01 DK090347/DK/NIDDK NIH HHS/United States
- R01 CA101891/CA/NCI NIH HHS/United States
- R21 CA187632/CA/NCI NIH HHS/United States
LinkOut - more resources
Full Text Sources
Other Literature Sources
Medical
Research Materials


