Life extension factor klotho prevents mortality and enhances cognition in hAPP transgenic mice - PubMed (original) (raw)
. 2015 Feb 11;35(6):2358-71.
doi: 10.1523/JNEUROSCI.5791-12.2015.
Lei Zhu 2, Pascal E Sanchez 2, Kurtresha Worden 2, Lauren Broestl 3, Erik Johnson 2, Kaitlyn Ho 4, Gui-Qiu Yu 4, Daniel Kim 4, Alexander Betourne 3, Makoto Kuro-O 5, Eliezer Masliah 6, Carmela R Abraham 7, Lennart Mucke 1
Affiliations
- PMID: 25673831
- PMCID: PMC4323521
- DOI: 10.1523/JNEUROSCI.5791-12.2015
Life extension factor klotho prevents mortality and enhances cognition in hAPP transgenic mice
Dena B Dubal et al. J Neurosci. 2015.
Erratum in
- Erratum: Dubal et al., "Life Extension Factor Klotho Prevents Mortality and Enhances Cognition in hAPP Transgenic Mice".
[No authors listed] [No authors listed] J Neurosci. 2025 Feb 12;45(7):e0069252025. doi: 10.1523/JNEUROSCI.0069-25.2025. J Neurosci. 2025. PMID: 39843239 Free PMC article. No abstract available.
Abstract
Aging is the principal demographic risk factor for Alzheimer disease (AD), the most common neurodegenerative disorder. Klotho is a key modulator of the aging process and, when overexpressed, extends mammalian lifespan, increases synaptic plasticity, and enhances cognition. Whether klotho can counteract deficits related to neurodegenerative diseases, such as AD, is unknown. Here we show that elevating klotho expression decreases premature mortality and network dysfunction in human amyloid precursor protein (hAPP) transgenic mice, which simulate key aspects of AD. Increasing klotho levels prevented depletion of NMDA receptor (NMDAR) subunits in the hippocampus and enhanced spatial learning and memory in hAPP mice. Klotho elevation in hAPP mice increased the abundance of the GluN2B subunit of NMDAR in postsynaptic densities and NMDAR-dependent long-term potentiation, which is critical for learning and memory. Thus, increasing wild-type klotho levels or activities improves synaptic and cognitive functions, and may be of therapeutic benefit in AD and other cognitive disorders.
Keywords: Alzheimer's disease; NMDA receptors; aging; cognition; klotho; mice.
Copyright © 2015 the authors 0270-6474/15/352358-14$15.00/0.
Figures
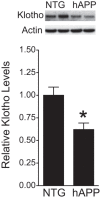
Figure 1.
Klotho is decreased in the DG of hAPP mice. Klotho protein levels in dentate gyrus homogenates from NTG and hAPP mice (n = 10–13 mice per genotype, age 5–7 months) were determined by Western blot analysis. Actin was used as a loading control. Representative Western blots (top) and relative levels of mouse klotho determined by densitometric quantitations of Western blot signals (bottom). Mean levels in controls were arbitrarily defined as 1.0; *p < 0.05 (t test). Bar graphs represent mean ± SEM.
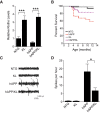
Figure 2.
Elevating klotho reduces mortality and improves network dysfunction in hAPP mice. A, Hippocampal klotho levels in KL and hAPP/KL mice determined by Western blot analysis and expressed relative to mean levels in NTG controls (n = 7–14 mice per genotype, age 3 months). KL effect p < 0.0001 by two-way ANOVA. B, Kaplan–Meier curves showing differences in survival between weaning and 12.5 months of age among the four genotypes indicated (n = 366 mice: 111 NTG, 67 hAPP, 110 KL, and 78 hAPP/KL; p < 0.0001 by log rank test; hAPP vs all other groups p < 0.05). Proportional hazard testing revealed the KL effect in hAPP mice to be independent of age (p = 0.5). C, Representative EEG traces recorded over the parietal cortex depicted with a compressed time scale. Gray arrowheads indicate abnormal spikes. D, Frequency of spikes recorded during 24 h measured from uncompressed, raw EEG traces (n = 3–7 mice per genotype, age 2–3.5 months). Two-way ANOVA: hAPP effect p < 0.01; *p < 0.05, ***p < 0.001 by Bonferroni-Holm test (A) or Welch's t test (D). Bar graphs represent mean ± SEM.
Figure 3.
Klotho elevation improves cognitive and behavioral abnormalities in hAPP mice. A–C, NTG, KL, hAPP, and hAPP/KL mice (n = 14–18 per genotype) were tested in the Morris water maze at 4–7 months. A, Spatial learning curves (platform hidden). Data points represent the daily average of total distance traveled to reach the platform in four trials. Mixed-model ANOVA: hAPP effect p < 0.001, KL effect p < 0.0001, hAPP by KL interaction p < 0.05; hAPP versus all other groups p < 0.001, NTG versus KL p = 0.06 (Bonferroni-Holm test). B, C, Probe trial (platform removed) results obtained 24 h after completion of hidden-platform training. B, Latency to reach the original platform location. Two-way ANOVA: hAPP effect p < 0.05, KL effect p < 0.001, hAPP by KL interaction p = 0.05; *p < 0.05 versus NTG, **p < 0.01 versus hAPP (Bonferroni-Holm test). C, Percentage of time mice spent in the target quadrant (black) versus the average percentage of time they spent in the other three quadrants (white); **p < 0.01, *p < 0.05 versus 25% (two-tailed, one-sample t tests). Dashed gray line indicates performance expected based on chance. Water maze data from some of the NTG and KL mice were reported previously (Dubal et al., 2014). D, Object recognition memory as reflected by the percentage of time mice spent exploring a novel object (n = 11–12 mice per genotype, age 5–8 months); *p < 0.05, **p < 0.01 versus 50% (two-tailed, one-sample t tests). Dashed gray line is average time spent with object during training, which was equivalent in all groups (data not shown). E, Passive avoidance memory, as reflected by latency to enter the dark chamber during the test session (n = 13–23 mice per genotype, age 5–8 months). Two-way ANOVA: KL effect p < 0.05, hAPP by KL interaction p < 0.05; *p < 0.05 versus all other groups (Bonferroni-Holm test). Dashed gray line is average latency to enter chamber during training, which was similar in all groups (data not shown). F, Total number of movements during exploration of an open field (n = 16–24 mice per genotype, age 4–7 months). Two-way ANOVA: hAPP effect p < 0.01; KL effect p < 0.05; *p < 0.05 versus NTG (Bonferroni-Holm test), o_p_ < 0.05 (Newman–Keuls test). G, Percentage of time mice spent exploring the open arms of an elevated plus maze (n = 16–24 mice per genotype, age 4–7 months). Two-way ANOVA: hAPP effect p < 0.001, hAPP by KL interaction p = 0.06; ***p < 0.001 versus NTG (Bonferroni-Holm test). Data represent mean ± SEM.
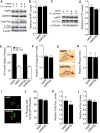
Figure 4.
Elevation of klotho in hAPP mice does not alter levels of hAPP, Aβ, β-CTFs, Aβ oligomers, total tau, or phospho-tau and does not prevent neuritic dystrophy. A, Representative Western blots showing hippocampal levels of hAPP, total mouse tau, phosphorylated (p) mouse tau (PHF-1 antibody, Ser 396/404), and β-actin. Images were captured from the same gel. B, Relative hAPP levels determined by quantitation of Western blot signals (n = 8–9 mice per genotype, age 3 months). GAPDH was used as a loading control. C, Representative Western blots showing hippocampal levels of hAPP, β-CTFs and α-tubulin. D, Relative β-CTF levels determined by quantitation of Western blot signals (n = 4 mice per genotype, age 3–4.5 months). E, Hippocampal Aβ1-x and Aβ1-42 levels determined by ELISA (n = 7–9 mice per genotype, age 3 months). F, Hippocampal Aβ oligomer levels determined by ECL assay (n = 4 mice per genotype, age 3–4.5 months). G, Immunostaining of hippocampal Aβ deposits in coronal brain sections from an hAPP (top) and an hAPP/KL mouse (bottom). Scale bar, 200 μm. H, Relative levels of hippocampal Aβ deposition (n = 12–14 mice per genotype, age 10–12.5 months). The percentage area covered by Aβ deposits in hAPP mice was arbitrarily defined as 1.0. I, Representative double-labeling of hippocampus for dystrophic neurites (antibody 8E5, red) and amyloid plaques (thioflavin-S, green) in hAPP and hAPP/KL mice (age 10–12.5 months; n = 10–12 per genotype). Scale bar, 50 μm. J, Quantification of dystrophic neurites expressed as a percentage of thioflavin-S-labeled plaques with surrounding neuritic dystrophy. K, L, Quantitation of total (K) and phosphorylated (L) mouse tau levels relative to levels found in hAPP mice (n = 8–9 mice per genotype, age 3 months). Actin was used as a loading control. Bar graphs represent mean ± SEM.
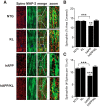
Figure 5.
Elevation of klotho prevents loss of spinophilin in the hippocampus of hAPP mice. A, Representative immunostaining of spinophillin (spino, red) and MAP-2 (green) in the hippocampus of NTG, KL, hAPP, and hAPP/KL mice. Scale bars: Spino, MAP-2, and merge, 5 μm; zoom, 10 μm. B, C, Quantification of spinophilin-immunoreactive spines in the DG (n = 10–27 mice per group, age 10–12.5 months) expressed as percentage area of MAP-2-positive structures covered (B) and number of punctae per 10 μm of MAP-2-positive dendrite (C). Two-way ANOVA: hAPP effect p < 0.05 (B) and p < 0.01 (C), KL effect p < 0.05 (B), and p < 0.0001 (C), hAPP by KL interaction p < 0.01 (B) and p < 0.0001 (C); **p < 0.01, ***p < 0.001 versus hAPP/KL or as indicated by brackets (Bonferroni-Holm test). Bar graphs represent mean ± SEM.
Figure 6.
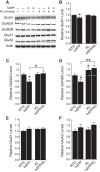
Klotho elevation prevents depletion of NMDAR subunits GluN1 and GluN2A, and increases hippocampal levels of GluN2B in hAPP mice. A, Representative Western blots showing hippocampal levels of NMDAR subunits GluN1, GluN2A, and GluN2B, and AMPAR subunits GluA1 and GluA2. Actin served as a loading control. B–F, Quantitation of Western blot signals relative to mean levels found in NTG mice (n = 7–15 mice per genotype, age 3 months). B, GluN1 levels. Two-way ANOVA: hAPP effect p < 0.05. C, GluN2A levels. Two-way ANOVA: KL effect p < 0.05; hAPP by KL interaction p < 0.05. D, GluN2B levels. Two-way ANOVA: KL effect p < 0.001. Dashed gray line is level of GluN2B in NTG mice. E, GluA1 levels. F, GluA2 levels; *p < 0.05, **p < 0.01 versus NTG or as indicated by brackets (Bonferroni-Holm test). Levels of NMDAR and AMPAR subunits in the NTG and KL mice were reported previously (Dubal et al., 2014). Bar graphs represent mean ± SEM.
Figure 7.
Klotho elevation increases GluN2B levels in hippocampal PSD fractions of hAPP mice. Non-PSD (1) and PSD (2) synaptic membrane fractions were isolated from hippocampal homogenates from mice of the indicated genotypes (n = 6–14 per genotype, age 3 months). A, Representative Western blots. B, Quantitation of GluN2B Western blot signals in the non-PSD fraction relative to NTG levels. Two-way ANOVA: hAPP effect p < 0.01; *p < 0.05 versus NTG, #p = 0.06 versus KL (Bonferroni-Holm test). C, Quantitation of GluN2B signals in PSD fraction relative to NTG levels. Two-way ANOVA: KL effect p < 0.05; *p < 0.05 versus NTG or as indicated by bracket (Bonferroni-Holm test). D, Ratio of PSD/non-PSD GluN2B levels in hAPP and hAPP/KL mice relative to ratio in hAPP mice; *p < 0.05 (t test). Bar graphs represent mean ± SEM.
Figure 8.
Klotho elevation ameliorates synaptic dysfunction in the hippocampus of hAPP mice. Field EPSPs were recorded from acute hippocampal slices obtained from 3.5- to 4.5-month-old mice. A, LTP induction and decay in the DG were monitored for 45–50 min following theta burst stimulation of the medial perforant pathway. Mixed-model ANOVA: hAPP effect, KL effect, and hAPP by KL interaction p < 0.001; NTG versus KL p < 0.05; hAPP versus all other groups p < 0.001 (Bonferroni-Holm test). B, Mean of the last 10 min of LTP recordings. Mixed-model ANOVA: hAPP effect p < 0.001, KL effect p < 0.001; **p < 0.01 versus all other groups or as indicated by brackets (Bonferroni-Holm test). The fEPSP results in NTG and KL slices were reported previously (Dubal et al., 2014). C, Input/output curves reflecting AMPAR-mediated synaptic transmission at Schaffer collateral to CA1 pyramidal cell synapses. Mixed-model ANOVA: hAPP effect p < 0.001, KL effect <0.05, hAPP by KL interaction p < 0.001; hAPP versus all other groups p < 0.001 (Bonferroni-Holm test). Number of slices/number of mice: NTG 3/3, KL 6/5, hAPP 7/5, hAPP/KL 7/3 (A, B), and NTG 9/3, KL 10/5, hAPP 9/5, hAPP/KL 11/3 (C). Data represent mean ± SEM.
Similar articles
- Nicotine-induced enhancement of synaptic plasticity at CA3-CA1 synapses requires GABAergic interneurons in adult anti-NGF mice.
Rosato-Siri M, Cattaneo A, Cherubini E. Rosato-Siri M, et al. J Physiol. 2006 Oct 15;576(Pt 2):361-77. doi: 10.1113/jphysiol.2006.114587. Epub 2006 Jul 27. J Physiol. 2006. PMID: 16873411 Free PMC article. - Troriluzole rescues glutamatergic deficits, amyloid and tau pathology, and synaptic and memory impairments in 3xTg-AD mice.
Pfitzer J, Pinky PD, Perman S, Redmon E, Cmelak L, Suppiramaniam V, Coric V, Qureshi IA, Gramlich MW, Reed MN. Pfitzer J, et al. J Neurochem. 2025 Jan;169(1):e16215. doi: 10.1111/jnc.16215. Epub 2024 Aug 30. J Neurochem. 2025. PMID: 39214859 - Mild Cognitive Impairment.
Anand S, Schoo C. Anand S, et al. 2024 Jan 11. In: StatPearls [Internet]. Treasure Island (FL): StatPearls Publishing; 2025 Jan–. 2024 Jan 11. In: StatPearls [Internet]. Treasure Island (FL): StatPearls Publishing; 2025 Jan–. PMID: 38261679 Free Books & Documents. - Cathepsin B Deficiency Improves Memory Deficits and Reduces Amyloid-β in hAβPP Mouse Models Representing the Major Sporadic Alzheimer's Disease Condition.
Hook G, Kindy M, Hook V. Hook G, et al. J Alzheimers Dis. 2023;93(1):33-46. doi: 10.3233/JAD-221005. J Alzheimers Dis. 2023. PMID: 36970896 Free PMC article. Review. - Depressing time: Waiting, melancholia, and the psychoanalytic practice of care.
Salisbury L, Baraitser L. Salisbury L, et al. In: Kirtsoglou E, Simpson B, editors. The Time of Anthropology: Studies of Contemporary Chronopolitics. Abingdon: Routledge; 2020. Chapter 5. In: Kirtsoglou E, Simpson B, editors. The Time of Anthropology: Studies of Contemporary Chronopolitics. Abingdon: Routledge; 2020. Chapter 5. PMID: 36137063 Free Books & Documents. Review.
Cited by
- A second X chromosome contributes to resilience in a mouse model of Alzheimer's disease.
Davis EJ, Broestl L, Abdulai-Saiku S, Worden K, Bonham LW, Miñones-Moyano E, Moreno AJ, Wang D, Chang K, Williams G, Garay BI, Lobach I, Devidze N, Kim D, Anderson-Bergman C, Yu GQ, White CC, Harris JA, Miller BL, Bennett DA, Arnold AP, De Jager PL, Palop JJ, Panning B, Yokoyama JS, Mucke L, Dubal DB. Davis EJ, et al. Sci Transl Med. 2020 Aug 26;12(558):eaaz5677. doi: 10.1126/scitranslmed.aaz5677. Sci Transl Med. 2020. PMID: 32848093 Free PMC article. - Calorie Restriction Suppresses Age-Dependent Hippocampal Transcriptional Signatures.
Schafer MJ, Dolgalev I, Alldred MJ, Heguy A, Ginsberg SD. Schafer MJ, et al. PLoS One. 2015 Jul 29;10(7):e0133923. doi: 10.1371/journal.pone.0133923. eCollection 2015. PLoS One. 2015. PMID: 26221964 Free PMC article. - KL-FGF23-VD Axis in Improving Late-Onset Alzheimer's Disease by Modulating IKK/NF-_κ_B Signal Pathway.
Cai Y, Hu J, He M. Cai Y, et al. Evid Based Complement Alternat Med. 2022 Sep 9;2022:3100621. doi: 10.1155/2022/3100621. eCollection 2022. Evid Based Complement Alternat Med. 2022. PMID: 36118087 Free PMC article. Retracted. - Molecular and cellular aspects of age-related cognitive decline and Alzheimer's disease.
Hullinger R, Puglielli L. Hullinger R, et al. Behav Brain Res. 2017 Mar 30;322(Pt B):191-205. doi: 10.1016/j.bbr.2016.05.008. Epub 2016 May 7. Behav Brain Res. 2017. PMID: 27163751 Free PMC article. Review. - KLOTHO KL-VS heterozygosity is associated with diminished age-related neuroinflammation, neurodegeneration, and synaptic dysfunction in older cognitively unimpaired adults.
Driscoll IF, Lose S, Ma Y, Bendlin BB, Gallagher C, Johnson SC, Asthana S, Hermann B, Sager MA, Blennow K, Zetterberg H, Carlsson C, Kollmorgen G, Quijano-Rubio C, Dubal D, Okonkwo OC. Driscoll IF, et al. Alzheimers Dement. 2024 Aug;20(8):5347-5356. doi: 10.1002/alz.13912. Epub 2024 Jun 21. Alzheimers Dement. 2024. PMID: 39030746 Free PMC article.
References
- Akram A, Christoffel D, Rocher AB, Bouras C, Kövari E, Perl DP, Morrison JH, Herrmann FR, Haroutunian V, Giannakopoulos P, Hof PR. Stereologic estimates of total spinophilin-immunoreactive spine number in area 9 and the CA1 field: relationship with the progression of Alzheimer's disease. Neurobiol Aging. 2008;29:1296–1307. doi: 10.1016/j.neurobiolaging.2007.03.007. - DOI - PMC - PubMed
- Albert MS, DeKosky ST, Dickson D, Dubois B, Feldman HH, Fox NC, Gamst A, Holtzman DM, Jagust WJ, Petersen RC, Snyder PJ, Carrillo MC, Thies B, Phelps CH. The diagnosis of mild cognitive impairment due to Alzheimer's disease: recommendations from the national institute on aging-Alzheimer's association workgroups on diagnostic guidelines for Alzheimer's disease. Alzheimers Dement. 2011;7:270–279. doi: 10.1016/j.jalz.2011.03.008. - DOI - PMC - PubMed
Publication types
MeSH terms
Substances
Grants and funding
- NS041787/NS/NINDS NIH HHS/United States
- P50 AG005131/AG/NIA NIH HHS/United States
- NS088532/NS/NINDS NIH HHS/United States
- AG010435/AG/NIA NIH HHS/United States
- R01 NS041787/NS/NINDS NIH HHS/United States
- R01 AG019712/AG/NIA NIH HHS/United States
- AG034531/AG/NIA NIH HHS/United States
- P30 NS065780/NS/NINDS NIH HHS/United States
- P01 AG000001/AG/NIA NIH HHS/United States
- AG000001/AG/NIA NIH HHS/United States
- R01 NS088532/NS/NINDS NIH HHS/United States
- R01 AG018440/AG/NIA NIH HHS/United States
- R37 AG018440/AG/NIA NIH HHS/United States
- P01 AG010435/AG/NIA NIH HHS/United States
- AG019712/AG/NIA NIH HHS/United States
- AG18440/AG/NIA NIH HHS/United States
- K08 AG034531/AG/NIA NIH HHS/United States
- RR18938-01/RR/NCRR NIH HHS/United States
- NS065780/NS/NINDS NIH HHS/United States
LinkOut - more resources
Full Text Sources
Other Literature Sources
Molecular Biology Databases
