The transcription factor NFAT promotes exhaustion of activated CD8⁺ T cells - PubMed (original) (raw)
. 2015 Feb 17;42(2):265-278.
doi: 10.1016/j.immuni.2015.01.006. Epub 2015 Feb 10.
Renata M Pereira 1, Tarmo Äijö 2, Edward Y Kim 3, Francesco Marangoni 3, Matthew E Pipkin 4, Susan Togher 1, Vigo Heissmeyer 5, Yi Chen Zhang 6, Shane Crotty 7, Edward D Lamperti 8, K Mark Ansel 9, Thorsten R Mempel 3, Harri Lähdesmäki 10, Patrick G Hogan 1, Anjana Rao 11
Affiliations
- PMID: 25680272
- PMCID: PMC4346317
- DOI: 10.1016/j.immuni.2015.01.006
The transcription factor NFAT promotes exhaustion of activated CD8⁺ T cells
Gustavo J Martinez et al. Immunity. 2015.
Abstract
During persistent antigen stimulation, CD8(+) T cells show a gradual decrease in effector function, referred to as exhaustion, which impairs responses in the setting of tumors and infections. Here we demonstrate that the transcription factor NFAT controls the program of T cell exhaustion. When expressed in cells, an engineered form of NFAT1 unable to interact with AP-1 transcription factors diminished T cell receptor (TCR) signaling, increased the expression of inhibitory cell surface receptors, and interfered with the ability of CD8(+) T cells to protect against Listeria infection and attenuate tumor growth in vivo. We defined the genomic regions occupied by endogenous and engineered NFAT1 in primary CD8(+) T cells and showed that genes directly induced by the engineered NFAT1 overlapped with genes expressed in exhausted CD8(+) T cells in vivo. Our data show that NFAT promotes T cell anergy and exhaustion by binding at sites that do not require cooperation with AP-1.
Copyright © 2015 Elsevier Inc. All rights reserved.
Conflict of interest statement
The authors declare no conflict of interest.
Figures
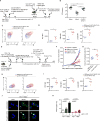
Figure 1. CTLs expressing a constitutively active NFAT1 incapable of cooperating with AP-1 have impaired in vivo function
(A–D) GFPhi P14+ CD8+ T cells expressing CA-RIT-NFAT1 or its DNA-binding mutant were transferred to CD45.1+ congenic mice, which were infected one day later with gp33-expressing Listeria monocytogenes. (B) Three days after infection, total bacterial colony-forming units (CFU) per spleen were determined (each dot represents a mouse; mean ± SEM. *, p < 0.05; ***, p < 0.001 using t test). A representative experiment of two is shown. (**C**) Five days after infection, co-expression of PD-1 and LAG3 or PD-1 and TIM3 on transferred cells (CD45.2+) was determined by flow cytometry. Representative contour plots are shown. (**D**) The mean fluorescence intensity (MFI) for each receptor is shown. p values were calculated using t-test. *, p < 0.05; **, p < 0.005; ****, p< 0.0001. (**E-I**) GFPhi Thy1.2+ CL4+ TCR transgenic CD8+ T cells expressing CA-RIT-NFAT1 or its DNA-binding mutant were transferred to Thy1.1+ congenic mice, injected seven 7 days previously with CT26 and CT26HA tumor cells in contralateral flanks. (**F**) Tumor growth was determined on a daily basis after cell transfer. (**G–I**) Characterization of transferred cells 3 days after transfer. (**G**) Frequency of tumor-infiltrating CA-RIT-NFAT1- and DBDmut-CA-RIT-NFAT1-transduced cells in live gate. (**H–I**) Co-expression of inhibitory receptors on transferred cells determined by flow cytometry. Representative contour plots are shown. (**I**) MFI for each receptor is shown. p values were calculated using t-test. **, p < 0.005; ***, p < 0.0005; ****, p< 0.0001. (**J–K**) NFAT nuclear translocation in exhausted cells. Single cell suspensions from 10 day-old CT26HA tumors were stimulated _ex vivo_ with increasing doses of plate-bound anti-CD3 and immediately fixed. (**J)** Confocal images of _ex vivo_-stimulated exhausted cells (CD45+CD8+PD-1+Tim-3+) purified by cell sorting and stained for endogenous NFAT1. Arrows highlight cells with nuclear NFAT1. Scale bar 10 μm. (**K)** NFAT nuclear translocation in exhausted (PD-1+TIM3+) and non-exhausted (PD-1−TIM3−) CD8+ tumor-infiltrating lymphocytes calculated from confocal images in **J**. Means ± S.D. of >10 fields of view (at least 720 cells) are shown. p values were calculated by t-test. See also Figures S1, S2.
Figure 2. The transcriptional program induced by CA-RIT-NFAT1 in T cells overlaps with that of in vivo exhausted/anergic T cells
(A) Genes whose expression is altered upon CA-RIT-NFAT1 expression in CD8+ (top panel) or CD4+ (bottom panel) T cells. Changes in gene expression in CA-RIT-NFAT1-expressing versus mock-transduced cells plotted against overall gene expression. (B) Venn diagram displaying numbers of genes significantly induced (top panel) or downregulated (bottom panel) in CD8+ and/or CD4+ T cells. (C) Heatmap representation of changes in gene expression in CA-RIT-NFAT1-transduced over mock-transduced CD4+ and CD8+ T cells (p<0.05). Each horizontal line represents one gene, ordered by gene expression (highest to lowest fold change). 18 genes which showed opposite trends in CD4+ and CD8+ T cells were omitted (depicted in the upper left and lower right quadrants of D, right panel). (D) Scatter plot representing changes in gene expression in CA-RIT-NFAT1-transduced cells versus mock-transduced cells (RPKM values from RNA-Seq) in CD8+ T cells (y axis) versus CD4+ T cells (x-axis). Each dot represents a gene. Pearson correlation coefficients are indicated. *, p<10−10. (E) Overlap of genes significantly upregulated upon CA-RIT-NFAT1 expression in CD8+ T cells with genes significantly upregulated in either _in vivo_-generated exhausted CD8+ T cells (top) (cluster #1,(Wherry et al., 2007)), or in anergic CD4+ CD25− CD45RBlo LAG3+ anergic T cells compared to CD4+ CD25− CD45RBlo Lag3− T cells (bottom) (Okamura et al., 2009). (F) Plots show the probability of observing more than N overlapping genes if sets with 1,047 and 78 genes (top) or 1,007 and 480 genes (bottom) are sampled randomly from the set of all genes. * p-value for the overlap < 10−10 (one-tailed Fisher’s exact test). See also Tables S1, S2, S6 and Figure S3.
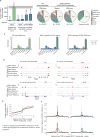
Figure 3. CA-RIT-NFAT1 directly upregulates gene expression by binding to promoter regions
ChIP-seq results for endogenous NFAT1 in WT cells and for CA-RIT-NFAT1 in transduced NFAT1-deficient cells, either untreated or restimulated with PMA and ionomycin for 1h. (A) Number of NFAT1 and CA-RIT-NFAT1 ChIP-seq peaks identified by HOMER. (B) Pie charts show the genomic distribution of ChIP-seq peaks for endogenous NFAT1 in WT cells transduced with empty vector (left pie chart), or CA-RIT-NFAT1 ChIP-seq peaks in NFAT1-deficient cells transduced with CA-RIT-NFAT1 (middle two pie charts). Representation of the annotated regions in the mouse mm9 genome is shown for comparison (right pie chart). (C) Enrichment of NFAT1 binding sites in annotated genomic regions based on their relative abundance in the mouse genome (mm9). Statistical analysis was performed using Fisher’s exact test. ***, p<2e-16; ** p<1e-10; * p<1e-2. (D) Genome browser views of Lag3, Pdcd1 (encoding PD-1), Siglec5 and Havcr2 (encoding Tim3) loci showing the distribution of NFAT1 and CA-RIT-NFAT1 ChIP-seq peaks. (E–F) Cumulative plots (E) or probability per base pair (F) of the distance between the closest NFAT1 binding site relative to the transcription start site of all genes (black curves), genes significantly (p < 0.05) upregulated (red curves) or downregulated (blue curves) in NFAT1-deficient cells transduced with CA-RIT-NFAT1 in resting conditions. See also Figure S4.
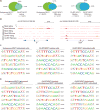
Figure 4. ChIP-seq peaks for endogenous NFAT1 are enriched for composite NFAT:AP-1 sites
(A) Venn diagrams showing the overlap of ChIP-seq peaks in the different conditions. (B) Genome browser views of Il2 and Ctla4 loci showing the distribution of ChIP-seq peaks. (C) List of the top six most representative motifs ranked based on the p-values. The HOMER program searches for published motifs, and therefore duplicate AP-1 and Runx sequences are listed. (D) Motifs identified as enriched only in peaks from one set of ChIP-seq data as indicated. See also Table S3.
Figure 5. NFAT family members regulate the expression of inhibitory receptors in vitro
Naïve WT, NFAT 1-deficient, NFAT2-deficient or NFAT1, 2-deficient CD8+ T cells were purified by FACS, and transduced with a retrovirus encoding Ametrine (a variant GFP) and shRNAs targeting either CD4 (negative control) or NFAT4 to yield single, double or triple NFAT-deficient cells. On day 6 after activation, cells were restimulated with PMA and ionomycin for 6 h (A and C right panels), or left untreated (B and C left panels). IFN-y and IL-2 production (A) or expression of cell surface receptors (C) was determined by flow cytometry of Ametrinehi cells. A representative experiment out of two is shown. (B) Expression of mRNA encoding NFAT4 was assessed by quantitative real time PCR and normalized to mRNA encoding L32 ribosomal protein. The amount of expression in control shCD4 cells was set at 1. Combined results from 3 independent experiments are shown (mean ± SEM). See also Figure S5.
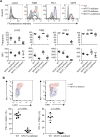
Figure 6. NFAT family members regulate the expression of inhibitory receptors in vivo
(A) Acute infection. Naïve P14+ _Tcra_−/− WT, NFAT1-deficient, NFAT2-deficient or NFAT1, 2-deficient CD8+ T cells (CD45.2+) were transferred intravenously into CD45.1+ congenic mice, after which the mice were injected with LCMV (2 × 10⁵ PFU) intraperitoneally. Eight days after infection, splenocytes were harvested and the expression of inhibitory receptors on the adoptively transferred CD8+ CD45.2+ cells was evaluated. Top panel, a representative example for each genotype is shown; bottom panels, data for 8–10 mice in each group are summarized as mean ± SEM, with each dot representing a mouse. A representative experiment out of two is shown. The gray histogram shows unstained control. (B) Chronic infection. WT mice and mice lacking both NFAT1 and NFAT2 in T cells were infected with LCMV clone 13. Eighteen days after infection, splenocytes were harvested and expression of inhibitory receptors on CD8+ CD44+ H2Db-gp33-41+ cells was determined by flow cytometry. Top panel, representative contour plots. Bottom panel, results from individual mice (2–3 independent experiments; each mouse is represented by a dot). p values were calculated using t-test.
Comment in
- The importance of cooperation: partnerless NFAT induces T cell exhaustion.
Bengsch B, Wherry EJ. Bengsch B, et al. Immunity. 2015 Feb 17;42(2):203-205. doi: 10.1016/j.immuni.2015.01.023. Immunity. 2015. PMID: 25692694
Similar articles
- The importance of cooperation: partnerless NFAT induces T cell exhaustion.
Bengsch B, Wherry EJ. Bengsch B, et al. Immunity. 2015 Feb 17;42(2):203-205. doi: 10.1016/j.immuni.2015.01.023. Immunity. 2015. PMID: 25692694 - Transcription Factor IRF4 Promotes CD8+ T Cell Exhaustion and Limits the Development of Memory-like T Cells during Chronic Infection.
Man K, Gabriel SS, Liao Y, Gloury R, Preston S, Henstridge DC, Pellegrini M, Zehn D, Berberich-Siebelt F, Febbraio MA, Shi W, Kallies A. Man K, et al. Immunity. 2017 Dec 19;47(6):1129-1141.e5. doi: 10.1016/j.immuni.2017.11.021. Epub 2017 Dec 12. Immunity. 2017. PMID: 29246443 - A CD8 T cell-intrinsic role for the calcineurin-NFAT pathway for tolerance induction in vivo.
Fehr T, Lucas CL, Kurtz J, Onoe T, Zhao G, Hogan T, Vallot C, Rao A, Sykes M. Fehr T, et al. Blood. 2010 Feb 11;115(6):1280-7. doi: 10.1182/blood-2009-07-230680. Epub 2009 Dec 10. Blood. 2010. PMID: 20007805 Free PMC article. - Regulation of the activity of the transcription factors AP-1 and NFAT during differentiation of precursor CD4+ T-cells into effector cells.
Rincón M, Flavell RA. Rincón M, et al. Biochem Soc Trans. 1997 May;25(2):347-54. doi: 10.1042/bst0250347. Biochem Soc Trans. 1997. PMID: 9191115 Review. No abstract available. - Calcium-NFAT transcriptional signalling in T cell activation and T cell exhaustion.
Hogan PG. Hogan PG. Cell Calcium. 2017 May;63:66-69. doi: 10.1016/j.ceca.2017.01.014. Epub 2017 Jan 28. Cell Calcium. 2017. PMID: 28153342 Free PMC article. Review.
Cited by
- CIMT 2022: Report on the 19th Annual Meeting of the Association for Cancer Immunotherapy.
Berger PA, Freitag J, Linkenbach SC, Merz L, Schork M, Thevissen S, Yildiz I, Beck JD. Berger PA, et al. Hum Vaccin Immunother. 2022 Nov 30;18(6):2124785. doi: 10.1080/21645515.2022.2124785. Epub 2022 Oct 12. Hum Vaccin Immunother. 2022. PMID: 36222759 Free PMC article. - Feeding an army: The metabolism of T cells in activation, anergy, and exhaustion.
Delgoffe GM, Powell JD. Delgoffe GM, et al. Mol Immunol. 2015 Dec;68(2 Pt C):492-6. doi: 10.1016/j.molimm.2015.07.026. Mol Immunol. 2015. PMID: 26256793 Free PMC article. Review. - NFAT2 overexpression suppresses the malignancy of hepatocellular carcinoma through inducing Egr2 expression.
Wang J, Zhang Y, Liu L, Cui Z, Shi R, Hou J, Liu Z, Yang L, Wang L, Li Y. Wang J, et al. BMC Cancer. 2020 Oct 6;20(1):966. doi: 10.1186/s12885-020-07474-0. BMC Cancer. 2020. PMID: 33023539 Free PMC article. - Engineering inducible biomolecular assemblies for genome imaging and manipulation in living cells.
Peng Q, Huang Z, Sun K, Liu Y, Yoon CW, Harrison RES, Schmitt DL, Zhu L, Wu Y, Tasan I, Zhao H, Zhang J, Zhong S, Chien S, Wang Y. Peng Q, et al. Nat Commun. 2022 Dec 24;13(1):7933. doi: 10.1038/s41467-022-35504-x. Nat Commun. 2022. PMID: 36566209 Free PMC article. - Massively parallel single-cell chromatin landscapes of human immune cell development and intratumoral T cell exhaustion.
Satpathy AT, Granja JM, Yost KE, Qi Y, Meschi F, McDermott GP, Olsen BN, Mumbach MR, Pierce SE, Corces MR, Shah P, Bell JC, Jhutty D, Nemec CM, Wang J, Wang L, Yin Y, Giresi PG, Chang ALS, Zheng GXY, Greenleaf WJ, Chang HY. Satpathy AT, et al. Nat Biotechnol. 2019 Aug;37(8):925-936. doi: 10.1038/s41587-019-0206-z. Epub 2019 Aug 2. Nat Biotechnol. 2019. PMID: 31375813 Free PMC article.
References
- Barber DL, Wherry EJ, Masopust D, Zhu B, Allison JP, Sharpe AH, Freeman GJ, Ahmed R. Restoring function in exhausted CD8 T cells during chronic viral infection. Nature. 2006;439:682–687. - PubMed
Publication types
MeSH terms
Substances
Grants and funding
- U19 AI109976/AI/NIAID NIH HHS/United States
- R01CA150975/CA/NCI NIH HHS/United States
- R01 AI109842/AI/NIAID NIH HHS/United States
- U19 CA179563/CA/NCI NIH HHS/United States
- R01 AI072543/AI/NIAID NIH HHS/United States
- R01CA42471/CA/NCI NIH HHS/United States
- R01 AI040127/AI/NIAID NIH HHS/United States
- S10 RR027366/RR/NCRR NIH HHS/United States
- P30 DK043351/DK/NIDDK NIH HHS/United States
- AI84167/AI/NIAID NIH HHS/United States
- R01 CA042471/CA/NCI NIH HHS/United States
- R01 CA150975/CA/NCI NIH HHS/United States
- R01 AI084167/AI/NIAID NIH HHS/United States
- R01 AI095634/AI/NIAID NIH HHS/United States
- R01 AI40127/AI/NIAID NIH HHS/United States
LinkOut - more resources
Full Text Sources
Other Literature Sources
Molecular Biology Databases
Research Materials


