RIM-binding protein links synaptic homeostasis to the stabilization and replenishment of high release probability vesicles - PubMed (original) (raw)
RIM-binding protein links synaptic homeostasis to the stabilization and replenishment of high release probability vesicles
Martin Müller et al. Neuron. 2015.
Erratum in
- Neuron. 2015 Jun 17;86(6):1530
Abstract
Here we define activities of RIM-binding protein (RBP) that are essential for baseline neurotransmission and presynaptic homeostatic plasticity. At baseline, rbp mutants have a ∼10-fold decrease in the apparent Ca(2+) sensitivity of release that we attribute to (1) impaired presynaptic Ca(2+) influx, (2) looser coupling of vesicles to Ca(2+) influx, and (3) limited access to the readily releasable vesicle pool (RRP). During homeostatic plasticity, RBP is necessary for the potentiation of Ca(2+) influx and the expansion of the RRP. Remarkably, rbp mutants also reveal a rate-limiting stage required for the replenishment of high release probability (p) vesicles following vesicle depletion. This rate slows ∼4-fold at baseline and nearly 7-fold during homeostatic signaling in rbp. These effects are independent of altered Ca(2+) influx and RRP size. We propose that RBP stabilizes synaptic efficacy and homeostatic plasticity through coordinated control of presynaptic Ca(2+) influx and the dynamics of a high-p vesicle pool.
Copyright © 2015 Elsevier Inc. All rights reserved.
Figures
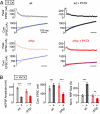
Figure 1. RIM-Binding Protein Is Required for Homeostatic Synaptic Plasticity
(A) Top: Schematic of the drbp locus indicating the approximate location of the drbpSTOP1 mutation. The 19 coding exons are represented by gray boxes ('1' denotes the first exon), and the red line refers the approximate location of the drbpS2.01 deletion. Bottom: Schematic of RBP protein structure. Boxes denote the locations of the Src homology 3 domains (SH3), and the fibronectin type 3 (FN3) domains. (B) Representative traces of EPSPs and mEPSPs for wild type in the absence and presence of PhTX (gray and black data; respectively), and drbpSTOP1 placed over the deficiency drbpS2.01 in the absence and presence of PhTX (‘_drbp_’; light red, and dark red data; respectively; 1.5mM [Ca2+]e). (C) Average mEPSP amplitudes (left), EPSP amplitudes (middle), and quantal content (EPSP/mEPSP; right) of the indicated genotypes minus PhTX (light gray/red) and plus PhTX (black, dark red). w1118 (−PhTX): n=8; w1118 (+PhTX): n=7; drbp (−PhTX): n=16; drbp (+PhTX): n=17. (D) Sample EPSCs of the indicated genotypes in the absence and presence of PhTX (‘−/+ PhTX’) at 3mM [Ca2+]e (top row) and 15mM [Ca2+]e (bottom row). (E) Relationship between mean EPSC amplitude and extracellular Ca2+ concentration in wild type (control: light gray, n=4–7 per [Ca2+]e; PhTX: dark gray, n=4–7 per [Ca2+]e), and drbp (control: light red, n=8–12 per [Ca2+]e; PhTX: dark red, n=6–12 per [Ca2+]e). The wild-type data for the two lowest [Ca2+]e were already published (Müller et al., 2012).
Figure 2. rbp Blocks the Homeostatic Enhancement of Presynaptic Ca2+ Influx
(A) Representative spatially-averaged Ca2+ transients of a wild-type control synapse and two drbp synapses in the absence (light red) and presence (dark red) of PhTX (average of 8 – 12 scans each; 1mM [Ca2+]e). (B) Bar graph (left) and cumulative frequency plot (right) of average Ca2+-transient peak amplitudes (ΔF/F) of control (ΔF/F=0.79±0.06; n=14 boutons; gray), drbp without PhTX (ΔF/F=0.61±0.06; n=20; light red), and drbp with PhTX (ΔF/F=0.55±0.04; n=24; dark red). Ca2+ transients in drbp mutants are significantly smaller than in control under baseline conditions (p=0.049), and there is no significant difference in peak amplitude between drbp in the absence and presence of PhTX (p=0.37). (C) Average baseline fluorescence (‘F’) and decay time constant (‘τ’) of the indicated genotypes and conditions.
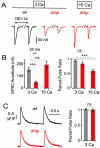
Figure 3. Increased EGTA-Sensitivity and Reduced Readily-Releasable Vesicle Pool Size after Loss of rbp
(A) Example EPSC traces of wild type and drbp mutants under control conditions, and after incubation in 25μM EGTA-AM for 10 minutes (stimulation frequency, 0.1 Hz) at 3mM [Ca2+]e (‘3 Ca’, left), or 0.45mM [Ca2+]e (‘0.45 Ca’, right). (B) Average EPSC amplitudes (left) and normalized EPSC amplitudes (right) in the absence (−) and presence (+) of EGTA at the indicated stimulation frequencies and [Ca2+]e. 3 Ca: wt (−EGTA): n=7; wt (+EGTA): n=6; drbp (−EGTA): n=8; drbp (+EGTA): n=8; 0.45 Ca: wt (−EGTA): n=8; wt (+EGTA): n=10. Note the pronounced decrease in EPSC amplitude in drbp mutants upon EGTA treatment (p=0.001 and p=0.002 at 0.1Hz and 2Hz, respectively). (C) EPSC trace (top), peak EPSC amplitudes (middle), and cumulative EPSC amplitudes (‘cum. EPSC’; bottom) evoked by 60-Hz stimulation (30 stimuli) of a wild-type synapse (left) and a drbp synapse (right) at 15 mM [Ca2+]e. The line fit to the cumulative EPSC data that was back-extrapolated to time zero is shown in blue (see Experimental Procedures). (D) Average cumulative EPSC amplitudes of wild type (black data; n=5–13 per [Ca2+]e) and drbp (red data; n=4–9 per [Ca2+]e) as a function of [Ca2+]e. Note the significant difference in cumulative EPSC amplitude between wild type and drbp at 3mM [Ca2+]e (p=0.04), and the similarity in cumulative EPSC amplitude at the highest [Ca2+]e tested (p=0.19). (E) Average paired-pulse ratio (EPSC2/EPSC1, 60-Hz stimulation, left), and 20-80% EPSC rise time (right) at 15 mM [Ca2+]e of wild type (n=6), and drbp mutants (n=9).
Figure 4. Homeostatic Modulation of Readily-Releasable Vesicle Pool Size is Absent in rbp Mutants
(A) Peak EPSC amplitudes (top), and cumulative EPSC amplitudes (‘cum. EPSC’; bottom) during 60-Hz stimulation of representative synapses of the indicated genotypes in the absence (left) and presence (right) of PhTX at 15 mM [Ca2+]e. (B) Average mEPSP amplitudes (left), cumulative EPSC amplitudes (middle), and normalized readily-releasable pool sizes (‘RRP’, right; see Experimental Procedures) of the indicated genotypes and conditions. wt (−PhTX): n=5; wt (+PhTX): n=7; drbp (−PhTX): n=9; drbp (+PhTX): n=12. PhTX application induces no significant change in cumulative EPSC amplitude in wild type (p=0.2), and a significant decrease in cumulative EPSC amplitude in drbp (p<0.001), indicating a block in the homeostatic increase in RRP size in drbp.
Figure 5. Slow Recovery From Synaptic Depression in rbp
(A) Sample EPSCs evoked by 60-Hz stimulation after a prolonged period of rest (no stimulation for at least 30s; ‘baseline’) and at inter-train intervals (‘ITI’) of 1s (middle) and 10s (right) of a wild type (top) and a drbp synapse (bottom) at 15 mM [Ca2+]e. (B) Peak amplitudes of the first EPSC of the second ‘test’ train (top) and cumulative EPSC amplitudes (bottom) as a function of ITI of a wild-type (left) and a rbp mutant synapse (right) under baseline conditions (‘− PhTX’). Average data and individual data for each synapse are shown in dark and light colors, respectively. Average data were fitted with a double-exponential function (blue). (C) Representative EPSC recovery time courses of the indicated genotypes in the presence of PhTX (‘+ PhTX’). (D) 1st EPSC: Average slow time constants (‘τslow’; left) and fast time constants (‘τfast’; right) of exponential fits to the first EPSC amplitudes of the second train (‘1st EPSC’) of the indicated genotypes at 15 mM [Ca2+]e and 3 mM [Ca2+]e. wt (15mM [Ca2+]e, n=4; 3mM [Ca2+]e, n=7), drbp (15mM [Ca2+]e, n=7) under baseline conditions. cum. EPSC: Average cumulative EPSC amplitudes of the same data set. We did not detect significant changes in the amplitudes of the slow and the fast exponential component for 1st EPSC and cumulative EPSC data between genotypes. (E) Average recovery time constants of the 1st EPSC (left) and cum. EPSC in wild type in the absence and presence of PhTX (‘−/+ PhTX’) at 3mM [Ca2+]e (n=7). There were no significant changes in recovery time constants in the absence and presence of PhTX (all p≥0.29). (F) Average recovery time constants of the 1st EPSC (left) and cum. EPSC in drbp in the absence and presence of PhTX (‘−/+ PhTX’) at 15mM [Ca2+]e (n=7). Note the significant slowing of τslow upon PhTX application (left; p=0.037).
Figure 6. Unaltered Presynaptic Ca2+ Signaling During Recovery in rbp, and Normal Recovery From Synaptic Depression in rim
(A) Single AP-evoked spatially-averaged Ca2+ transients of a wild-type and a drbp synapse before (‘baseline’, left) and 5s after 60-Hz stimulations (30 stimuli, ‘5s post 60 Hz’, right) (average of 4–9 scans each; 3mM [Ca2+]e). (B) Average Ca2+-transient peak amplitude (ΔF/F) and baseline fluorescence (‘F’) before (‘Base’) and after (‘Post’) 60-Hz stimulation of control (F (base) =380±55 a.u., F (post) =445±77 a.u., n=5, p=0.46; ΔF/F (base) =1.08±0.18, ΔF/F (post) =0.88±0.15, p=0.38, gray data), and drbp (F (base) =290±51 a.u., F (post) =320±52 a.u., n=10, p=0.66; ΔF/F (base) =1.29±0.12, ΔF/F (post) =1.09±0.12, p=0.25, red data). Note that there is no significant difference in the relative decrease in ΔF/F following 60-Hz stimulation between wild type (82±4% of control) and drbp (84±3% of control; p=0.58). (C) Peak amplitudes of the first EPSC of 60-Hz ‘test’ trains normalized to the first EPSC of 60-Hz ‘depleting’ trains applied at various inter-train intervals of a rim103 mutant synapse (30 stimuli per train). Data were fitted with a double-exponential function (blue). (D) Average recovery of 1st EPSC amplitude following 60-Hz stimulation at the indicated ITIs of wild type (n=6), rim103 (n=6), and drbp (n=6). Note that EPSC recovery from depression in drbp is significantly slower than in rim or wild type (p<0.002 at all intervals).
Figure 7. Slow Recovery From Synaptic Depression after Single-AP Stimulation in rbp
(A) Representative EPSCs in response to paired-pulse stimulation at an inter-stimulus interval (ISI) of 1s of the indicated genotypes and [Ca2+]e. (B) Average first EPSC amplitudes (left) and paired-pulse ratio (EPSC2/EPSC1, right) of wt (3 Ca: n=8), drbp (3 Ca: n=8; 15 Ca: n=5). Note the similar first EPSC amplitudes (p=0.21), and the significant difference in paired-pulse ratio (p<0.001) between drbp at 15 Ca and wild type at 3 Ca. (C) Left: Example spatially-averaged Ca2+ transients of wild type and a drbp induced by paired-pulse stimulation at an interval of 1s (average of 7–10 scans each; 3mM [Ca2+]e). Right: Average Ca2+-transient amplitude paired-pulse ratio (ΔF/F2/(ΔF/F1)) of wild type (n=11) and a drbp (n=12). Note that we did not detect significant differences in baseline ΔF/F (wild type: 1.29 ± 0.11; drbp: 1.37 ± 0.0; p=0.52), and baseline fluorescence (p=0.99) at this [Ca2+]e (see also Figure 6B).
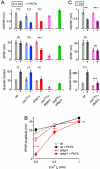
Figure 8. Genetic Interaction between drbp and rim during Baseline Synaptic Transmission
(A) Average data for mEPSP amplitude (top), EPSP amplitude (middle) and quantal content (bottom) in the absence (−) and presence (+) of PhTX for the genotypes indicated at the bottom (0.4 mM [Ca2+]e). wt (−PhTX): n=6; wt (+PhTX): n=6; rim103/+ (−PhTX): n=7; rim103/+ (+PhTX): n=5; drbp/+ (−PhTX): n=10; drbp/+ (+PhTX): n=19; rim103/drbp (−PhTX): n=12; brp69/+;drbp/+ (−PhTX): n=10. (B) Average EPSP amplitudes in the absence and presence of PhTX as a function of [Ca2+]e of the indicated genotypes (0.2mM [Ca2+]e: wt (−PhTX): n=8; wt (+PhTX): n=8; drbp/+ (−PhTX): n=16; drbp/+ (+PhTX): n=16; 1mM [Ca2+]e: wt (−PhTX): n=6; wt (+PhTX): n=6; drbp/+ (−PhTX): n=12; drbp/+ (+PhTX): n=12; 0.4mM [Ca2+]e as in (A)). Note the significant decrease in EPSP amplitude in drbp/+ following PhTX treatment at the two lowest [Ca2+]e with respect to baseline conditions (all p<0.001), and the decrease in EPSP amplitude in drbp/+ in the absence of PhTX at 0.2mM [Ca2+]e compared to wild type (p=0.019). (C) Average data for mEPSP amplitude (top), EPSP amplitude (middle) and quantal content (bottom) in the absence (−) and presence (+) of PhTX for the genotypes at 1mM [Ca2+]e (rim103/drbp (−PhTX): n=12; rim103/drbp (+PhTX): n=12; n for wild type are given in (B)).
Figure 9. Model for RBP's Role in Homeostatic Plasticity and Vesicle Resupply
Our data suggest that RBP (green), which is located in close proximity to voltage-gated Ca2+ channels (‘Ca Ch’, blue) (Liu et al., 2011), is necessary for both, the homeostatic enhancement of presynaptic Ca2+ influx (‘1. RBP’) and for the homeostatic increase in the number of release-ready vesicles (‘2. RBP’). Under baseline conditions, RBP is required for ‘tight coupling’ between vesicles and Ca2+ channels (note the increased distance between vesicle and Ca2+ channel in rbp), normal levels of presynaptic Ca2+ influx (decreased Ca2+ domain size in rbp) (Liu et al., 2011), and for the rapid resupply of ‘fast’ release-ready vesicles (green arrow).
Similar articles
- α2δ-3 Is Required for Rapid Transsynaptic Homeostatic Signaling.
Wang T, Jones RT, Whippen JM, Davis GW. Wang T, et al. Cell Rep. 2016 Sep 13;16(11):2875-2888. doi: 10.1016/j.celrep.2016.08.030. Cell Rep. 2016. PMID: 27626659 Free PMC article. - RIM controls homeostatic plasticity through modulation of the readily-releasable vesicle pool.
Müller M, Liu KS, Sigrist SJ, Davis GW. Müller M, et al. J Neurosci. 2012 Nov 21;32(47):16574-85. doi: 10.1523/JNEUROSCI.0981-12.2012. J Neurosci. 2012. PMID: 23175813 Free PMC article. - Dysbindin links presynaptic proteasome function to homeostatic recruitment of low release probability vesicles.
Wentzel C, Delvendahl I, Sydlik S, Georgiev O, Müller M. Wentzel C, et al. Nat Commun. 2018 Jan 18;9(1):267. doi: 10.1038/s41467-017-02494-0. Nat Commun. 2018. PMID: 29348419 Free PMC article. - Activity-dependent regulation of synaptic vesicle exocytosis and presynaptic short-term plasticity.
Mochida S. Mochida S. Neurosci Res. 2011 May;70(1):16-23. doi: 10.1016/j.neures.2011.03.005. Epub 2011 Mar 29. Neurosci Res. 2011. PMID: 21453732 Review. - Two synaptic vesicle pools, vesicle recruitment and replenishment of pools at the Drosophila neuromuscular junction.
Kuromi H, Kidokoro Y. Kuromi H, et al. J Neurocytol. 2003 Jun-Sep;32(5-8):551-65. doi: 10.1023/B:NEUR.0000020610.13554.3c. J Neurocytol. 2003. PMID: 15034253 Review.
Cited by
- α2δ-3 Is Required for Rapid Transsynaptic Homeostatic Signaling.
Wang T, Jones RT, Whippen JM, Davis GW. Wang T, et al. Cell Rep. 2016 Sep 13;16(11):2875-2888. doi: 10.1016/j.celrep.2016.08.030. Cell Rep. 2016. PMID: 27626659 Free PMC article. - Molecular mechanisms that stabilize short term synaptic plasticity during presynaptic homeostatic plasticity.
Ortega JM, Genç Ö, Davis GW. Ortega JM, et al. Elife. 2018 Nov 13;7:e40385. doi: 10.7554/eLife.40385. Elife. 2018. PMID: 30422113 Free PMC article. - RIMB-1/RIM-Binding Protein and UNC-10/RIM Redundantly Regulate Presynaptic Localization of the Voltage-Gated Calcium Channel in Caenorhabditis elegans.
Kushibiki Y, Suzuki T, Jin Y, Taru H. Kushibiki Y, et al. J Neurosci. 2019 Oct 30;39(44):8617-8631. doi: 10.1523/JNEUROSCI.0506-19.2019. Epub 2019 Sep 17. J Neurosci. 2019. PMID: 31530643 Free PMC article. - Molecular Interface of Neuronal Innate Immunity, Synaptic Vesicle Stabilization, and Presynaptic Homeostatic Plasticity.
Harris N, Fetter RD, Brasier DJ, Tong A, Davis GW. Harris N, et al. Neuron. 2018 Dec 5;100(5):1163-1179.e4. doi: 10.1016/j.neuron.2018.09.048. Epub 2018 Oct 18. Neuron. 2018. PMID: 30344041 Free PMC article. - Mechanisms of Synaptic Vesicle Exo- and Endocytosis.
Mochida S. Mochida S. Biomedicines. 2022 Jul 4;10(7):1593. doi: 10.3390/biomedicines10071593. Biomedicines. 2022. PMID: 35884898 Free PMC article. Review.
References
- Burrone J, O'Byrne M, Murthy VN. Multiple forms of synaptic plasticity triggered by selective suppression of activity in individual neurons. Nature. 2002;420:414–418. - PubMed
- Davis GW, Goodman CS. Synapse-specific control of synaptic efficacy at the terminals of a single neuron. Nature. 1998;392:82–86. - PubMed
- Davis GW. Homeostatic control of neural activity: from phenomenology to molecular design. Annu. Rev. Neurosci. 2006;29:307–323. - PubMed
Publication types
MeSH terms
Substances
LinkOut - more resources
Full Text Sources
Other Literature Sources
Molecular Biology Databases
Miscellaneous


