Differential DNA mismatch repair underlies mutation rate variation across the human genome - PubMed (original) (raw)
Differential DNA mismatch repair underlies mutation rate variation across the human genome
Fran Supek et al. Nature. 2015.
Abstract
Cancer genome sequencing has revealed considerable variation in somatic mutation rates across the human genome, with mutation rates elevated in heterochromatic late replicating regions and reduced in early replicating euchromatin. Multiple mechanisms have been suggested to underlie this, but the actual cause is unknown. Here we identify variable DNA mismatch repair (MMR) as the basis of this variation. Analysing ∼17 million single-nucleotide variants from the genomes of 652 tumours, we show that regional autosomal mutation rates at megabase resolution are largely stable across cancer types, with differences related to changes in replication timing and gene expression. However, mutations arising after the inactivation of MMR are no longer enriched in late replicating heterochromatin relative to early replicating euchromatin. Thus, differential DNA repair and not differential mutation supply is the primary cause of the large-scale regional mutation rate variation across the human genome.
Figures
Extended Data Figure 1
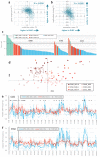
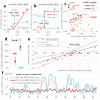
Overall mutational burden and megabase-scale regional rate variability in tumour samples of MSI-prone cancer types. a, b, Correlations of tissue specificity (TS, see Methods) in regional mutation rates of diffuse large B-cell lymphoma (DLBC) with TS of gene expression in DLBC (a), or with TS of replication timing in the Gm12878 lymphoblastoid cell line (b). c, Overall mutational load, as SNVs per Mb of alignable genomic DNA (Methods) for MSI-H, MSS (includes MSI-L), polymerase ε (PolE) mutant tumours, or otherwise hypermutated tumour samples. d, Principal components plot with PCs 3 and 4, as in Fig. 1e, but showing only tumour samples for colorectal (CRAD), uterine (UCEC) and stomach (STAD) cancers for visual emphasis. e, f, Relative SNV frequencies across 1Mb windows of chromosome 1p in UCEC and STAD. Full/dotted lines are the median across tumour samples and its 95% C.I. For each tumour sample, relative mutation frequencies are always obtained by dividing by the mean of all 1Mb windows. MSI/PolE samples are in the MSI-H group; hyper/ultramutators are not in the MSS group. * FDR≤10% for rates significantly closer to unity in MSI-H samples (Mann-Whitney test; not applicable to STAD because of too few MSI-H samples).
Extended Data Figure 2
Reduced correlation of regional mutation rates to gene expression, heterochromatin and replication timing in genomes and exomes of MSI tumours. a, b, c, The 1Mb windows in the genome were pooled into five equal-frequency bins by the average gene expression levels (log2 TPM) in each window. The median and interquartile range of relative mutation rates across 1Mb windows is shown for each bin. R2 always determined on original (not binned) data. * P<0.01 for difference of R after Fisher Z-transform. Gene expression levels are medians over RnaSeq TPM across 15 cancer types. Relative SNV frequencies of each tumour sample were obtained by normalizing by the average SNV density of all genomic 1 Mb windows of that sample. Prior to binning the windows, cancer samples in a group were combined by taking the median of the relative mutation frequencies in for each 1Mb window, as illustrated for CRAD in Fig. 2d. PolE/MSI samples are in the MSI group; ultramutators are not in the MSS group. MSI-L samples are pooled with MSS. d, e, f, Same, but for five heterochromatin bins (median H3K9me3 signal over 8 tissues and cell lines). g, h, i, Regional mutation rates in exome sequences of a broader set of 195 MSI-H tumour samples. The 1709 genomic 1 Mb windows with at least 5 kb alignable protein-coding DNA each were grouped into five equal-frequency bins by the median RepliSeq signal over 11 cell lines (Methods). Mutations were pooled across all samples in one cancer type with a known MSI-H or MSS status (Methods). a is the slope of the regression line fit to binned data. j, Slopes a determined for individual cancer exomes with a sufficient number of mutations (≥50 SNVs). Number of samples n shown below each group. For all cancer types, MSI-H samples have significantly less negative slopes than MSS (P<0.01, Mann-Whitney test, one tailed). MSI-H also includes the MSI-H/PolE mutant samples, and MSS includes the MSI-L samples. In the exome analyses, ultramutators were not considered separately.
Extended Data Figure 3
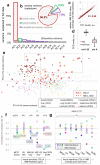
Association of mutational signatures to microsatellite instability and to replication timing. Related to Figure 3. a, Relative frequencies of the 96 mutation contexts (strand-symmetric) in MSI versus MSS cancers; the MSS group includes MSI-L samples but not MSS/PolE ultramutators. Mutations were pooled across samples of MSI-prone tissues (CRAD, UCEC and STAD). b, c, Similar to Fig. 3a and 3b, showing two additional examples of mutational contexts with different MSI propensities and their relative mutation rates across across five genomic replication timing bins. d, Lack of correlation between the MSI propensity of a mutational context to its replication timing slope in MSS tumours samples (compare to Fig. 3c, which shows slopes in MSI samples). Tv, transversion. Ts, transition. e, f, Association of % MSI-specific signatures (cCn>A + gCn>T + [c/t]An>G) across cancer samples and the binned replication timing slopes for two non-MSI Ts signatures in same samples. Slopes averaged over contexts displayed in each plot. In all panels except a, mutation rates were normalized to number of nucleotides-at-risk in a 1Mb window prior to determining the replication timing slopes.
Extended Data Figure 4
The deconvolution of MSI mutational spectra robustly converges onto two equivalent solutions. Related to Figure 4. a, Agreement of the observed relative frequencies of mutational contexts in each tumour sample with the predictions of model 1 (having median a, b and z coefficients across all solutions in cluster 1). b, Sets of best-fit solutions determined in a hundred optimization runs initialized with different starting conditions. The solutions cluster into two homogeneous clusters (Pearson R>0.9 between >90% of the solutions within a cluster, in UPGMA clustering). c, d, Solutions within both clusters have similar fit to observed data (c) and make extremely similar predictions for mutation spectra in tumour samples (d). e-h, Example mutation accumulation diagrams for two mutation contexts typical of MSI tumours, shown for a MSI tumour (e,g) and for a MSS tumour (f,h). i, j, Values of the parameters in two solution clusters, with medians and interquartile ranges (shown as whiskers). Each solution encompasses 104 parameters: relative mutation rates a and b for each of 28 mutational contexts (i), and the relative pre-MMR failure time z for each tumour sample of the 24 MSI and 24 MSS samples (j).
Figure 1
Changes in megabase-scale regional mutation rate variation between tumour samples. a-e, Principal components (PC) analysis of the 1Mb regional rates of 652 whole-genome sequences. a, Amount of variance conveyed by the prominent PCs. Baseline estimated by ‘broken stick’ method (Methods). b, Same, expressed as % above-baseline (putatively non-noise) variance. c, First PC reflects average rates. d, Second PC captures the variability in chromosome X mutation rates. e, Tumour sample loadings on PCs 3/4, highlighting cancer types significantly shifted by PC3 (Mann-Whitney test, FDR<1%), as well as STAD and UCEC. Dashed box denotes outlying samples. f, Pearson correlations of the tissue specificities (TS; Methods) of RepliSeq signal in cell lines to TS of 1Mb mutation rates in cancer types with significant PC3 shifts. q is significance of the difference of the matching vs. non-matching cancer type (Z-test, FDR corrected). g, Same, for TS of gene expression in tumour samples.
Figure 2
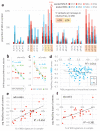
Reduced regional mutation rate variability in genomes of MSI cancer samples. a, b, c, Decreased variance between mutation rates of 1Mb windows in MSI samples, when compared to MSS samples (incl. MSI-L) or to ultramutated PolE/MSS samples. MSI/PolE samples are in the MSI group. In the case of STAD, comparison to PolE w.t. hypermutators. Data points in distributions are medians of relative mutation frequencies of each 1Mb window across all cancer samples in group. ** _P_≤0.01 by F-test for decrease in variance. d, Relative SNV frequencies across 1Mb windows of chromosome 1p in CRAD. Full/dotted lines are the median across tumour samples and its 95% C.I. For each tumour sample, relative mutation frequencies are obtained by dividing by the mean of all 1Mb windows. * FDR≤10% for rates significantly closer to unity in MSI-H samples (Mann-Whitney test). Striped bars are low alignability regions (Methods). e, f, g, Reduced correlation of regional mutation rates to replication timing in MSI cancer samples. Genomic 1Mb windows were pooled into five equal-frequency bins by the median RepliSeq signal over 11 cell lines. For each bin, median and interquartile range of relative mutation rates across 1Mb windows is shown. R2 on original (not binned) data. * P<0.01 for difference of R, after Fisher Z-transform. Prior to binning, cancer samples in a group were combined by taking the median of the relative mutation frequencies in each 1Mb window (as shown in d). h, i, Same, examined separately for genic (intronic) and intergenic regions. a is the slope of the regression line fit to binned data.
Figure 3
Association of mutational signatures to MSI and to replication timing. a, b, Relative mutation rates of example MSI-associated (a) or non-MSI-associated (b) contexts across genomic replication timing bins. Dotted lines are linear fits to the bins with slope a, a measure of association to replication timing. c, Association between MSI propensity of a mutational context (log2 ratio of its frequency in MSI vs. MSS tumours) to its replication timing slope in MSI tumours. Tv, transversion. Ts, transition. d, e, Association of % MSI-specific signatures (cCn>A + gCn>T + [c/t]An>G) in a MSI tumour sample and the binned replication timing slopes for all contexts (d), or for various non-MSI transversions (e) in the same tumour sample. Slopes averaged over contexts displayed in d, e. In all panels, mutation rates were normalized to number of nucleotides at risk in a 1Mb window prior to determining the slopes. See also Extended Data Figure 3.
Figure 4
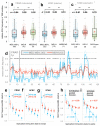
Inferring the time of MMR failure by a deconvolution of the mutational signatures. a, b, Examples illustrating the parameters estimated: relative mutation rates in the MSS (a) or MSI states (b), different for mutational contexts but constant across samples, and the relative time spent in MSS (z) or MSI (1-z) which can vary across samples. c, The estimated proportion of MSI mutations for the MSI vs. a set of MSS samples. P value by Mann-Whitney test, two-tailed. d, Estimated rates for mutational contexts. Significance given for increase of b over a in the eight MSI contexts (Wilcoxon test). Contexts with different 3′ flanking nucleotides were pooled, except the C>T in n
C
g contexts; other C>T changes are labelled n
C
h. Ts, transitions. Tv, transversions. e, Estimated # mutations arriving post-MMR failure correlates to the loss of variability in regional mutation rates (slope of the relative rates across replication timing bins, see Fig. 2 and 3) across the MSI samples. The 99% C.I. of the fitted line crosses zero at <100% mutations post-MSI, indicating (P<0.01) that the mutation rate landscape in MMR-deficient cells does not show replication timing-associated regional variability. f, Relative mutation rates of chromosome 13 for the median of five samples with largest % of post-MMR failure mutations (rightmost in e) vs. five MSI samples with least % post-MMR failure mutations (leftmost in e). Both groups consist of 2 CRAD, 2 UCEC and 1 STAD.
Similar articles
- Differential DNA repair underlies mutation hotspots at active promoters in cancer genomes.
Perera D, Poulos RC, Shah A, Beck D, Pimanda JE, Wong JW. Perera D, et al. Nature. 2016 Apr 14;532(7598):259-63. doi: 10.1038/nature17437. Nature. 2016. PMID: 27075100 - Chromatin organization is a major influence on regional mutation rates in human cancer cells.
Schuster-Böckler B, Lehner B. Schuster-Böckler B, et al. Nature. 2012 Aug 23;488(7412):504-7. doi: 10.1038/nature11273. Nature. 2012. PMID: 22820252 - Transcription restores DNA repair to heterochromatin, determining regional mutation rates in cancer genomes.
Zheng CL, Wang NJ, Chung J, Moslehi H, Sanborn JZ, Hur JS, Collisson EA, Vemula SS, Naujokas A, Chiotti KE, Cheng JB, Fassihi H, Blumberg AJ, Bailey CV, Fudem GM, Mihm FG, Cunningham BB, Neuhaus IM, Liao W, Oh DH, Cleaver JE, LeBoit PE, Costello JF, Lehmann AR, Gray JW, Spellman PT, Arron ST, Huh N, Purdom E, Cho RJ. Zheng CL, et al. Cell Rep. 2014 Nov 20;9(4):1228-34. doi: 10.1016/j.celrep.2014.10.031. Epub 2014 Nov 20. Cell Rep. 2014. PMID: 25456125 Free PMC article. - Scales and mechanisms of somatic mutation rate variation across the human genome.
Supek F, Lehner B. Supek F, et al. DNA Repair (Amst). 2019 Sep;81:102647. doi: 10.1016/j.dnarep.2019.102647. Epub 2019 Jul 8. DNA Repair (Amst). 2019. PMID: 31307927 Review. - Stability across the Whole Nuclear Genome in the Presence and Absence of DNA Mismatch Repair.
Lujan SA, Kunkel TA. Lujan SA, et al. Cells. 2021 May 17;10(5):1224. doi: 10.3390/cells10051224. Cells. 2021. PMID: 34067668 Free PMC article. Review.
Cited by
- Identification of a signature of evolutionarily conserved stress-induced mutagenesis in cancer.
Cisneros LH, Vaske C, Bussey KJ. Cisneros LH, et al. Front Genet. 2022 Sep 6;13:932763. doi: 10.3389/fgene.2022.932763. eCollection 2022. Front Genet. 2022. PMID: 36147501 Free PMC article. - Cell cycle gene alterations associate with a redistribution of mutation risk across chromosomal domains in human cancers.
Salvadores M, Supek F. Salvadores M, et al. Nat Cancer. 2024 Feb;5(2):330-346. doi: 10.1038/s43018-023-00707-8. Epub 2024 Jan 10. Nat Cancer. 2024. PMID: 38200245 - Sexual Difference Matters: Females with High Microsatellite Instability Show Increased Survival after Neoadjuvant Chemotherapy in Gastric Cancer.
Kohlruss M, Ott K, Grosser B, Jesinghaus M, Slotta-Huspenina J, Novotny A, Hapfelmeier A, Schmidt T, Gaida MM, Weichert W, Keller G. Kohlruss M, et al. Cancers (Basel). 2021 Mar 2;13(5):1048. doi: 10.3390/cancers13051048. Cancers (Basel). 2021. PMID: 33801374 Free PMC article. - Preferential Protection of Genetic Fidelity within Open Chromatin by the Mismatch Repair Machinery.
Sun L, Zhang Y, Zhang Z, Zheng Y, Du L, Zhu B. Sun L, et al. J Biol Chem. 2016 Aug 19;291(34):17692-705. doi: 10.1074/jbc.M116.719971. Epub 2016 Jul 5. J Biol Chem. 2016. PMID: 27382058 Free PMC article. - Mutational signature distribution varies with DNA replication timing and strand asymmetry.
Tomkova M, Tomek J, Kriaucionis S, Schuster-Böckler B. Tomkova M, et al. Genome Biol. 2018 Sep 10;19(1):129. doi: 10.1186/s13059-018-1509-y. Genome Biol. 2018. PMID: 30201020 Free PMC article.
References
- Hodgkinson A, Chen Y, Eyre-Walker A. The large-scale distribution of somatic mutations in cancer genomes. Hum. Mutat. 2012 doi:10.1002/humu.21616. - PubMed
- Schuster-Bockler B, Lehner B. Chromatin organization is a major influence on regional mutation rates in human cancer cells. Nature. 2012;488:504–507. - PubMed
- Woo YH, Li W-H. DNA replication timing and selection shape the landscape of nucleotide variation in cancer genomes. Nat. Commun. 2012;3:1004. - PubMed
Methods’ references
- Saunders CT, et al. Strelka: accurate somatic small-variant calling from sequenced tumor–normal sample pairs. Bioinformatics. 2012;28:1811–1817. - PubMed
Publication types
MeSH terms
LinkOut - more resources
Full Text Sources
Other Literature Sources
