The small molecule ISRIB reverses the effects of eIF2α phosphorylation on translation and stress granule assembly - PubMed (original) (raw)
The small molecule ISRIB reverses the effects of eIF2α phosphorylation on translation and stress granule assembly
Carmela Sidrauski et al. Elife. 2015.
Abstract
Previously, we identified ISRIB as a potent inhibitor of the integrated stress response (ISR) and showed that ISRIB makes cells resistant to the effects of eIF2α phosphorylation and enhances long-term memory in rodents (Sidrauski et al., 2013). Here, we show by genome-wide in vivo ribosome profiling that translation of a restricted subset of mRNAs is induced upon ISR activation. ISRIB substantially reversed the translational effects elicited by phosphorylation of eIF2α and induced no major changes in translation or mRNA levels in unstressed cells. eIF2α phosphorylation-induced stress granule (SG) formation was blocked by ISRIB. Strikingly, ISRIB addition to stressed cells with pre-formed SGs induced their rapid disassembly, liberating mRNAs into the actively translating pool. Restoration of mRNA translation and modulation of SG dynamics may be an effective treatment of neurodegenerative diseases characterized by eIF2α phosphorylation, SG formation, and cognitive loss.
Keywords: ISRIB; cell biology; eIF2; human; integrated stress response; mouse; neuroscience; protein synthesis; ribosome profiling; unfolded protein response.
Conflict of interest statement
The authors declare that no competing interests exist.
Figures
Figure 1.. Translational regulation upon ER stress in mammalian cells.
(A) Translational and mRNA changes in HEK293T cells upon ER stress. HEK293T cells were treated with or without 1 μg/ml of Tm for 1 hr. The y-axis represents fold changes in ribosome-protected fragments (Ribo-Seq) between Tm-treated and control samples. The x-axis represents fold changes in mRNA levels (mRNA-Seq) between Tm-treated and control samples. Data points reflecting significant changes (FDR-corrected p-value < 0.1) between Tm treated and untreated (‘UT’) samples are shown in black and non-significant changes are shown in light grey. Note that genes with significant changes (black circles) are numerous in Tm-treated cells and thus the cloud of genes with no significant changes (grey circles) is mostly hidden in the background. Genes with substantially enhanced RFPs and uORFs that are known to be phospho-eIF2α-dependently regulated are labeled pink. ISR-translational targets that contain previously identified uORFs are labeled in green. Triangles denote genes that fall beyond the axis range. The genes inside the grey box are those that change less than twofold in RPF or mRNA reads. Figure 1—source data 2A contains a list of all genes that change more than twofold in RPFs during Tm induction (FDR-corrected p-value < 0.1, corresponding to black circles above and below the box). (B) Translational and mRNA changes in cells co-treated with Tm and ISRIB. HEK293T cells were treated with or without 1 μg/ml of Tm and 200 nM ISRIB for 1 hr. The y-axis represents fold changes in ribosome-protected fragments (Ribo-Seq) between Tm + ISRIB-treated and control samples. The x-axis represents fold changes in mRNA levels (mRNA-Seq) between Tm + ISRIB-treated and control samples. Genes that significantly change when ISRIB co-administration modulates the effects of Tm treatment are shown in black (FDR-corrected p-value < 0.1). Figure 1—source data 2C contains a list of all genes that change more than twofold in RPFs during Tm and ISRIB treatment (FDR-corrected p-value < 0.1). The identity of the ISR-translational targets that contain previously identified uORFs (labeled in green) was not included in this panel as they all collapsed to the center of the plot. (C) Translational and mRNA changes in ISRIB-treated cells. HEK293T cells were treated with or without 200 nM ISRIB for 1 hr. The y-axis represents fold changes in ribosome-protected fragments (Ribo-Seq) between ISRIB-treated and control samples. The x-axis represents fold changes in mRNA levels (mRNA-Seq) between ISRIB-treated and control samples. Data points reflecting significant changes (FDR-corrected p-value < 0.1) between ISRIB-treated and untreated (‘UT’) samples are shown in black and non-significant changes are shown in light grey. Figure 1—source data 2D contains a list of all genes that change more than twofold in RPFs during ISRIB treatment (FDR-corrected p-value < 0.1, corresponding to black circles outside of the box). ATF4 and SLC35A4 (labeled in this panel) showed reduced translational efficiency upon addition of ISRIB. Two biological replicates were analyzed per condition. Number of reads aligned to the genome and ORFs for all samples are found in Figure 1—source data 2E. Correlation plots for the replicates for each condition are found in Figure 1—figure supplement 3. mRNA abundance for all ORFs mapped are found in Figure 1—figure supplement 4. Read counts for all conditions and each individual transcript are found in Figure 1—source data 1. The Ribo-seq and mRNA-seq data have been deposited in NCBI's Gene Expression Omnibus and are accessible through GEO series accession number GSE65778. DOI:
http://dx.doi.org/10.7554/eLife.05033.002
Figure 1—figure supplement 1.. Ribosome and mRNA densities in the 5’UTR of ATF4 and SLC35A4.
mRNA reads (y-axis) are represented along the sequence of each gene (x-axis) in the upper panel. Ribosome footprint (ribo) reads (y-axis) are represented along the sequence of each gene (x-axis) in the lower panel. The known and predicted uORFs are indicated along the sequence in green. The ORF is indicated along the sequence in blue. DOI:
http://dx.doi.org/10.7554/eLife.05033.005
Figure 1—figure supplement 2.. Translational regulation of mTOR targets upon ER-stress.
(A) Cells were treated with or without 1 μg/ml of Tm for 1 hr. The y-axis represents fold changes in ribosome-protected fragments (Ribo-Seq) between Tm-treated and control samples. The x-axis represents fold changes in mRNA levels (mRNA-Seq) between Tm-treated and control samples. Only mTOR translational targets are plotted (colored light green). Significant changes in mTOR genes (FDR-corrected p-value < 0.1) between Tm-treated and untreated (UT) are highlighted in black. (B) Cells were treated with or without 1 μg/ml of Tm and 200 nM ISRIB for 1 hr. The y-axis represents fold changes in ribosome-protected fragments (Ribo-Seq) between Tm + ISRIB-treated and control samples. The x-axis represents fold changes in mRNA levels (mRNA-Seq) between Tm + ISRIB-treated and control samples. Only mTOR translational targets are plotted (colored light green). Genes that significantly change when ISRIB co-administration modulates the effects of Tm treatment are shown in black (FDR-corrected p-value < 0.1). (C) Cells were treated with or without 200 nM ISRIB for 1 hr. The y-axis represents fold changes in ribosome-protected fragments (Ribo-Seq) between ISRIB-treated and control samples. The x-axis represents fold changes in mRNA levels (mRNA-Seq) between ISRIB-treated and control samples. Only mTOR translational targets are plotted (colored light green). Significant changes in mTOR genes (FDR-corrected p-value < 0.1) between ISRIB-treated and untreated (UT) are highlighted in black. DOI:
http://dx.doi.org/10.7554/eLife.05033.006
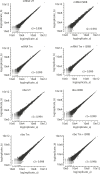
Figure 1—figure supplement 3.. Correlation plots for duplicate ribosome profiling experiments.
The detected ribosome (ribo) or mRNA density is plotted for each gene in each experimental condition (untreated [UT], tunicamycin [Tm], tunicamycin + ISRIB [Tm + ISRIB] and ISRIB). Correlation coefficients (r2) between replicates (A and B) in each condition are indicated in the lower right for each panel. DOI:
http://dx.doi.org/10.7554/eLife.05033.007
Figure 1—figure supplement 4.. Mean mRNA abundance of all genes mapped.
The x-axis represents log2 (mean normalized count) for each mRNA mapped and the y-axis represents log2 fold changes in mRNA abundance in the different experimental conditions: Tm (panel A), Tm + ISRIB (panel B), and ISRIB (panel C). Previously known phospho-eIF2α-dependent ISR translational targets are highlighted in pink. DOI:
http://dx.doi.org/10.7554/eLife.05033.008
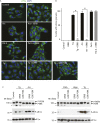
Figure 2.. ISRIB blocks stress granule formation induced by eIF2α phosphorylation.
(A) Immunofluorescence analysis (eIF3a) of U2OS cells treated with 200 nM Tg for 1 hr, 250 μM Ars for 30 min, or 100 nM Pat A for 30 min in the presence or absence of 200 nM ISRIB or 1 μM GSK797800 PERK inhibitor. A secondary Alexa Dye 488 anti-rabbit antibody was used to visualize eIF3a and DAPI was used to visualize nuclei. Representative images of at least two biological replicates are shown. (B) Quantitation of the percentage of cells containing stress granules in the different conditions described in A. Images were collected from at least two independent experiments and the number of cells with SGs or no SGs counted. The total number of cells counted for each condition was (sum of all replicates): Control (N = 81), ISRIB (N = 94), Tg (N = 122), Tg + ISRIB (N = 71), Ars (N = 85), Ars + ISRIB (N = 84), Pat A (N = 47) and Pat A + ISRIB (N = 64). No cells had SGs in Tg + PERK inh (N = 71). p-values are derived from a Student's _t_-test, *p < 0.05. (C) Immunoblot analysis of PERK, phospho eIF2α, and total eIF2α in U2OS cells treated as in A. Hippuristanol (Hipp) was used at 300 nM for 30 min. The right blot was overexposed to confirm the absence of induction of eIF2α phosphorylation upon Pat A and Hipp treatment. A representative blot of three independent experiments is shown. The asterisk (*) represents a background band or degradation product. DOI:
http://dx.doi.org/10.7554/eLife.05033.009
Figure 3.. ISRIB addition rapidly dissolves pre-formed stress granules in live cells restoring translation.
(A) Live cell imaging of stress granules in U2OS cells stably expressing G3BP-GFP (SG marker). Cells were treated with 200 nM Tg for 40 min, 250 μM Ars for 30 min, 100 nM Pat A for 30 min, or 300 nM Hipp in the presence or absence of 200 nM ISRIB. Cells were imaged using an epifluorescence microscope. Representative images of at least two biological replicates are shown. (B) Quantitation of the percentage of cells containing stress granules in the different conditions described in A. Images were collected from at least two independent experiments and the number of cells with SGs or no SGs counted. The number of cells analyzed for each condition was (sum of replicates): Control (N = 98), ISRIB (N = 81), Tg (N = 101), Tg + ISRIB (N = 84), Ars (N = 80), Ars + ISRIB (N = 55), Pat A (N = 58), Pat A + ISRIB (N = 50), Hipp (N = 41) and Hipp + ISRIB (N = 52). p-values are derived from a Student's _t_-test, *p < 0.05. (C) Stress granules were pre-formed with Tg for 40 min (as in Figure 3A) and then CHX (50 μg/ml) or ISRIB (200 nM) was added to the well, incubated for 10 min and images were collected. Representative images of at least two biological replicates are shown. (D) ISRIB quickly restores mRNA translation upon disassembly of stress granules. Cells were treated as in C with 200 nM Tg for 40 min and then DMSO, CHX (50 μg/ml), or ISRIB (200 nM) was added at the same time as [35S]-methionine. Cells were lysed after 15 min, protein was run in an SDS-PAGE gel and radioactivity was measured in each lane (N = 2, mean ± SD). (E) ISRIB quickly dissolves stress granules but does not affect P-bodies. Live cell imaging of U2OS cells stably expressing G3BP-GFP (SG marker) and Dcp1-RFP (P-body marker). Cells were treated with 200 nM Tg for 45 min followed by addition of 200 nM ISRIB at t = 0 min to the well and then imaged using spinning disk confocal microscopy. Images were collected every 30 s. The red arrows point to two representative P-bodies. Representative images of at least three biological replicates are shown. DOI:
http://dx.doi.org/10.7554/eLife.05033.010
Figure 3—figure supplement 1.. ISRIB dose response and inactive analog in stress granule assay.
(A) Live cell imaging of SGs in U2OS cells stably expressing G3BP-GFP. Cells were treated with 200 nM Tg and different doses of ISRIB (as indicated) or 2 μM of an inactive analog of ISRIB (ISRIBinact). Representative images of at least two biological replicates are shown. (B) Quantitation of the percentage of cells containing stress granules in the different conditions. The number of cells analyzed for each condition were: ISRIBinact (N = 37), 0.5 nM ISRIB (N = 81), 2 nM ISRIB (N = 91), 10 nM ISRIB (N = 43). DOI:
http://dx.doi.org/10.7554/eLife.05033.011
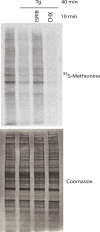
Figure 3—figure supplement 2.. Representative SDS-PAGE gel of [35S]-methionine pulse as described in Figure 3D.
Top panel is an autoradiogram and bottom panel is total protein of the same gel as shown by Coomassie staining. DOI:
http://dx.doi.org/10.7554/eLife.05033.012
Similar articles
- Small molecule ISRIB suppresses the integrated stress response within a defined window of activation.
Rabouw HH, Langereis MA, Anand AA, Visser LJ, de Groot RJ, Walter P, van Kuppeveld FJM. Rabouw HH, et al. Proc Natl Acad Sci U S A. 2019 Feb 5;116(6):2097-2102. doi: 10.1073/pnas.1815767116. Epub 2019 Jan 23. Proc Natl Acad Sci U S A. 2019. PMID: 30674674 Free PMC article. - Pharmacological brake-release of mRNA translation enhances cognitive memory.
Sidrauski C, Acosta-Alvear D, Khoutorsky A, Vedantham P, Hearn BR, Li H, Gamache K, Gallagher CM, Ang KK, Wilson C, Okreglak V, Ashkenazi A, Hann B, Nader K, Arkin MR, Renslo AR, Sonenberg N, Walter P. Sidrauski C, et al. Elife. 2013 May 28;2:e00498. doi: 10.7554/eLife.00498. Elife. 2013. PMID: 23741617 Free PMC article. - Binding of ISRIB reveals a regulatory site in the nucleotide exchange factor eIF2B.
Zyryanova AF, Weis F, Faille A, Alard AA, Crespillo-Casado A, Sekine Y, Harding HP, Allen F, Parts L, Fromont C, Fischer PM, Warren AJ, Ron D. Zyryanova AF, et al. Science. 2018 Mar 30;359(6383):1533-1536. doi: 10.1126/science.aar5129. Science. 2018. PMID: 29599245 Free PMC article. - Structural insights into ISRIB, a memory-enhancing inhibitor of the integrated stress response.
Anand AA, Walter P. Anand AA, et al. FEBS J. 2020 Jan;287(2):239-245. doi: 10.1111/febs.15073. Epub 2019 Nov 7. FEBS J. 2020. PMID: 31550413 Review. - Stress Granules and Acute Ischemic Stroke: Beyond mRNA Translation.
Aramburu-Núñez M, Custodia A, Pérez-Mato M, Iglesias-Rey R, Campos F, Castillo J, Ouro A, Romaus-Sanjurjo D, Sobrino T. Aramburu-Núñez M, et al. Int J Mol Sci. 2022 Mar 29;23(7):3747. doi: 10.3390/ijms23073747. Int J Mol Sci. 2022. PMID: 35409112 Free PMC article. Review.
Cited by
- An emerging role for the endoplasmic reticulum in stress granule biogenesis.
Nicchitta CV. Nicchitta CV. Semin Cell Dev Biol. 2024 Mar 15;156:160-166. doi: 10.1016/j.semcdb.2022.09.013. Epub 2022 Oct 4. Semin Cell Dev Biol. 2024. PMID: 36202692 Review. - Ceapins are a new class of unfolded protein response inhibitors, selectively targeting the ATF6α branch.
Gallagher CM, Garri C, Cain EL, Ang KK, Wilson CG, Chen S, Hearn BR, Jaishankar P, Aranda-Diaz A, Arkin MR, Renslo AR, Walter P. Gallagher CM, et al. Elife. 2016 Jul 20;5:e11878. doi: 10.7554/eLife.11878. Elife. 2016. PMID: 27435960 Free PMC article. - C9orf72 arginine-rich dipeptide repeats inhibit UPF1-mediated RNA decay via translational repression.
Sun Y, Eshov A, Zhou J, Isiktas AU, Guo JU. Sun Y, et al. Nat Commun. 2020 Jul 3;11(1):3354. doi: 10.1038/s41467-020-17129-0. Nat Commun. 2020. PMID: 32620797 Free PMC article. - Small molecule strategies to harness the unfolded protein response: where do we go from here?
Grandjean JMD, Wiseman RL. Grandjean JMD, et al. J Biol Chem. 2020 Nov 13;295(46):15692-15711. doi: 10.1074/jbc.REV120.010218. Epub 2020 Sep 4. J Biol Chem. 2020. PMID: 32887796 Free PMC article. Review. - Translation control of the immune checkpoint in cancer and its therapeutic targeting.
Xu Y, Poggio M, Jin HY, Shi Z, Forester CM, Wang Y, Stumpf CR, Xue L, Devericks E, So L, Nguyen HG, Griselin A, Gordan JD, Umetsu SE, Reich SH, Worland ST, Asthana S, Barna M, Webster KR, Cunningham JT, Ruggero D. Xu Y, et al. Nat Med. 2019 Feb;25(2):301-311. doi: 10.1038/s41591-018-0321-2. Epub 2019 Jan 14. Nat Med. 2019. PMID: 30643286 Free PMC article.
References
- Atkins C, Liu Q, Minthorn E, Zhang S, Figueroa DJ, Moss KG, Stanley TB, Sanders B, Goetz A, Gaul N, Choudhry AE, Alsaid H, Jucker BM, Axten JM, Kumar R. Characterization of a novel PERK kinase inhibitor with anti-tumor and anti-angiogenic activity. Cancer Research. 2013;73:1993–2002. doi: 10.1158/0008-5472.CAN-12-3109. - DOI - PubMed
- Axten JM, Medina JR, Feng Y, Shu A, Romeril SP, Grant SW, Li WH, Heerding DA, Minthorn E, Mencken T, Atkins C, Liu Q, Rabindran S, Kumar R, Hong X, Goetz A, Stanley T, Taylor JD, Sigethy SD, Tomberlin GH, Hassell AM, Kahler KM, Shewchuk LM, Gampe RT. Discovery of 7-methyl-5-(1-{[3-(trifluoromethyl)phenyl]acetyl}-2,3-dihydro-1 H-indol-5-yl)-7 H-pyrrolo[2,3- d]pyrimidin-4-amine (GSK2606414), a potent and selective first-in-class Inhibitor of protein kinase R (PKR)-like endoplasmic reticulum kinase (PERK) Journal of Medicinal Chemistry. 2012;55:7193–7207. doi: 10.1021/jm300713s. - DOI - PubMed
Publication types
MeSH terms
Substances
LinkOut - more resources
Full Text Sources
Other Literature Sources
Miscellaneous


