N(6)-methyladenosine-dependent RNA structural switches regulate RNA-protein interactions - PubMed (original) (raw)
N(6)-methyladenosine-dependent RNA structural switches regulate RNA-protein interactions
Nian Liu et al. Nature. 2015.
Abstract
RNA-binding proteins control many aspects of cellular biology through binding single-stranded RNA binding motifs (RBMs). However, RBMs can be buried within their local RNA structures, thus inhibiting RNA-protein interactions. N(6)-methyladenosine (m(6)A), the most abundant and dynamic internal modification in eukaryotic messenger RNA, can be selectively recognized by the YTHDF2 protein to affect the stability of cytoplasmic mRNAs, but how m(6)A achieves its wide-ranging physiological role needs further exploration. Here we show in human cells that m(6)A controls the RNA-structure-dependent accessibility of RBMs to affect RNA-protein interactions for biological regulation; we term this mechanism 'the m(6)A-switch'. We found that m(6)A alters the local structure in mRNA and long non-coding RNA (lncRNA) to facilitate binding of heterogeneous nuclear ribonucleoprotein C (HNRNPC), an abundant nuclear RNA-binding protein responsible for pre-mRNA processing. Combining photoactivatable-ribonucleoside-enhanced crosslinking and immunoprecipitation (PAR-CLIP) and anti-m(6)A immunoprecipitation (MeRIP) approaches enabled us to identify 39,060 m(6)A-switches among HNRNPC-binding sites; and global m(6)A reduction decreased HNRNPC binding at 2,798 high-confidence m(6)A-switches. We determined that these m(6)A-switch-regulated HNRNPC-binding activities affect the abundance as well as alternative splicing of target mRNAs, demonstrating the regulatory role of m(6)A-switches on gene expression and RNA maturation. Our results illustrate how RNA-binding proteins gain regulated access to their RBMs through m(6)A-dependent RNA structural remodelling, and provide a new direction for investigating RNA-modification-coded cellular biology.
Figures
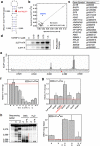
Extended Data Figure 1. m6A increases the accessibility of U-tract to enhance hnRNP C binding
a, Secondary structure of the MALAT1 hairpin with m6A methylation at 2,577 site shown in red. Nucleotide position numbers correspond to their locations along the human MALAT1 transcript (NR_002819). b, RNA pull down showing hnRNP C preferably binds methylated RNA. c, The list of proteins with identified peptides by mass spectrometry in b. d, Recombinant hnRNP C1 binds stronger with MALAT1 2,577-m6A hairpin compared to the unmethylated hairpin, as determined by in vitro UV crosslinking assay. e, hnRNP C shows binding around A2,577 site along MALAT1 in vivo, as determined by previously published hnRNP C iCLIP data. The underlying genomic sequence is shown at the bottom with a red square marking the m6A2,577 site. The slight shift of the iCLIP signal to upstream of the U-tract binding site is likely due to the steric hindrance of the peptide fragment remaining on RNA which can cause reverse transcription to terminate more than one nucleotide upstream of the cross-link site. f, Quantification of the RNase V1 cleavage signal for the U-tract region from RNA structural mapping assay in Fig. 1e. To correct for sample loading difference, each band signal was normalized to the band signal of the immediate 3’ residue to the U-tract. n = 3, ± s.d., technical replicates. g, Quantitative of the RNase T1 cleavage signal from RNA structural mapping assay in Fig. 1e. Increased RNase T1 cleavage signal (single-stranded specific & cleavage after guanosines) was observed due to the surrounding m6A residue. To correct for sample loading difference, the ratio for each band signal among all bands in each lane was calculated. The y-axis value Relative T1 cleavage = (m6Anative/m6Adenature)/(Anative/Adenature). n = 2, technical replicates. h, Quantitative CMCT mapping showing increased signals for the U-tract bases around the U base-pairing with m6A. Quantitation of band signals within the U-tract region is shown on the right. n = 4, ± s.d., technical replicates.
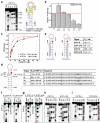
Extended Data Figure 2. Increased accessibility of U-tracts enhances hnRNP C binding
a, Structure probing of the 2,577A-to-U mutated MALAT1 hairpin (2,577-U), same annotation as in Fig. 1d. b, Quantification of the RNase V1 cleavage signal for the U-tract region from RNA structural mapping assays as in a. To correct for sample loading difference, each band signal was normalized to the band signal of the 3’ most U of the U-tract. n = 2, technical replicates. c, Filter-binding curves displaying the binding affinities between recombinant hnRNP C1 and 2,577-U/A oligos. n = 3, ± s.d., technical replicates. d, Filter-binding results showing the binding affinities between recombinant hnRNP C1 and four mutated MALAT1 oligos. (i) Mutate G-C to C-C, A2,577: predicted to weaken the hairpin stem and increase hnRNP C binding. Results: binding improved from 722 nM Kd to 142 nM (5-fold); (ii) Mutate G-C to C-C, m6A2,577: in this context of weaker stem, m6A is predicted to confer a smaller effect compared to wild-type hairpin. Result: improved binding only 2-fold instead of 8-fold; (iii) Restore C-C to C-G, A2,577: predicted to restore the hairpin stem and decrease hnRNP C binding compared to C-C mutant. Result: binding decreased by 6.4-fold; (iv) Restore C-C to C-G, m6A2,577: in this context of restored stem, m6A is again predicted to confer increased binding compared to A2,577 hairpin. Result: improved binding by 2.5-fold. n = 3 each, ± s.d., technical replicates. e, RNA alkaline hydrolysis terminal truncation assay showing recombinant hnRNP C1 binding to terminal truncated MALAT1 hairpin oligos (2,577 site m6A methylated or unmethylated). In this assay, 3′ radiolabeled MALAT1 2,577 hairpin oligos were terminal truncated by alkaline hydrolysis into RNA fragments which were then incubated with hnRNP C1 protein followed by filter binding wash steps. The remaining RNA on the filter paper was isolated and analyzed by denaturing gel electrophoresis, as indicated in the lane “C1-bound or C1-B”. “Input” refers to alkaline hydrolysis truncated RNA oligos used for incubation with hnRNP C1; “G-L or G-ladder” was generated from RNase T1 digestion; “Ctrl” refers to the intact MALAT1 hairpin without alkaline hydrolysis truncation. One pair of methylated/unmethylated truncated oligos (CUT1, marked by green arrows) was selected for subsequent biochemical analysis, due to their strong interaction with hnRNP C1. f, RNA terminal truncation assay as in e except 5′ 32P-labeled oligos were used. One pair of methylated/unmethylated truncated oligos (CUT2, marked by green arrows) was selected for subsequent biochemical analysis. g, Structure probing of the CUT1 oligos using RNase V1 and nuclease S1 digestion, same annotation as in Fig. 1e. The red dot marks the m6A site and the red line marks the U-tract region. h, Structure probing of the CUT2 oligos using RNase V1 and nuclease S1 digestion, same annotation as in g. i, Truncated oligos with exposed U-tracts increased hnRNP C binding regardless of m6A. n = 3, ± s.d., technical replicates.
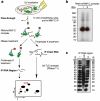
Extended Data Figure 3. m6A is enriched in the vicinity of hnRNP C binding sites
a, Schematic diagram of the CLIP-2dTLC protocol. IP, immunoprecipitation; nt, nucleotide. The RNase T1 used in our 2dTLC assay cleaves single-stranded RNA after guanosines, so the m6A/A ratio determined here represents the m6A fraction of all adenosines following guanosines. b, Analysis of crosslinked RNA-hnRNP C complexes (CLIP RNP) using denaturing gel electrophoresis (lanes 1 and 2). Positions of the protein size standards are shown on the left. hnRNP C IP RNA region (RNA samples within RNA-hnRNP C crosslinked complexes) were extracted from the gel slices marked by the red rectangle. c, Denaturing gel analyzing the size distribution for the hnRNP C PAR-CLIP RNA samples (lane 2). The RNA size standards were loaded in lanes 1 and 3.
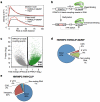
Extended Data Figure 4. PARCLIP-MeRIP identifies transcriptome-wide m6A-switches in the vicinity of hnRNP C binding sites
a, Density plots illustrating the distribution of distance between the PARCLIP-MeRIP/Input peaks and the nearest GRACH motif (top) or the nearest U-tracts in (bottom). b, Definition and identification of hnRNP C m6A-switches based on the PARCLIP-MeRIP analysis. Approximately 89% of PARCLIP-MeRIP peaks harboring both the U-tract and RRACH motif have “RRACH-U-tract” inter-motif distance within 50 nucleotides, significantly higher than the 64% of such coupling within the genomes. hnRNP C m6A-switches are identified as m6A methylated RRACH-U-tracts coupling events. c, Volcano plot depicting all coupling events (unfilled circles) as defined in b, according to their p-values (P, y-axis) and fold change values at RRACH sites (E, x-axis). To identify hnRNP C m6A-switches, we generated the π-value, π=E·(-log10P), as one comprehensive parameter to pick meaningful genomic loci. hnRNP C m6A-switches identified from PARCLIP-MeRIP experiments should fulfill the following requirements: (i) read counts at both the control and IP sample ≥ 5; (ii) π-value ≥ 0.627, corresponding to False Discovery Rate (FDR) ≤ 5%. d, Pie chart depicting the region distribution of hnRNP C m6A-switches identified by PARCLIP-MeRIP. e, Pie chart depicting hnRNP C PAR-CLIP peaks. These are enriched in introns, consistent with previous reports that hnRNP C binds mainly nascent transcripts,,.
Extended Data Figure 5. Validation of two identified m6A-switches
a-b, PARCLIP-MeRIP data detected positive IP/Input enrichment at the RRACH sites (red arrowheads) on the DNAJC25-GNG10 gene (a) and HNRNPH1 gene (b) in HEK293T cells. c-d, Quantification of RNase V1 cleavage signals around the U-tract region of m6A-switches on the DNAJC25-GNG10 (c) and HNRNPH1 (d) transcript, related to Fig. 2g-h. n = 3, ± s.d., technical replicates each. e, Quantitative CMCT mapping of DNAJC25-GNG10 m6A-switch shows increased band signals around the uridine base that pairs with m6A. The red vertical line marks the U-tract region. Quantitation of bands signal for the U-tract region is shown on the right. n = 3, ± s.d., technical replicates. HNRNPH1 m6A-switch hairpin is not suitable for CMCT probing, because its reverse transcription binding primer region is too short. f-g, In vivo DMS mapping of the DNAJC25-GNG10 hairpin (f) and HNRNPH1 (g); data are from. A and C residues are marked with orange dots and the m6A residue is marked with a red dot. The hairpin loops are indicated by red bars. h, Transcriptome-wide S1/V1 mapping around the HNRNPH1 m6A-switch site. Blue bars represent V1 signal; magenta bars represent S1 signal. The hairpin loop is indicated by a red bar; data are from. Not enough reads could be collected to make a plot for the DNAJC25-GNG10 m6A-switch region.
Extended Data Figure 6. Molecular features of HCS m6A-switches
a, Western blot showing stable hnRNP C protein abundance upon METTL3/L14 KD. b, Volcano plot of the METTL3/L14 KD data depicting RRACH-U-tracts coupling events (unfilled red circles) as defined in Extended Data Fig. 4b, according to their p-values (P, y-axis) and fold change values at the U-tracts (E, x-axis). c, Overlap of RRACH-U-tract coupling events with decreased hnRNP C binding by METTL3 and METTL14 KD. d, The intron fraction of HCS m6A-switches in coding RNA and non-coding RNA. e, Density plot displaying the distribution of exonic m6A-switches/HNRNPC PAR-CLIP peaks according to exon length. f, Inter-motif (RRACH-U-tract) distance distributions suggest that m6A-switches have a preference for shorter distances between the RRACH and U-tract (> 5xU) motifs. The distribution curves are from PARCLIP-MeRIP data (green), METTL3/L14 KD (red) and HCS m6A-switches (black). g, Analysis of the inter-motif (U-tract-U-tract) distance patterns, previously identified by iCLIP, in PARCLIP-MeRIP, METTL3/L14 KD and HCS m6A-switch data. The peaks at ~165 and ~300 nucleotides are clearly present. For the 2,798 high confident switches, we analyzed those in which the other U-tract motif is also in a PAR-CLIP-identified sequence; the long-range peaks seem to have shifted to longer distances (~220 and ~370 nucleotides). h, METTL3/L14 KD does not affect the inter-motif (U-tract-U-tract) distance distributions for U-tracts (≥5x U) in HEK293T cells. i, EVOfold analysis for the 2,798 HCS m6A-switches. The chances for HCS m6A-switches to have EVOfold records are significantly higher than random genomic sequences. We first calculated the number of HCS sites in the EVO database if occurring in random to be ~1.7 HCS sites. We found 18 HCS sites are present in EVO database, resulting in ~11x enrichment. This result is further divided into intronic and exonic regions.
Extended Data Figure 7. m6A-switches regulate the abundance of target mRNAs
a, HNRNPC, METTL3/L14 KD confirmed by Western blots. b, HNRNPC KD and METTL3/L14 KD co-regulated the expression of a large number of genes. Gene expression changes between Ctrl and HNRNPC, HNRNPU, METTL3/L14 KD HEK293T cells were analyzed by Cuffdiff2,, and the absolute numbers of differential expressed genes are shown. HCS-containing genes refer to the 1815 genes containing high confident m6A-switches. The RNA-seq data from HNRNPU KD HEK293T cells (GEO34995 dataset) was analyzed for comparison with a different mRNA binding protein. HnRNPU did not show preferential interaction with the 2,577-m6A modified MALAT1 hairpin (Fig. 1b, 1c). c, Gene ontology analysis of the m6A-switch-containing genes whose expression level were co-differentially-regulated by HNRNPC and METTL3/L14 KD, against all m6A-switch-containing genes as background. d, An example of m6A-switch among co-regulated transcript is the ARHGAP5 transcript (NM_001030055). Its proposed secondary structure with m6A methylation site in red is shown with the opposing the U-tract in a stem. e-f, PARCLIP-MeRIP detected positive IP/Input enrichment at the RRACH site (red arrowhead) of the ARHGAP5 m6A-switch (e), while METTL3/L14 KD decreased hnRNP C binding at the U-tract (red square) of this m6A-switch (f). g, The expression level of ARHGAP5 gene was co-upregulated by HNRNPC, METTL3/L14 KD, as shown by the RNA-seq data from HEK293T cells. The vertical black line represents the m6A-switch site. h, HNRNPC, METTL3/L14 KD decreased the proliferation rates of HEK293T cells to a similar extent. n = 4, ± s.d., biological replicates.
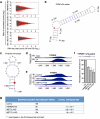
Extended Data Figure 8. m6A-switches regulate alternative splicing of target mRNAs
a, Fold changes (KD/Ctrl, log2) in normalized exon expression against RNA-seq reads detect the exons in HNRNPC KD, METTL3 KD, METTL14 KD and control samples. Statistically Significant Differentially Expressed Exons (SSDEE) called by DEXSeq are indicated in red. b, Proposed secondary structure of the CDS2 hairpin with the m6A methylation site shown in red, opposing the U-tract region. Nucleotide position numbers correspond to their locations along the human CDS2 transcript (NM_003818). c, Proposed secondary structure of the YTHDF2 hairpin with the m6A methylation site shown in red, opposing the U-tract region. Nucleotide position numbers correspond to their locations along the human YTHDF2 transcript (NM_001173128). de, PARCLIP-MeRIP detected a positive enrichment at the RRACH site (red arrowhead) (d), while METTL3/L14 KD decreased hnRNP C binding at the U-tract (red square) of this YTHDF2 m6A-switch (e). f, The inclusion level of one YTHDF2 exon is co-down-regulated by HNRNPC KD, METTL3 KD and METTL14 KD, as validated by RT-PCR. n = 3, ± s.d., biological replicates. g, We analyzed our polyA+ RNA-seq data to look for reads that span intron/exon junctions on CDS m6A-switch containing genes. We find that the control sample has significantly higher reads spanning intron/exon junctions than HNRNPC, METTL3/L14 KD samples. This result indicates that m6A depletion at the CDS m6A-switches promotes intron exclusion.
Extended Data Figure 9. Summary of the sequencing samples
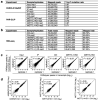
a, For PARCLIP-MeRIP and PAR-CLIP experiments from HEK293T cells, the number of mapped reads and “T-to-C” mutation rates are given for each replicate. b, For RNA-seq experiments from HEK293T cells, the number of total reads, the number of mapped reads as well as the mapping rates is given for each replicate. c, Scatter plots comparing transcripts for all PAR-CLIP replicate experiments. The square of Spearman's rank correlation value (r2) for each pair is shown in the upper left corner of the respective panel. d, The detected expression level changes show a strong correlation between gene KD replicates. Scatter plots comparing the fold changes (log2) in normalized gene expression from replicates of HNRNPC, METTL3 and METTL14 KD. The square of Spearman's rank correlation value (r2) for each pair is shown in the upper left corner of respective panels.
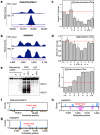
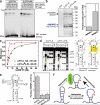
Figure 1. m6A alters RNA structure to enhance hnRNP C binding
a, m6A increases binding with nuclear proteins. b, RNA pull down showing hnRNP C preferably binds methylated RNA. n = 4, ± s.d., biological replicates. c, Filter binding showing m6A increases hnRNP C1 binding with respective apparent dissociation constant (Kd) indicated at lower right; n = 3, ± s.d., technical replicates. d, RNA structural probing showing m6A disrupts local RNA structure highlighted in yellow. Ctrl, no nuclease added; V1, RNase V1 digestion; S1, nuclease S1 digestion; T1, RNase T1 digestion; G-L, G-ladder; AH, alkaline hydrolysis. The orange bars mark the structurally altered RNA regions in the presence of m6A (red dot). e, RNA pull down with mutated oligos. n = 3, ± s.d., technical replicates. f, Illustration of the m6A-switch model.
Figure 2. PARCLIP-MeRIP identifies m6A-switches transcriptome-wide
a, CLIP-2dTLC showing the m6A enrichment in hnRNP C bound RNA regions. n = 3, ± s.d., biological replicates. b, hnRNP C bound RNA regions had higher anti-m6A pull down yield than polyA+ RNA. n = 3, ± s.d., biological replicates. c, Illustration of the PARCLIP-MeRIP protocol. IP, immunoprecipitation. d, PARCLIP-MeRIP identified m6A residue around the MALAT1 2,577 site. e, Binding motifs identified by FIRE with PARCLIP-MeRIP peaks. f, Density plot showing the positive enrichment at RRACH sites. g-h, Validation of two m6A-switches by S1/V1 structural probing and filter binding. n = 4, ± s.d., technical replicates. Same annotation as in Fig. 1c, d.
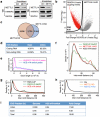
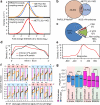
Figure 3. Global m6A reduction decreases hnRNP C binding at m6A-switches
a, Density plot showing negative enrichment at the U-tracts. b, Identification of HCS m6A-switches. c, Region distribution of HCS m6A-switches. d, Density plot showing m6A-switches distribution relative to exon/intron boundaries. e, m6A-switches in coding RNA were enriched in the 3’UTR and near the stop codon. f, Cumulative distribution of HCS m6A-switches (black) and control (orange) regarding the S1/V1 cleavage preference (data from) at U-tracts and RRACH motif. U-tract can be 3’ (upper) or 5’ (lower) of the RRACH motif. *: p < 0.05, **: p < 10−4, Kolmogorov-Smirnov test. g, Phylogenetic conservation of HCS m6A-switches among primates and vertebrates. ***: p < 10−16, Mann-Whitney-Wilcoxon test.
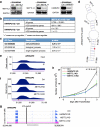
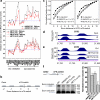
Figure 4. m6A-switches regulate mRNA abundance and alternative splicing
a, HNRNPC, METTL3/L14 KD co-regulated the abundance of m6A-switch-containing transcripts by RNA-seq and qPCR. b, Illustration of the relative exon distance to m6A-switches. c, Co-regulated exons by HNRNPC KD and METTL3 KD (left) and METTL14 KD (right) were more enriched around m6A-switch sites than non-co-regulated exons, Kolmogorov-Smirnov test. d-f, Validation of the m6A-switch regulated splicing at one exon neighboring the CDS2 m6A-switch as shown in PARCLIP-MeRIP data (d), METTL3/L14 KD data (e), and RT-PCR results (f). The red triangle and square mark the m6A site and U-tract, respectively. n = 4, ± s.d., biological replicates.
Comment in
- Molecular biology: RNA modification does a regulatory two-step.
Theler D, Allain FH. Theler D, et al. Nature. 2015 Feb 26;518(7540):492-3. doi: 10.1038/518492a. Nature. 2015. PMID: 25719665 No abstract available.
Similar articles
- N(6)-Methyladenosine Modification in a Long Noncoding RNA Hairpin Predisposes Its Conformation to Protein Binding.
Zhou KI, Parisien M, Dai Q, Liu N, Diatchenko L, Sachleben JR, Pan T. Zhou KI, et al. J Mol Biol. 2016 Feb 27;428(5 Pt A):822-833. doi: 10.1016/j.jmb.2015.08.021. Epub 2015 Sep 4. J Mol Biol. 2016. PMID: 26343757 Free PMC article. - Thermodynamic insights into N6-methyladenosine-modified ribonucleic acids and their interactions with the RNA recognition motif of heterogeneous nuclear ribonucleoprotein C.
Kumar A, Daripa P, Penumutchu S, Maiti S, Jain N. Kumar A, et al. Int J Biol Macromol. 2025 Jun;312:144210. doi: 10.1016/j.ijbiomac.2025.144210. Epub 2025 May 13. Int J Biol Macromol. 2025. PMID: 40373918 - N6-methyladenosine-dependent regulation of messenger RNA stability.
Wang X, Lu Z, Gomez A, Hon GC, Yue Y, Han D, Fu Y, Parisien M, Dai Q, Jia G, Ren B, Pan T, He C. Wang X, et al. Nature. 2014 Jan 2;505(7481):117-20. doi: 10.1038/nature12730. Epub 2013 Nov 27. Nature. 2014. PMID: 24284625 Free PMC article. - Structural Insights into N6-methyladenosine (m6A) Modification in the Transcriptome.
Huang J, Yin P. Huang J, et al. Genomics Proteomics Bioinformatics. 2018 Apr;16(2):85-98. doi: 10.1016/j.gpb.2018.03.001. Epub 2018 Apr 27. Genomics Proteomics Bioinformatics. 2018. PMID: 29709557 Free PMC article. Review. - Mapping N6 -Methyladenosine (m6 A) in RNA: Established Methods, Remaining Challenges, and Emerging Approaches.
Hartstock K, Rentmeister A. Hartstock K, et al. Chemistry. 2019 Mar 7;25(14):3455-3464. doi: 10.1002/chem.201804043. Epub 2019 Jan 8. Chemistry. 2019. PMID: 30347476 Review.
Cited by
- ALKBHs-facilitated RNA modifications and de-modifications.
A Alemu E, He C, Klungland A. A Alemu E, et al. DNA Repair (Amst). 2016 Aug;44:87-91. doi: 10.1016/j.dnarep.2016.05.026. Epub 2016 May 17. DNA Repair (Amst). 2016. PMID: 27237585 Free PMC article. Review. - Guitar: An R/Bioconductor Package for Gene Annotation Guided Transcriptomic Analysis of RNA-Related Genomic Features.
Cui X, Wei Z, Zhang L, Liu H, Sun L, Zhang SW, Huang Y, Meng J. Cui X, et al. Biomed Res Int. 2016;2016:8367534. doi: 10.1155/2016/8367534. Epub 2016 Apr 28. Biomed Res Int. 2016. PMID: 27239475 Free PMC article. - A single m6A modification in U6 snRNA diversifies exon sequence at the 5' splice site.
Ishigami Y, Ohira T, Isokawa Y, Suzuki Y, Suzuki T. Ishigami Y, et al. Nat Commun. 2021 May 28;12(1):3244. doi: 10.1038/s41467-021-23457-6. Nat Commun. 2021. PMID: 34050143 Free PMC article. - RNA Epigenetics: Fine-Tuning Chromatin Plasticity and Transcriptional Regulation, and the Implications in Human Diseases.
Willbanks A, Wood S, Cheng JX. Willbanks A, et al. Genes (Basel). 2021 Apr 22;12(5):627. doi: 10.3390/genes12050627. Genes (Basel). 2021. PMID: 33922187 Free PMC article. Review. - Emerging role of RNA modification N6-methyladenosine in immune evasion.
Lou X, Wang JJ, Wei YQ, Sun JJ. Lou X, et al. Cell Death Dis. 2021 Mar 19;12(4):300. doi: 10.1038/s41419-021-03585-z. Cell Death Dis. 2021. PMID: 33741904 Free PMC article. Review.
References
- Antson AA. Single-stranded-RNA binding proteins. Curr Opin Struct Biol. 2000;10:87–94. - PubMed
- Dreyfuss G, Kim VN, Kataoka N. Messenger-RNA-binding proteins and the messages they carry. Nat Rev Mol Cell Biol. 2002;3:195–205. - PubMed
- Ding Y, et al. In vivo genome-wide profiling of RNA secondary structure reveals novel regulatory features. Nature. 2013;505:696–700. - PubMed
Publication types
MeSH terms
Substances
Grants and funding
- UL1 TR000430/TR/NCATS NIH HHS/United States
- K01 HG006699/HG/NHGRI NIH HHS/United States
- R01 GM088599/GM/NIGMS NIH HHS/United States
- K01HG006699/HG/NHGRI NIH HHS/United States
- Howard Hughes Medical Institute/United States
- GM088599/GM/NIGMS NIH HHS/United States
LinkOut - more resources
Full Text Sources
Other Literature Sources
Molecular Biology Databases
