Mitochondrial control by DRP1 in brain tumor initiating cells - PubMed (original) (raw)
doi: 10.1038/nn.3960. Epub 2015 Mar 2.
Qiulian Wu 1, Craig M Horbinski 2, William A Flavahan 1, Kailin Yang 3, Wenchao Zhou 1, Stephen M Dombrowski 4, Zhi Huang 1, Xiaoguang Fang 1, Yu Shi 1, Ashley N Ferguson 5, David F Kashatus 5, Shideng Bao 3, Jeremy N Rich 3
Affiliations
- PMID: 25730670
- PMCID: PMC4376639
- DOI: 10.1038/nn.3960
Mitochondrial control by DRP1 in brain tumor initiating cells
Qi Xie et al. Nat Neurosci. 2015 Apr.
Abstract
Brain tumor initiating cells (BTICs) co-opt the neuronal high affinity glucose transporter, GLUT3, to withstand metabolic stress. We investigated another mechanism critical to brain metabolism, mitochondrial morphology, in BTICs. BTIC mitochondria were fragmented relative to non-BTIC tumor cell mitochondria, suggesting that BTICs increase mitochondrial fission. The essential mediator of mitochondrial fission, dynamin-related protein 1 (DRP1), showed activating phosphorylation in BTICs and inhibitory phosphorylation in non-BTIC tumor cells. Targeting DRP1 using RNA interference or pharmacologic inhibition induced BTIC apoptosis and inhibited tumor growth. Downstream, DRP1 activity regulated the essential metabolic stress sensor, AMP-activated protein kinase (AMPK), and targeting AMPK rescued the effects of DRP1 disruption. Cyclin-dependent kinase 5 (CDK5) phosphorylated DRP1 to increase its activity in BTICs, whereas Ca(2+)-calmodulin-dependent protein kinase 2 (CAMK2) inhibited DRP1 in non-BTIC tumor cells, suggesting that tumor cell differentiation induces a regulatory switch in mitochondrial morphology. DRP1 activation correlated with poor prognosis in glioblastoma, suggesting that mitochondrial dynamics may represent a therapeutic target for BTICs.
Figures
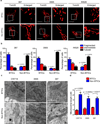
Figure 1. Brain tumor initiating cells and non-brain tumor initiating cells display distinct mitochondrial morphologies
a. Mitochondria of brain tumor initiating cells (BTICs) and non-BTICs isolated from patient-derived xenografts (387, 3565, and IN528) were visualized with anti-TOM20 antibody. Scale bars, 5µm. b. Mitochondria morphology was assessed from 150 cells of three different slides. Data are presented as mean ± s.e.m. (387, fragmented: p = 0.0018, tubular: p = 0.0052; 3565, fragmented: p = 0.0011, tubular: p = 0.0003; IN528, fragmented: p = 0.0040, tubular: p = 0.0014; statistical significance determined by Student’s t-test; n = 3). c. Transmission electron microscopy images of mitochondria in glioblastoma BTICs and non-BTICs isolated from three xenografts (CW718, 3565, and 387). At least 30 mitochondria were analyzed per experiment. Scale bars, 1 µm. Data are presented as mean ± s.e.m. (CW718, p = 0.0023; 3565, p = 0.0095; 387, p = 0.0217; statistical significance determined by Student’s t-test; n = 3).
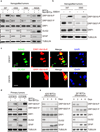
Figure 2. DRP1 is hyperactivated in brain tumor initiating cells
a. Immunoblot analysis of DRP1 total protein levels and activating phosphorylation [phospho-DRP1S616] and repressive phosphorylation [phospho-DRP1S637] in BTICs and non-BTICs isolated from patient-derived xenografts (T387, T4302, T3565, and IN528). Images were cropped for presentation. Full-length blots are presented in Supplementary Fig. 9. b. Alternative enrichment of BTICs from patient-derived xenografts (387 and 3565) by SSEA1/CD15 confirmed differential activation on immunoblot of phospho-DRP1. c. Immunofluorescent staining of activating phosphorylation of DRP1 [phospho-DRP1S616] with several BTIC markers, including SOX2 and OLIG2 in two primary human GBM specimens (CW1617, CW1679). d. Immunoblot analysis of DRP1 protein and its activating phosphorylation [phospho-DRP1S616] and repressive phosphorylation [phopho-DRP1S637] in BTICs and non-BTICs directly derived from two primary human glioblastoma specimens (CCF3015 and CCF3038). e. Immunoblot analysis of phospho-DRP1S616 and phospho-DRP1S637 levels during BTIC (4302 and 387) differentiation induced by 10% serum over a time course.
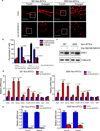
Figure 3. DRP1 phosphorylation regulates mitochondrial morphology and stem cell marker expression
a. Immunofluorescent staining of mitochondria by TOM20 in 387 and 3565 non-brain tumor initiating cells (non-BTICs) transduced by lentiviral control vector or a DRP1S616E/S637A double mutant. b. Mitochondria morphology was assessed from 120 cells of three different experiments. Data are displayed as mean ± s.e.m. (387, fragmented: p = 0.0009, tubular: p = 0.0002; 3565, fragmented: p = 0.0030, tubular: p = 0.0016; statistical significance determined by Student’s t-test; n = 3). c. Immunoblot analysis of DRP1 protein in 387 and 3565 non-BTICs expressing control vector or a DRP1S616E/S637A double mutant. Images were cropped for presentation. Full-length blots are presented in Supplementary Fig. 10. d, e. 387 non-BTICs were transduced with vector encoding a DRP1S616E/S637A double mutant or control vector. Three days after infection, total RNA was isolated and cDNA was synthesized by reverse transcription. The mRNA levels of indicated genes were detected by real-time qPCR. Data are displayed as mean ± s.e.m. (387: Olig2, p = 0.0072; Oct4, p = 0.0097; Nanog, p = 0.0087; Nestin, p= 0.0309; Pou3f2, p= 0.0067; CD133, p = 0.0219; SSEA1, p = 0.0041; GFAP, p = 0.0095; MAP2, p = 0.0001. 3565: Olig2, p = 0.0334; Oct4, p = 0.0097; Nanog, p = 0.0074; Pou3f2, p = 0.0022; CD133, p = 0.0093; SSEA1, p = 0.0251; GFAP, p = 0.0164; MAP2, p = 0.0020. Statistical significance determined by Student’s t-test; n = 3).
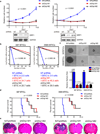
Figure 4. Targeting DRP1 by RNA interference decreases brain tumor initiating cell growth, self-renewal, and tumor formation capacity
a. Top: Effects of Drp1 knockdown with two independent lentiviral shRNA constructs on cell proliferation in two brain tumor initiating cell (BTIC) models (387 and 3565). Data are displayed as mean ± s.e.m. (p < 0.0001 for both models; statistical significance determined by repeated measures ANOVA; n = 3). Bottom: Immunoblot of DRP1 following knockdown via shRNAs compared to non-targeting control shRNA sequence (NT shRNA) in two BTIC models. Images were cropped for presentation. Full-length blots are presented in Supplementary Fig. 10. b. In vitro extreme limiting dilution assays (ELDA) to single cells demonstrate that knockdown of DRP1 in two BTIC models (387 and 3565) decreases the frequency of tumorsphere formation (387, p = 9.05 × 10−38; 3565, p= 2.9 × 10−36 by ANOVA). c. Representative images of tumorspheres derived from BTICs (387 and 3565) expressing NT control shRNA, shDrp1#1, or shDrp1#2 are shown. Scale bars, 100 µm. Quantification shows reduced tumorsphere size with DRP1 knockdown (387: shDrp1#1, p = 0.0019; shDrp1#2, p = 0.0021. 3565: shDrp1#1, p = 0.0002; shDrp1#2, p = 0.0002. ANOVA, n = 3). d. Kaplan-Meier survival curves of immunocompromised mice bearing orthotopic BTICs (387 and 3565) expressing NT control shRNA, shDrp1#1, or shDrp1#2 (387, p = 0.0009; 3565, p = 0.0008 by log-rank analysis; n = 5). e. Representative images of cross sections (hematoxylin and eosin [H&E] stained) of mouse brains harvested on day 24 (left: 3565 BTICs) or day 22 (right: 387 BTICs) after transplantation of BTICs expressing NT control shRNA, shDrp1#1, or shDrp1#2. Scale bars, 2 mm.
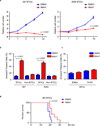
Figure 5. DRP1 inhibitor Mdivi-1 reduces brain tumor initiating cell growth and induces apoptosis
a. Effects of Mdivi-1 treatment on cell proliferation in two brain tumor initiating cell (BTIC) models (387 and 3565). Plotted data are mean ± s.e.m. (387: 4 d, p < 0.0001; 3565: 4d, p < 0.0001; n = 4). b. Apoptosis measured by AnnexinV staining in BTICs and non-BTICs with Mdivi-1 or DMSO vehicle treatment. Data are presented as mean ± s.e.m. (387: BTICs, p < 0.0001; non-BTICs, p = 0.066. 3565: BTICs, p = 0.0005; non-BTICS, p = 0.5814 by Student’s t-test; ns = not significant; n = 3). c. Apoptosis was measured by Annexin V staining in two human neural progenitor cell (NPC) lines (ENSA and 15167) with Mdivi-1 or DMSO treatment. Data are presented as mean ± s.e.m. (ENSA: p = 0.2571; 15167: p = 0.1413 by Student’s t-test; ns = not significant; n = 3). d. Kaplan–Meier survival curves of immunocompromised mice bearing orthotopic 387 BTICs (3 × 10⁵ cells/animal). Three days after tumor implantation, mice were treated with Midivi-1 (2.5 mg/kg) or DMSO vehicle control for 5 days (p = 0.0134 by log-rank analysis; n = 7).
Figure 6. DRP1 inhibition induces AMPK activity in BTICs
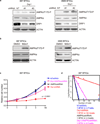
a. Lysates of 387 and 3565 BTICs expressing NT control shRNA, shDrp1#1, or shDrp1#2 were immunoblotted with the indicated antibodies. shRNA mediated knockdown of DRP1 induced AMPK activity. Images were cropped for presentation. Full-length blots are presented in Supplementary Fig. 10. b. Lysates of 387 and 3565 BTICs treated with Midivi-1 or DMSO were immunoblotted with the indicated antibodies. Inhibition DRP1 by Midivi-1 induced AMPK activity. c. Growth curves of 387 BTICs expressing NT control shRNA, shDrp1, shAMPKα, or shDrp1 and shAMPKα together. Data are plotted as mean ± s.e.m. p < 0.0001 by repeated measures ANOVA. d. In vitro extreme limiting dilution assays (ELDA) of 387 BTICs expressing NT control shRNA, shDrp1, shAMPKα, or shDrp1 and shAMPKα together. p = 1.7 × 10⁻³⁴ by ANOVA.
Figure 7. CDK5 activates DRP1 in brain tumor initiating cells
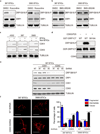
a. Lysates of 387 and 3565 brain tumor initiating cells (BTICs) treated with the CDK1/2/5 inhibitor Roscovitine or DMSO vehicle control were subjected to immunoblot analysis with the indicated antibodies. Images were cropped for presentation. Full-length blots are presented in Supplementary Fig. 11. b. Lysates of 387 and 3565 BTICs treated the CDK1/2 inhibitor BMS-265246 or DMSO were immunoblotted with the indicated antibodies. c. Immunoblot analysis of CDK1, CDK5, stem and differentiation markers in BTICs and non-BTICs isolated from multiple patient-derived glioma xenografts (4302, 387, and 3565). d. In vitro kinase assays were performed with or without CDK5/p25 and either wild type or mutant (S616A) GST-C-terminal fragment of DRP1 (AA 518–736), GST-DRP1CT. e. Lysates of 387 BTICs expressing NT control shRNA or three independent shRNA constructs targeting CDK1 or CDK5 were immunoblotted with the indicated antibodies. Knockdown CDK5 but not CDK1 decreased phospho-DRP1S616 levels. f. Immunofluorescent staining of the mitochondrial marker TOM20 in 387 and 3565 BTICs expressing NT control shRNA or shCDK5. Data are represented as mean ± s.e.m. (387: fragmented, p = 0.0088; tubular, p = 0.0011. 3565: fragmented, p = 0.0098; tubular, p = 0.0018; Student’s t-test; n = 3).
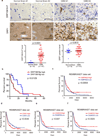
Figure 8. DRP1 regulation informs patient prognosis
a. Immunohistochemical (IHC) staining and scatter plot of DRP1 and phospho-DRP1S616 in human primary glioblastomas and non-neoplastic brain tissues in a tissue microarray. Scale bar, 50 µm. Phosphorylated DRPS616: p < 0.0001; total DRP1: p = 0.681. b. Kaplan-Meier plot of tissue microarray data indicates that higher phosphorylation of DRP1 (phospho-DRP1S616/total DRP1) correlates with poor glioblastoma patient survival. p = 0.0125 by log-rank analysis. c. Analysis of REMBRANDT data indicates that lower AMPKA2 mRNA expression correlates with poor glioma patient survival. p = 0.0059 by log-rank analysis. d–f. Analysis of REMBRANDT data indicates that higher CDK5 (p = 0.0046 by log-rank analysis) and lower CAMK2 mRNA expression (p = 0.047 and 0.0023 by log-rank analysis for CAMK2A and CAMK2G, respectively) correlates with poor glioma patient survival.
Similar articles
- Drp1 regulates mitochondrial morphology and cell proliferation in cutaneous squamous cell carcinoma.
Kitamura S, Yanagi T, Imafuku K, Hata H, Abe R, Shimizu H. Kitamura S, et al. J Dermatol Sci. 2017 Dec;88(3):298-307. doi: 10.1016/j.jdermsci.2017.08.004. Epub 2017 Aug 5. J Dermatol Sci. 2017. PMID: 28818497 - Dynamin-related protein 1-mediated mitochondrial fission contributes to IR-783-induced apoptosis in human breast cancer cells.
Tang Q, Liu W, Zhang Q, Huang J, Hu C, Liu Y, Wang Q, Zhou M, Lai W, Sheng F, Li G, Zhang R. Tang Q, et al. J Cell Mol Med. 2018 Sep;22(9):4474-4485. doi: 10.1111/jcmm.13749. Epub 2018 Jul 11. J Cell Mol Med. 2018. PMID: 29993201 Free PMC article. - Aβ-Induced Drp1 phosphorylation through Akt activation promotes excessive mitochondrial fission leading to neuronal apoptosis.
Kim DI, Lee KH, Gabr AA, Choi GE, Kim JS, Ko SH, Han HJ. Kim DI, et al. Biochim Biophys Acta. 2016 Nov;1863(11):2820-2834. doi: 10.1016/j.bbamcr.2016.09.003. Epub 2016 Sep 4. Biochim Biophys Acta. 2016. PMID: 27599716 - [Mechanism of mitochondrial fission - structure and function of Drp1 protein].
Michalska B, Duszyński J, Szymański J. Michalska B, et al. Postepy Biochem. 2016;62(2):127-137. Postepy Biochem. 2016. PMID: 28132464 Review. Polish. - New insights into the function and regulation of mitochondrial fission.
Otera H, Ishihara N, Mihara K. Otera H, et al. Biochim Biophys Acta. 2013 May;1833(5):1256-68. doi: 10.1016/j.bbamcr.2013.02.002. Epub 2013 Feb 20. Biochim Biophys Acta. 2013. PMID: 23434681 Review.
Cited by
- Neural activity and CaMKII protect mitochondria from fragmentation in aging Caenorhabditis elegans neurons.
Jiang HC, Hsu JM, Yen CP, Chao CC, Chen RH, Pan CL. Jiang HC, et al. Proc Natl Acad Sci U S A. 2015 Jul 14;112(28):8768-73. doi: 10.1073/pnas.1501831112. Epub 2015 Jun 29. Proc Natl Acad Sci U S A. 2015. PMID: 26124107 Free PMC article. - Mitochondrial Metabolism in Pancreatic Ductal Adenocarcinoma: From Mechanism-Based Perspectives to Therapy.
Padinharayil H, Rai V, George A. Padinharayil H, et al. Cancers (Basel). 2023 Feb 8;15(4):1070. doi: 10.3390/cancers15041070. Cancers (Basel). 2023. PMID: 36831413 Free PMC article. Review. - BMI1 Silencing Induces Mitochondrial Dysfunction in Lung Epithelial Cells Exposed to Hyperoxia.
Hernández-Cuervo H, Soundararajan R, Sidramagowda Patil S, Breitzig M, Alleyn M, Galam L, Lockey R, Uversky VN, Kolliputi N. Hernández-Cuervo H, et al. Front Physiol. 2022 Mar 30;13:814510. doi: 10.3389/fphys.2022.814510. eCollection 2022. Front Physiol. 2022. PMID: 35431986 Free PMC article. - Mitochondrial network structure homeostasis and cell death.
Xie LL, Shi F, Tan Z, Li Y, Bode AM, Cao Y. Xie LL, et al. Cancer Sci. 2018 Dec;109(12):3686-3694. doi: 10.1111/cas.13830. Epub 2018 Nov 16. Cancer Sci. 2018. PMID: 30312515 Free PMC article. Review. - FUNDC2 promotes liver tumorigenesis by inhibiting MFN1-mediated mitochondrial fusion.
Li S, Han S, Zhang Q, Zhu Y, Zhang H, Wang J, Zhao Y, Zhao J, Su L, Li L, Zhou D, Ye C, Feng XH, Liang T, Zhao B. Li S, et al. Nat Commun. 2022 Jun 17;13(1):3486. doi: 10.1038/s41467-022-31187-6. Nat Commun. 2022. PMID: 35710796 Free PMC article.
References
- Stupp R, et al. Effects of radiotherapy with concomitant and adjuvant temozolomide versus radiotherapy alone on survival in glioblastoma in a randomised phase III study: 5-year analysis of the EORTC-NCIC trial. The lancet oncology. 2009;10:459–466. - PubMed
- Singh SK, et al. Identification of human brain tumour initiating cells. Nature. 2004;432:396–401. - PubMed
- Galli R, et al. Isolation and characterization of tumorigenic, stem-like neural precursors from human glioblastoma. Cancer research. 2004;64:7011–7021. - PubMed
Publication types
MeSH terms
Substances
Grants and funding
- P30CA177558/CA/NCI NIH HHS/United States
- NS089272/NS/NINDS NIH HHS/United States
- P20 RR020171/RR/NCRR NIH HHS/United States
- R01 NS070315/NS/NINDS NIH HHS/United States
- CA155764/CA/NCI NIH HHS/United States
- CA154130/CA/NCI NIH HHS/United States
- P30 CA177558/CA/NCI NIH HHS/United States
- R01 NS087913/NS/NINDS NIH HHS/United States
- NS087913/NS/NINDS NIH HHS/United States
- CA171652/CA/NCI NIH HHS/United States
- NS070315/NS/NINDS NIH HHS/United States
- R01 CA169117/CA/NCI NIH HHS/United States
- CA169117/CA/NCI NIH HHS/United States
- K08 CA155764/CA/NCI NIH HHS/United States
- R01 CA171652/CA/NCI NIH HHS/United States
- R01 NS089272/NS/NINDS NIH HHS/United States
- 2P20 RR020171/RR/NCRR NIH HHS/United States
- R01 CA154130/CA/NCI NIH HHS/United States
LinkOut - more resources
Full Text Sources
Other Literature Sources
Medical
Molecular Biology Databases
Research Materials
Miscellaneous
