ATF3 mediates inhibitory effects of ethanol on hepatic gluconeogenesis - PubMed (original) (raw)
ATF3 mediates inhibitory effects of ethanol on hepatic gluconeogenesis
Wen-Wei Tsai et al. Proc Natl Acad Sci U S A. 2015.
Abstract
Increases in circulating glucagon during fasting maintain glucose balance by stimulating hepatic gluconeogenesis. Acute ethanol intoxication promotes fasting hypoglycemia through an increase in hepatic NADH, which inhibits hepatic gluconeogenesis by reducing the conversion of lactate to pyruvate. Here we show that acute ethanol exposure also lowers fasting blood glucose concentrations by inhibiting the CREB-mediated activation of the gluconeogenic program in response to glucagon. Ethanol exposure blocked the recruitment of CREB and its coactivator CRTC2 to gluconeogenic promoters by up-regulating ATF3, a transcriptional repressor that also binds to cAMP-responsive elements and thereby down-regulates gluconeogenic genes. Targeted disruption of ATF3 decreased the effects of ethanol in fasted mice and in cultured hepatocytes. These results illustrate how the induction of transcription factors with overlapping specificity can lead to cross-coupling between stress and hormone-sensitive pathways.
Keywords: ATF3; CREB; cAMP; glucagon; gluconeogenesis.
Conflict of interest statement
The authors declare no conflict of interest.
Figures
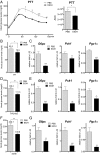
Fig. 1.
Acute ethanol exposure inhibits hepatic gluconeogenesis. (A) PTT of fasted WT mice following treatment with PBS or ethanol (EtOH). AUC values were calculated from PTT assays. The mean BAL was 473 ± 19 mg/dL in the ethanol-treated mice at 30 min after the last ethanol dose. Each bar represents averaged results, n = 4. Error bars indicate SEM. *P < 0.05; **P < 0.01; ***P < 0.001. (B) Fasting blood glucose concentrations in WT mice following PBS or ethanol treatment. The mean BAL was 498 ± 13 mg/dL. Each bar represents averaged results, n = 12. Error bars indicate SEM. *P < 0.05. (C) Analysis of mRNA amounts for gluconeogenic genes in livers of fasted WT mice following PBS or ethanol treatment. Each bar represents averaged results, n = 5. Error bars indicate SEM. *P < 0.05; **P < 0.01; ***P < 0.001. (D) Fasting blood glucose concentrations in HFD-fed mice after PBS or ethanol administration. The mean BAL was 452 ± 23 mg/dL. Each bar represents averaged results, n = 5. Error bars indicate SEM. **P < 0.01. (E) mRNA amounts for gluconeogenic genes in livers of fasted HFD-fed mice with PBS or ethanol administration. Each bar represents averaged results, n = 5. Error bars indicate SEM. *P < 0.05; **P < 0.01; ***P < 0.001. (F) Fasting blood glucose concentrations in db/db mice following PBS or ethanol treatment. The mean BAL was 436 ± 14 mg/dL. Each bar represents averaged results, n = 7. Error bars indicate SEM. **P < 0.01. (G) mRNA amounts for gluconeogenic genes in livers of fasted db/db mice following PBS or ethanol treatment. Each bar represents averaged results, n = 7. Error bars indicate SEM. *P < 0.05; **P < 0.01; ***P < 0.001.
Fig. 2.
Ethanol disrupts recruitment of CREB and CRTC2 to gluconeogenic promoters. (A) Effect of a 10-min pretreatment with ethanol (EtOH) on gluconeogenic gene expression in mouse primary hepatocytes exposed to glucagon for 1.5 h. Each bar represents averaged results for three biological replicates, assayed three times each. Error bars indicate SEM. *P < 0.05; **P < 0.01; ***P < 0.001. (B) Western blot showing the effect of a 10-min pretreatment with ethanol on phosphorylation of CREB and LKB and dephosphorylation of CRTC2 in primary hepatocytes exposed to glucagon for 45 min. CREB and HSP90 served as loading controls. (C) Immunofluorescence staining showing the effect of a 10-min pretreatment with ethanol (250 mM) on the nuclear translocation of CRTC2 in primary hepatocytes exposed to glucagon for 45 min. Red, CRTC2; green, actin; blue, DAPI. (D) Effect of a 10-min pretreatment with ethanol on _G6pc_-Luc and CRE-Luc reporter activities in primary hepatocytes exposed to glucagon for 5 h. Each bar represents averaged results for three biological replicates, assayed three times each. Error bars indicate SEM. *P < 0.05; **P < 0.01; ***P < 0.001. (E) ChIP assays showing the effects of a 10-min pretreatment with ethanol (250 mM) on the recruitment of CREB, phospho-CREB, and CRTC2 to CREB-binding sites over gluconeogenic (G6pc, Pck1) promoters in primary hepatocytes exposed to glucagon for 1 h. The 36b4 ribosomal protein gene served as a negative control. Each bar represents averaged results for two biological replicates, assayed three times each. Error bars indicate SEM. *P < 0.05; **P < 0.01; ***P < 0.001.
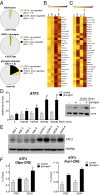
Fig. 3.
Ethanol stimulates expression of ATF3. (A) Gene profile analysis of primary hepatocytes following exposure to ethanol (EtOH). Pie charts show the proportion of cellular genes up- or down-regulated by ≥1.5-fold by a 1-h pretreatment with ethanol under basal conditions and following exposure to glucagon for 1.5 h. (B) Heat map showing the effects of ethanol on the top 40 scoring glucagon-inducible genes in primary hepatocytes. (C) Heat map showing the top 40 scoring ethanol-inducible genes in primary hepatocytes. (D) (Left) Effects of a 10-min pretreatment with ethanol on ATF3 RNA expression in primary hepatocytes exposed to glucagon for 1.5 h. Each bar represents averaged results for three biological replicates, assayed three times each. Error bars indicate SEM. *P < 0.05; **P < 0.01; ***P < 0.001. (Right) Western blot showing the effects of a 10-min pretreatment with ethanol on ATF3 protein amounts in primary hepatocytes exposed to glucagon for 1 h. CREB served as a loading control. (E) Western blot of hepatic ATF3 protein amounts in fasted WT mice treated with PBS or ethanol. HSP90 served as a loading control. (F) ChIP assays showing the effects of a 10-min pretreatment with ethanol (250 mM) on the recruitment of ATF3 to CREB-binding sites at G6pc and Pck1 promoters in primary hepatocytes exposed to glucagon for 1 h. Each bar represents averaged results for two biological replicates, assayed three times each. Error bars indicate SEM. *P < 0.05; **P < 0.01; ***P < 0.001.
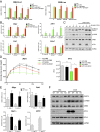
Fig. 4.
ATF3 mediates the inhibitory effects of ethanol on hepatic gluconeogenesis. (A) Effects of a 10-min pretreatment with ethanol (EtOH) on _G6pc_-Luc and CRE-Luc reporter activities in primary hepatocytes isolated from WT or ATF3 −/− mice in response to a 5-h exposure to glucagon. Each bar represents averaged results for three biological replicates, assayed three times each. Error bars indicate SEM. *P < 0.05; **P < 0.01; ***P < 0.001. (B) Effects of a 10-min pretreatment with ethanol on gluconeogenic gene expression in primary hepatocytes, WT or ATF3 −/−, in response to a 1.5-h exposure to glucagon. Each bar represents averaged results for three biological replicates, assayed three times each. Error bars indicate SEM. *P < 0.05; **P < 0.01; ***P < 0.001. (C) Western blot showing the effects of a 10-min pretreatment with ethanol on the phosphorylation of CREB, dephosphorylation of CRTC2, and ATF3 expression in primary hepatocytes, WT and ATF3 −/−, exposed to glucagon for 45 min. CREB and HSP90 served as loading controls. (D) PTT assays performed on fasted WT or ATF3 −/− mice treated with PBS or ethanol. AUC values were calculated from PTT assays. The mean BAL was 450 ± 15 mg/dL in WT mice and 447 ± 6 mg/dL in ATF3 −/− mice. Each bar represents averaged results for three biological replicates. Error bars indicate SEM. *P < 0.05; **P < 0.01; ***P < 0.001. (E) Analysis of mRNA amounts of gluconeogenic genes in livers of fasted WT and ATF3 −/− mice treated with PBS or ethanol. The mean BAL was 406 ± 14 mg/dL in WT mice and 371 ± 18 mg/dL in ATF3 −/− mice. Each bar represents averaged results for five biological replicates. Error bars indicate SEM. *P < 0.05; **P < 0.01; ***P < 0.001. (F) Western blot showing the effects of ethanol on ATF3 and PCK1 protein amounts in livers of fasted WT and ATF3 −/− mice treated with PBS or ethanol. HSP90 served as a loading control.
Similar articles
- CREB-upregulated lncRNA MEG3 promotes hepatic gluconeogenesis by regulating miR-302a-3p-CRTC2 axis.
Zhu X, Li H, Wu Y, Zhou J, Yang G, Wang W, Kang D, Ye S. Zhu X, et al. J Cell Biochem. 2019 Mar;120(3):4192-4202. doi: 10.1002/jcb.27706. Epub 2018 Sep 27. J Cell Biochem. 2019. PMID: 30260029 - Glucagon up-regulates hepatic mitochondrial pyruvate carrier 1 through cAMP-responsive element-binding protein; inhibition of hepatic gluconeogenesis by ginsenoside Rb1.
Lou MD, Li J, Cheng Y, Xiao N, Ma G, Li P, Liu B, Liu Q, Qi LW. Lou MD, et al. Br J Pharmacol. 2019 Aug;176(16):2962-2976. doi: 10.1111/bph.14758. Epub 2019 Jul 6. Br J Pharmacol. 2019. PMID: 31166615 Free PMC article. - Regulation of hepatic gluconeogenesis by nuclear factor Y transcription factor in mice.
Zhang Y, Guan Q, Liu Y, Zhang Y, Chen Y, Chen J, Liu Y, Su Z. Zhang Y, et al. J Biol Chem. 2018 May 18;293(20):7894-7904. doi: 10.1074/jbc.RA117.000508. Epub 2018 Mar 12. J Biol Chem. 2018. PMID: 29530977 Free PMC article. - Transcription factors and coactivators controlling nutrient and hormonal regulation of hepatic gluconeogenesis.
Jitrapakdee S. Jitrapakdee S. Int J Biochem Cell Biol. 2012 Jan;44(1):33-45. doi: 10.1016/j.biocel.2011.10.001. Epub 2011 Oct 8. Int J Biochem Cell Biol. 2012. PMID: 22004992 Review. - CREB and FoxO1: two transcription factors for the regulation of hepatic gluconeogenesis.
Oh KJ, Han HS, Kim MJ, Koo SH. Oh KJ, et al. BMB Rep. 2013 Dec;46(12):567-74. doi: 10.5483/bmbrep.2013.46.12.248. BMB Rep. 2013. PMID: 24238363 Free PMC article. Review.
Cited by
- H2S-Synthesizing Enzymes Are Putative Determinants in Lung Cancer Management toward Personalized Medicine.
Hipólito A, Mendes C, Martins F, Lemos I, Francisco I, Cunha F, Almodôvar T, Albuquerque C, Gonçalves LG, Bonifácio VDB, Vicente JB, Serpa J. Hipólito A, et al. Antioxidants (Basel). 2023 Dec 28;13(1):51. doi: 10.3390/antiox13010051. Antioxidants (Basel). 2023. PMID: 38247476 Free PMC article. - Deficiency of gluconeogenic enzyme PCK1 promotes metabolic-associated fatty liver disease through PI3K/AKT/PDGF axis activation in male mice.
Ye Q, Liu Y, Zhang G, Deng H, Wang X, Tuo L, Chen C, Pan X, Wu K, Fan J, Pan Q, Wang K, Huang A, Tang N. Ye Q, et al. Nat Commun. 2023 Mar 14;14(1):1402. doi: 10.1038/s41467-023-37142-3. Nat Commun. 2023. PMID: 36918564 Free PMC article. - Exploring Prognosis, Tumor Microenvironment and Tumor Immune Infiltration in Hepatocellular Carcinoma Based on ATF/CREB Transcription Factor Family Gene-Related Model.
Shen H, Gu X, Li H, Tang M, Li X, Zhang Y, Su F, Wang Z. Shen H, et al. J Hepatocell Carcinoma. 2023 Feb 27;10:327-345. doi: 10.2147/JHC.S398713. eCollection 2023. J Hepatocell Carcinoma. 2023. PMID: 36874250 Free PMC article. - The transcription factor ATF3 switches cell death from apoptosis to necroptosis in hepatic steatosis in male mice.
Inaba Y, Hashiuchi E, Watanabe H, Kimura K, Oshima Y, Tsuchiya K, Murai S, Takahashi C, Matsumoto M, Kitajima S, Yamamoto Y, Honda M, Asahara SI, Ravnskjaer K, Horike SI, Kaneko S, Kasuga M, Nakano H, Harada K, Inoue H. Inaba Y, et al. Nat Commun. 2023 Jan 23;14(1):167. doi: 10.1038/s41467-023-35804-w. Nat Commun. 2023. PMID: 36690638 Free PMC article. - An Integrative Analysis of Transcriptome and GWAS Data to Identify Potential Candidate Genes Influencing Meat Quality Traits in Pigs.
Liu X, Zhang J, Xiong X, Chen C, Xing Y, Duan Y, Xiao S, Yang B, Ma J. Liu X, et al. Front Genet. 2021 Oct 21;12:748070. doi: 10.3389/fgene.2021.748070. eCollection 2021. Front Genet. 2021. PMID: 34745221 Free PMC article.
References
- Saltiel AR, Kahn CR. Insulin signalling and the regulation of glucose and lipid metabolism. Nature. 2001;414(6865):799–806. - PubMed
- Mayr B, Montminy M. Transcriptional regulation by the phosphorylation-dependent factor CREB. Nat Rev Mol Cell Biol. 2001;2(8):599–609. - PubMed
- Lieber CS. Metabolism of alcohol. Clin Liver Dis. 2005;9(1):1–35. - PubMed
Publication types
MeSH terms
Substances
Grants and funding
- R37 DK083834/DK/NIDDK NIH HHS/United States
- R01 DK083834/DK/NIDDK NIH HHS/United States
- R01 DK049777/DK/NIDDK NIH HHS/United States
- R01 DK091618/DK/NIDDK NIH HHS/United States
- F32 DK096778/DK/NIDDK NIH HHS/United States
LinkOut - more resources
Full Text Sources
Other Literature Sources
Molecular Biology Databases
Miscellaneous


