A gp130-Src-YAP module links inflammation to epithelial regeneration - PubMed (original) (raw)
. 2015 Mar 5;519(7541):57-62.
doi: 10.1038/nature14228. Epub 2015 Feb 25.
Li-Wha Wu 2, Sergei I Grivennikov 3, Petrus R de Jong 4, Ian Lian 5, Fa-Xing Yu 6, Kepeng Wang 7, Samuel B Ho 8, Brigid S Boland 9, John T Chang 9, William J Sandborn 9, Gary Hardiman 10, Eyal Raz 4, Yoshihiko Maehara 11, Akihiko Yoshimura 12, Jessica Zucman-Rossi 13, Kun-Liang Guan 14, Michael Karin 15
Affiliations
- PMID: 25731159
- PMCID: PMC4447318
- DOI: 10.1038/nature14228
A gp130-Src-YAP module links inflammation to epithelial regeneration
Koji Taniguchi et al. Nature. 2015.
Abstract
Inflammation promotes regeneration of injured tissues through poorly understood mechanisms, some of which involve interleukin (IL)-6 family members, the expression of which is elevated in many diseases including inflammatory bowel diseases and colorectal cancer. Here we show in mice and human cells that gp130, a co-receptor for IL-6 cytokines, triggers activation of YAP and Notch, transcriptional regulators that control tissue growth and regeneration, independently of the gp130 effector STAT3. Through YAP and Notch, intestinal gp130 signalling stimulates epithelial cell proliferation, causes aberrant differentiation and confers resistance to mucosal erosion. gp130 associates with the related tyrosine kinases Src and Yes, which are activated on receptor engagement to phosphorylate YAP and induce its stabilization and nuclear translocation. This signalling module is strongly activated upon mucosal injury to promote healing and maintain barrier function.
Figures
Extended Data Figure 1. gp130Act expression and intestinal phenotype
(a) Schematic diagram of the villin-gp130Act transgenic (Tg) construct and the gp130Act and gp130SA variants. (b) Expression of gp130Act in the villin-gp130Act jejunum was confirmed by RT-PCR with specific primers for human gp130. Cyclophilin (CPH) was used as an internal control. (c) Representative images of WT and villin-gp130Act intestines. c-Myc and CyclinD1 (d) and TUNEL (red: TUNEL; blue: DAPI) (e) staining of paraffin-embedded sections of WT and villin-gp130Act small intestines from 3-month old mice. Positive cells were enumerated in each villus or crypt (n=6). Data represent averages ± SD. *P < 0.05. (f) MMP7, AB and ChrA positive cells in WT and villin-gp130Act small intestines were enumerated in each villus or crypt (n=6). Data represent averages ± SD. *P < 0.05. (g) Paraffin embedded sections of WT and villin-gp130Act small intestines were analyzed by PAS and lysozyme staining. Positive cells were enumerated in each villus or crypt (n=6). Data represent averages ± SD. *P < 0.05. (h) Cryptdin mRNA in WT and villin-gp130Act jejunum was detected by in situ hybridization. (i) Transmission electron microscopy (TEM) of the apical surface of WT and Tg small intestines. Scale bars represent 100 μm (d, e, g, h) and 1 μm (i) and all data are representative of at least 2–3 independent experiments.
Extended Data Figure 2. Aberrant intestinal differentiation and activation of gp130 effectors in gp130Act mice
(a) Paraffin embedded sections of WT and villin-gp130Act small intestines were analyzed by CD45 staining. (b) Lysates of WT and villin-gp130Act jejuna were prepared, and expression of IL-6 and TNF mRNAs was analyzed by qRT-PCR (n=3). Results are averages ± SEM. *P < 0.05. (c) H&E and PAS staining of paraffin-embedded sections of WT and villin-gp130Act large intestines. (d) P-STAT1, P-ERK1/2, P-S6, and CD44 C-terminal stainings of paraffin-embedded sections of WT and villin-gp130Act small intestines. Positive cells were enumerated in each villus or crypt (n=4). Data represent averages ± SD. *P < 0.05. (e) YAP, Ki67, and P-STAT3 stainings of paraffin-embedded sections of WT and villin-gp130Act large intestines. Positive cells were enumerated in each crypt (n=4). Data represent averages ± SD. *P < 0.05. Scale bars represent 100 μm (a, c–e) and all data are representative of at least 2–3 independent experiments.
Extended Data Figure 3. IL-6 and gp130 induce Notch and YAP activation in intestinal organoids and cancer cells, and gene expression analysis of intestinal crypts
(a,b) WT and villin-gp130Act organoids were cultured, their RNA extracted, and expression of the indicated mRNA species was measured by qRT-PCR (n=3). Results are averages ± SEM. *P < 0.05. (c) Appearance of WT and villin-gp130Act small intestinal organoids cultured in standard EGF/Noggin/R-spondin 1 medium. (d) Nuclei of T84 colon cancer cells transfected with either empty vector (EV) or a vector encoding superactive gp130 (gp130SA) were lysed and subjected to IB analysis with the indicated antibodies. Lamin A, a nuclear marker. Actin, a loading control. (e) Lysates of serum-starved SW480 (upper) or DLD1 (lower) colon cancer cells treated for 0–480 min with IL-6 at 50 ng/ml were subjected to immunoblot analysis using the indicated antibodies. (f) Nuclei of serum-starved HT29 colon cancer cells treated for 24 hrs with IL-6 at 0–50 ng/ml were lysed and subjected to IB analysis with the indicated antibodies. HDAC, a nuclear marker and loading control. (g) Lysates of primary mouse hepatocytes treated for 0–120 min with IL-6 at 50 ng/ml were subjected to immunoblot analysis using the indicated antibodies. (h) Microarray analysis was performed using the Illumina MouseWG-6 v2 Expression BeadChip on RNA extracted from WT and villin-gp130Act small intestinal crypts (n=3/group). Data were normalized and analyzed as described and expression of the indicated genes is shown as fold-induction compared to WT crypts. (i) RNA was extracted from of WT and villin-gp130Act small intestinal organoids, and Areg mRNA expression was measured by qRT-PCR (n=3). Results are averages ± SEM. *P < 0.05. Scale bars represent 100 μm (c) and all data are representative of at least 2–3 independent experiments.
Extended Data Figure 4. Aberrant intestinal differentiation in gp130Act mice depends on Notch and YAP but not on STAT3
(a) MMP7 staining of paraffin-embedded sections of control and DBZ-treated (10 μmol/kg) villin-gp130Act small intestines. Positive cells were enumerated in each crypt (n=3). Data represent averages ± SD. *P < 0.05. (b) MMP7 and lysozyme staining of paraffin-embedded sections of villin-gp130Act and villin-gp130Act/YapΔIEC small intestines. Positive cells were enumerated in each crypt (n=4). Data represent averages ± SD. *P < 0.05. (c) PAS, Ki67, YAP, P-STAT3, HES1 and MMP7 staining of paraffin-embedded sections of villin-gp130Act and villin-gp130Act/Stat3ΔIEC small intestines. Positive cells were enumerated in each villus or crypt (n=4). Data represent averages ± SD. *P < 0.05. Scale bars represent 100 μm (a–c) and all data are representative of at least 2–3 independent experiments.
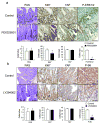
Extended Data Figure 5. MEK and PI3K inhibitors have no effect on aberrant intestinal homeostasis in gp130Act mice
(a) PAS, Ki67, YAP, and P-ERK1/2 staining of paraffin-embedded sections of control and PD0325901-treated (25 mg/kg) villin-gp130Act small intestines. Positive cells were enumerated in each villus or crypt (n=3). Data represent averages ± SD. *P < 0.05. (b) PAS, Ki67, YAP and P-S6 staining of paraffin-embedded sections of control and LY294002-treated (100 mg/kg) villin-gp130Act small intestines. Positive cells were enumerated in each villus or crypt (n=3). Data represent averages ± SD. *P < 0.05. Scale bars represent 100 μm (a, b).
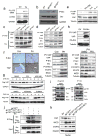
Extended Data Figure 6. gp130 activates YAP via a Hippo-independent but tyrosine phosphorylation-dependent mechanism, and gp130 interacts with Src and Yes
(a) Lysates of WT and villin-gp130Act jejuna, which are the same as the ones in Fig. 2a, were analyzed for expression and phosphorylation of the indicated proteins. (b) Lysates of HT29 colon cancer cells transfected with either empty vector (EV), active gp130 (gp130Act), or superactive gp130 (gp130SA) were subjected to IB analysis with P-Src (Y419), total Src and GAPDH antibodies. GAPDH, a loading control. (c) Lysates of HCA7 colon cancer cells infected with EV, WT gp130, gp130Act, or gp130SA lentiviruses were immunoprecipitated with anti-YAP antibody and blotted with the indicated antibodies. (d) Lysates of HT29 colon cancer cells infected with EV, WT gp130, gp130Act, or gp130SA lentiviruses were IB analyzed for expression and phosphorylation of the indicated proteins. (e) Serum-starved HCT116 cells were stimulated with 10% FBS, IL-6 (100 ng/ml), or IL-11 (100 ng/ml) for 30 min. Total cell lysates were analyzed for expression and phosphorylation of the indicated proteins. (f) Left panel: P-Src and YAP staining of livers from untreated wild-type mice (control) and wild-type mice 48 hrs after partial hepatectomy (PH). Scale bars represent 100 μm. Middle panel: Lysates of livers from control mice and mice 48 hrs after PH were subjected to immunoblot analysis with the indicated antibodies. Right panel: Lysates of livers from vehicle (DMSO)-treated and PP2-treated mice 48 hrs after PH were subjected to immunoblot analysis with the indicated antibodies (g) upper: HEK293T cells were transfected with plasmids expressing FLAG-YAP. Twenty-four hrs after transfection, the cells were pre-treated for 1 hr with 0.1% DMSO (vehicle control), PP2 (10 μM) or AZD1480 (1 μM) and then were treated with 50 μg/ml cycloheximide for different time points. Total cell lysates were subjected to IB analysis with the indicated antibodies. lower: HEK293T cells were transfected with FLAG-YAP as above. Twenty-four hrs after transfection, the cells were pre-treated for 1 hr with 0.1% DMSO (vehicle control), AZD0530 (10 μM) or SU6656 (10 μM) and then were treated with 50 μg/ml cycloheximide for different time points. Total cell lysates were analyzed as above. (h) HEK293T cells were transfected with either empty or constitutively active (CA) Src expression vectors. After 48 hrs, the cells were lysed and expression of the indicated proteins determined by IB analysis. (i) HT29 cells were collected with or without 10 ng/ml IL-6 stimulation for 2 hrs. Lysates were analyzed by IB with the indicated antibodies. These are the loading controls for the data shown in Fig. 4e. (j) HEK293T cells were transfected with expression vectors encoding Src and FLAG-tagged gp130Act, FLAG-tagged gp130Act (Δ771-811), FLAG-tagged gp130Act (Δ812-827) or empty vector. Cells were collected 48 hrs later. Cell lysates were IP’ed with FLAG antibody and analyzed by IB with the indicated antibodies. (k) Nuclei of T84 colon cancer cells transfected with empty vector (EV), gp130Act, gp130Act (Δ771-811) or gp130Act (Δ812-827) expression vectors were prepared and subjected to IB analysis with the indicated antibodies. HDAC1, a nuclear marker and loading control. All data are representative of at least 2–3 independent experiments.
Extended Data Figure 7. SFK activity is required for YAP activation
(a) Tg mice (n=4/group) were treated with PP2 (5 mg/kg) or vehicle once a day for 5 days. Small intestines were isolated, sectioned and stained as indicated. Positive cells were enumerated in each villus or crypt. Data represent averages ± SD. *P < 0.05. (b,c) WT and villin-gp130Act small intestinal organoids were treated with DMSO, AZD0530 (10 μM) (b), AZD1480 (1 μM) or DBZ (10 μM) (c) for 24 hrs, stained with YAP antibody and counter stained with DAPI and photographed under a fluorescent microscope. (d) WT and villin-gp130Act small intestinal organoids were treated with DMSO, PP2 (10 μM) and AZD1480 (1 μM) for 24 hrs. Total cell lysates were subjected to IB analysis with the indicated antibodies. (e) Serum-starved HT29 cells were pre-treated for 1 hr with 0.1% DMSO (vehicle control), AZD1480 (10 μM) or PP2 (20 μM) prior to IL-6 (10 ng/ml) stimulation for 24 hrs. Nuclear extracts of HT29 cells treated without or with IL-6 in the absence or presence of AZD1480 or PP2 were subjected to IB analysis with the indicated antibodies. Lamin A, a nuclear marker; Actin, a loading control. (f) WT and villin-gp130Act small intestinal organoids were treated with DMSO and AZD0530 (10 μM) for 24 hrs. Total cell lysates were subjected to IB analysis with the indicated antibodies. Scale bars represent 100 μm (a–c). All data are representative of at least 2–3 independent experiments.
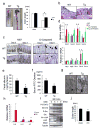
Extended Data Figure 8. gp130Act confers DSS resistance, induces Notch receptors and ligands and improves barrier function
(a) left: Representative images of WT and villin-gp130Act large intestines taken 10 days after 3.0% DSS treatment. right: Colon length of WT and villin-gp130Act mice before and after DSS treatment (before: n=5/group, after: n=4/group). Results are averages ± SEM. *P < 0.05. (b) Representative images of H&E stained paraffin-embedded colon sections prepared 10 days after DSS challenge of WT and Tg mice as described in Fig. 5a. Magnification bars: 100 μm. (c) Ki67 (left panels) and cleaved-caspase3 (right panels) stainings were performed on paraffin-embedded colon sections from WT and Tg mice at day 0 and 3 (Ki67) or 5 (cleaved-caspase3) after 3.0% DSS treatment. (d) Lysates of WT, villin-gp130Act, villin-gp130Act/YapΔIEC and villin-gp130Act/Stat3ΔIEC colons were prepared, RNA was extracted and expression of the indicated mRNA species was analyzed by qRT-PCR (n=3/group). Results are averages ± SEM. *P < 0.05 (e, f) Gut barrier function in WT and villin-gp130Act mice was examined by measurements of fecal albumin (WT: n=6, Tg: n=7) (e) and FITC-Dextran translocation to blood 4 hrs after oral gavage (WT: n=5, Tg: n=4) (f). Results are averages ± SEM. *P < 0.05. (g) TEM images of intestinal mucosa epithelial cell-cell junctions in WT and villin-gp130Act small intestines. (h) C57BL/6 mice were given regular water or 2.5% DSS for 7 days. Colonic RNA was extracted on day 10, and expression of the indicated genes was analyzed by qRT-PCR (n=4). Results are averages ± SEM. *P < 0.05. (i) WT mice were given 2.5% DSS. Colonic lysates were prepared when indicated and IB analyzed for protein expression and phosphorylation. (j) Colon length of control and PP2-injected C57BL/6 mice after DSS treatment (n=6/group). Results are averages ± SEM. *P < 0.05. Scale bars represent 100 μm (b, c) and 500 nm (g).
Extended Data Figure 9. Enhanced mucosal regeneration in gp130Act mice depends on YAP and STAT3 but the two effectors control different genes, and YAP is required for in vitro scratch closure
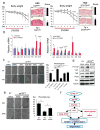
(a) Left: Body weight curves of DSS-treated YapΔIEC (□, n=6) and villin-gp130Act/YapΔIEC (○, n=4) mice. Results are averages ± SD. *P < 0.05. Colon mucosal histology of YapΔIEC (□, n=6) and villin-gp130Act/YapΔIEC (○, n=4) mice was examined by H&E staining and scored 9 days after 2.0% DSS challenge by an observer blinded to the mouse genotype. Results are averages ± SEM. *P < 0.05. Right: Body weight curves of DSS-treated Stat3ΔIEC (□) and villin-gp130Act/Stat3ΔIEC (○) mice (n=4/group). Results are averages ± SD. *P < 0.05. Mucosal histology of Stat3ΔIEC and villin-gp130Act/Stat3ΔIEC mice (n=4/group) was examined and scored 8 days after 2.0% DSS challenge as above. Results are averages ± SEM. *P < 0.05. (b) RNA was extracted from YapΔIEC and villin-gp130Act/YapΔIEC (n=3/group) or Stat3ΔIEC and villin-gp130Act/Stat3ΔIEC (n=4/group) colons, and expression of the indicated mRNA species was measured by qRT-PCR. Results are averages ± SEM. *P < 0.05. (c) IEC6 rat intestinal epithelial cells transfected with either empty (EV) or gp130Act expression vector were grown to confluence and starved overnight, and the monolayers were wounded by scratching and treated with DMSO, PP2 (10 μM), AZD1480 (1 μM), verteporfin (1 μg/ml) or DBZ (10 μM). The percent wounded area was calculated by measuring wound closure over time (0 and 24 hours). Results are averages ± SEM. *P < 0.05. (n=5). (d) Total cell lysates of IEC6 cells transfected with empty vector (EV) + shluc (control), gp130Act + shluc or gp130Act + shYAP were prepared, and subjected to IB analysis with the indicated antibodies. (e) IEC6 cells transfected with empty vector (EV) + shluc (control), gp130Act + shluc or gp130Act + shYAP were grown to confluence and starved overnight, and the monolayers were wounded by scratching. The percent wounded area was calculated by measuring wound closure over time (0 and 24 hours) (n=5). Results are averages ± SEM. *P < 0.05. (f) Schematic representation of the gp130-SFK-YAP-Notch pathway and its function in the injured intestinal epithelium. Scale bars represent 100 μm (a).
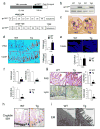
Figure 1. Persistent gp130 activation causes aberrant IEC proliferation and differentiation
(a) Wild-type (WT) and villin-gp130Act (Tg) small intestine lengths at 3 months (n=5). Data represent averages ± SEM. *P < 0.05. (b) Hematoxylin and eosin (H&E) staining of paraffin-embedded small intestinal sections from WT and Tg mice. Shown are representative images. (c, e–g) Immunohistochemical (IHC) analysis of paraffin-embedded small intestinal sections from WT and Tg mice (n=6). Ki67 and BrdU incorporation (c), Alcian blue (AB)+MMP7 and chromogranin A (ChrA) (e), Wheat germ agglutinin (WGA) (f), and alkaline phosphatase (AP) and DAPI (g) stainings. (d) Ki67 and BrdU positive cells were counted in each crypt. Data are averages ± SD. *P < 0.05. Scale bars represent 100 μm (b, c, e–g).
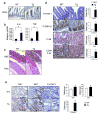
Figure 2. gp130 activates YAP and Notch signaling
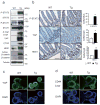
(a) Lysates of WT and Tg jejuna were analyzed for expression and phosphorylation of the indicated proteins. (b) P-STAT3, YAP and HES1 stainings of paraffin-embedded small intestinal sections (n=6). Positive cells were enumerated in each villus or crypt. Data are averages ± SD. *P < 0.05. (c, d) WT and Tg small intestinal organoids stained with YAP (c) and CD44 C-terminal (d) antibodies were examined by immunofluorescent (IF) microscopy. Scale bars represent 100 μm (b–d) and all data are representative of at least 2-3 independent experiments.
Figure 3. Notch or YAP inhibition partially restores tissue homeostasis
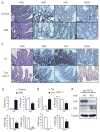
(a, b) PAS, Ki67, YAP and HES1 stainings of paraffin-embedded small intestinal sections from control and DBZ (10 μmol/kg)-treated Tg mice (n=3/group). Positive cells were enumerated in each villus or crypt (b). Data are averages ± SD. *P < 0.05. (c, d) Paraffin-embedded small intestinal sections from villin-gp130Act and villin-gp130Act/YapΔIEC mice (n=4/group) were stained and quantified as above (d). Data are averages ± SD. *P < 0.05. (e) Lysates of villin-gp130Act and villin-gp130Act/YapΔIEC jejuna were analyzed for the indicated proteins. Scale bars represent 100 μm (a, c) and all data are representative of at least 2–3 independent experiments.
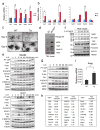
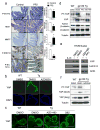
Figure 4. SFK activate YAP downstream to gp130Act and are active in human IBD
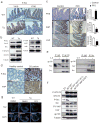
(a) IHC of activating (Y419) and inhibitory (Y530) Src phosphorylation in paraffin-embedded small intestinal sections from WT and Tg mice. (b) WT and Tg small intestinal organoids were lysed and analyzed for expression and phosphorylation of the indicated proteins. (c) Tg mice (n=4/group) were treated with PP2 (5 mg/kg) or vehicle once a day for 5 days. Small intestinal sections were stained as indicated. Positive cells were enumerated in each villus or crypt. Data are averages ± SD. *P < 0.05. (d) Normal (n=11) and CD (n=18) human colon biopsies were fixed, sectioned and stained as indicated. Src and YAP activation were found in 11/18 CD specimens in areas with active disease. (e) Co-immunoprecipitation (IP) of endogenous gp130, SFK and YAP in HT29 cells. Cells were collected with or without 2 hr IL-6 (10 ng/ml) stimulation. Lysates were IP’ed with gp130 (left) or Src (right) antibodies or corresponding IgG controls and probed with the indicated antibodies. (f) Total cell lysates of T84 colon cancer cells transfected with empty vector (EV), gp130Act, gp130Act(Δ771-811) or gp130Act(Δ812-827) expression vectors were prepared and subjected to IB analysis with the indicated antibodies. (g) WT and Tg small intestinal organoids were treated with DMSO and PP2 (10 μM) for 24 hrs, stained with YAP antibody and counter stained with DAPI. Scale bars represent 100 μm (a, c, d, g) and all data are representative of at least 2–3 independent experiments.
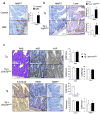
Figure 5. gp130-SFK-YAP signaling is activated upon mucosal erosion to promote regeneration
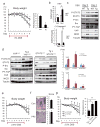
(a) Body weight curves and day 10 histological scores of DSS-treated WT (□) and Tg (○) mice (n=4/group). Results are averages ± SD. *P < 0.05. (b) Ki67 (upper panels) and cleaved-caspase3 (lower panels) stainings of colon sections from WT and Tg mice at day 0 and 3 (Ki67) or 5 (cleaved-caspase3) after 3.0% DSS treatment. Positive cells were enumerated in representative microscopic fields (magnification 200 × for Ki67 and 100 × for cleaved-caspase3) (n=6) per time point. Results are averages ± SEM. *P < 0.05. (c) WT and Tg mice were treated as above. Colonic lysates were prepared when indicated and IB analyzed for indicated proteins. (d) Lysates of YapΔIEC and villin-gp130Act/YapΔIEC, or Stat3ΔIEC and villin-gp130Act/Stat3ΔIEC colons were prepared, and IB analyzed with the indicated antibodies. Data were quantified using ImageJ software and are depicted on right as averages ± SEM (n=3/group). *P < 0.05. (e) Body weight curves of DSS-treated control (□) and PP2-injected (5 mg/kg) (○) C57BL/6 mice (n=6/group). Results are averages ± SD. *P < 0.05. (f) Mucosal histology of above mice was scored at day 10 of DSS challenge by H&E staining. Results are averages ± SEM. *P < 0.05. Scale bars represent 100 μm. (g) Body weight curves and day 9 histological scores of villin-gp130Act (○), villin-gp130Act/YapΔIEC (□) and villin-gp130Act/Stat3ΔIEC (◇) mice treated with 2.5% DSS (n=5/group). Results are averages ± SD (body weight curves) or averages ± SEM (histological scores). *P < 0.05: villin-gp130Act vs villin-gp130Act/YapΔIEC mice. #P < 0.05: villin-gp130Act vs villin-gp130Act/Stat3ΔIEC mice.
Similar articles
- gp130 Controls Cardiomyocyte Proliferation and Heart Regeneration.
Li Y, Feng J, Song S, Li H, Yang H, Zhou B, Li Y, Yue Z, Lian H, Liu L, Hu S, Nie Y. Li Y, et al. Circulation. 2020 Sep 8;142(10):967-982. doi: 10.1161/CIRCULATIONAHA.119.044484. Epub 2020 Jun 30. Circulation. 2020. PMID: 32600062 - YAP triggers the Wnt/β-catenin signalling pathway and promotes enterocyte self-renewal, regeneration and tumorigenesis after DSS-induced injury.
Deng F, Peng L, Li Z, Tan G, Liang E, Chen S, Zhao X, Zhi F. Deng F, et al. Cell Death Dis. 2018 Feb 2;9(2):153. doi: 10.1038/s41419-017-0244-8. Cell Death Dis. 2018. PMID: 29396428 Free PMC article. - Yap-dependent reprogramming of Lgr5(+) stem cells drives intestinal regeneration and cancer.
Gregorieff A, Liu Y, Inanlou MR, Khomchuk Y, Wrana JL. Gregorieff A, et al. Nature. 2015 Oct 29;526(7575):715-8. doi: 10.1038/nature15382. Epub 2015 Oct 21. Nature. 2015. PMID: 26503053 - Epithelial gp130/Stat3 functions: an intestinal signaling node in health and disease.
Ernst M, Thiem S, Nguyen PM, Eissmann M, Putoczki TL. Ernst M, et al. Semin Immunol. 2014 Feb;26(1):29-37. doi: 10.1016/j.smim.2013.12.006. Epub 2014 Jan 13. Semin Immunol. 2014. PMID: 24434062 Review.
Cited by
- A YAP/TAZ-induced feedback mechanism regulates Hippo pathway homeostasis.
Moroishi T, Park HW, Qin B, Chen Q, Meng Z, Plouffe SW, Taniguchi K, Yu FX, Karin M, Pan D, Guan KL. Moroishi T, et al. Genes Dev. 2015 Jun 15;29(12):1271-84. doi: 10.1101/gad.262816.115. Genes Dev. 2015. PMID: 26109050 Free PMC article. - Is intestinal inflammation linking dysbiosis to gut barrier dysfunction during liver disease?
Brandl K, Schnabl B. Brandl K, et al. Expert Rev Gastroenterol Hepatol. 2015;9(8):1069-76. doi: 10.1586/17474124.2015.1057122. Epub 2015 Jun 18. Expert Rev Gastroenterol Hepatol. 2015. PMID: 26088524 Free PMC article. Review. - Selective Role of Vinculin in Contractile Mechanisms of Endothelial Permeability.
Birukova AA, Shah AS, Tian Y, Gawlak G, Sarich N, Birukov KG. Birukova AA, et al. Am J Respir Cell Mol Biol. 2016 Oct;55(4):476-486. doi: 10.1165/rcmb.2015-0328OC. Am J Respir Cell Mol Biol. 2016. PMID: 27115795 Free PMC article. - Roles of JAK2 in Aging, Inflammation, Hematopoiesis and Malignant Transformation.
Perner F, Perner C, Ernst T, Heidel FH. Perner F, et al. Cells. 2019 Aug 8;8(8):854. doi: 10.3390/cells8080854. Cells. 2019. PMID: 31398915 Free PMC article. Review. - RhoA-ROCK competes with YAP to regulate amoeboid breast cancer cell migration in response to lymphatic-like flow.
Mohammadalipour A, Diaz MF, Livingston M, Ewere A, Zhou A, Horton PD, Olamigoke LT, Lamar JM, Hagan JP, Lee HJ, Wenzel PL. Mohammadalipour A, et al. FASEB Bioadv. 2022 Feb 14;4(5):342-361. doi: 10.1096/fba.2021-00055. eCollection 2022 May. FASEB Bioadv. 2022. PMID: 35520391 Free PMC article.
References
Publication types
MeSH terms
Substances
Grants and funding
- R01 AI095277/AI/NIAID NIH HHS/United States
- R00 DK088589/DK/NIDDK NIH HHS/United States
- EY022611/EY/NEI NIH HHS/United States
- CA132809/CA/NCI NIH HHS/United States
- T32 DK007202/DK/NIDDK NIH HHS/United States
- CA118165-09/CA/NCI NIH HHS/United States
- R01 CA118165/CA/NCI NIH HHS/United States
- DP2 OD008469/OD/NIH HHS/United States
LinkOut - more resources
Full Text Sources
Other Literature Sources
Molecular Biology Databases
Research Materials
Miscellaneous
