TREM2 deficiency eliminates TREM2+ inflammatory macrophages and ameliorates pathology in Alzheimer's disease mouse models - PubMed (original) (raw)
. 2015 Mar 9;212(3):287-95.
doi: 10.1084/jem.20142322. Epub 2015 Mar 2.
Crystal M Miller 2, Paul J Cheng 1, Leah C Graham 3, Shane Bemiller 4, Margaret L Broihier 5, Guixiang Xu 2, Daniel Margevicius 2, J Colleen Karlo 5, Gregory L Sousa 3, Anne C Cotleur 2, Oleg Butovsky 6, Lynn Bekris 2, Susan M Staugaitis 2, James B Leverenz 2, Sanjay W Pimplikar 1, Gary E Landreth 5, Gareth R Howell 3, Richard M Ransohoff 2, Bruce T Lamb 7
Affiliations
- PMID: 25732305
- PMCID: PMC4354365
- DOI: 10.1084/jem.20142322
TREM2 deficiency eliminates TREM2+ inflammatory macrophages and ameliorates pathology in Alzheimer's disease mouse models
Taylor R Jay et al. J Exp Med. 2015.
Abstract
Variants in triggering receptor expressed on myeloid cells 2 (TREM2) confer high risk for Alzheimer's disease (AD) and other neurodegenerative diseases. However, the cell types and mechanisms underlying TREM2's involvement in neurodegeneration remain to be established. Here, we report that TREM2 is up-regulated on myeloid cells surrounding amyloid deposits in AD mouse models and human AD tissue. TREM2 was detected on CD45(hi)Ly6C(+) myeloid cells, but not on P2RY12(+) parenchymal microglia. In AD mice deficient for TREM2, the CD45(hi)Ly6C(+) macrophages are virtually eliminated, resulting in reduced inflammation and ameliorated amyloid and tau pathologies. These data suggest a functionally important role for TREM2(+) macrophages in AD pathogenesis and an unexpected, detrimental role of TREM2 in AD pathology. These findings have direct implications for future development of TREM2-targeted therapeutics.
© 2015 Jay et al.
Figures
Figure 1.
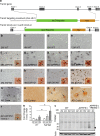
TREM2 expression is increased around Aβ plaques. (a) A novel Trem2 knockout with a LacZ reporter under the control of the Trem2 promoter was generated. (b–m) TREM2 IHC was performed in WT mice at 2 (b), 4 (c), 6 (d), and 12 mo (e) of age, in APPPS1 mice at 2 (f), 4 (g), 6 (h), and 12 mo (i) of age, and in 5XFAD mice at 2 (j), 4 (k), 6 (l), and 8 mo (m) of age (n = 4–5). Insets show Congo red costaining with arrows indicating plaques. (n–q) TREM2 was also observed around plaques (n, p, and q) but not in regions lacking Aβ deposition (o) in human AD cases (n = 2). Arrows point to Congo red–positive plaques. (r) TREM2 immunoreactivity was not observed in APPPS1;Trem2−/− mice (n = 7). Insets show Congo red costaining with arrows indicating plaques. (s and t) TREM2 expression was also assessed by qRT-PCR (s; two-way ANOVA, age P = 0.083, genotype P = 0.0036, interaction P = 0.185; Bonferroni-corrected Student’s t tests shown; n = 6–8 per group) and Western blot (t; n = 2–3). Arrowhead indicates position of TREM2-specific band. Error bars indicate SEM. *, P < 0.05. At least three independent experiments were performed for all analyses. Bars, 100 µm (bars in b and n apply to b–p and r).
Figure 2.
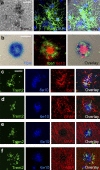
TREM2 is expressed in plaque-associated myeloid cells. (a) In situ hybridization with TREM2 probes colocalized with Iba1 (n = 2). (b) X-gal staining of brain tissue from 4-mo-old APPPS1;Trem2LacZ/+ mice colocalized with fluorescent IHC for Iba1 and 6E10 (n = 3). (c–f) Confocal microscopy was used to assess TREM2 colocalization with 6E10+ plaque-associated myeloid cells (c; Iba1), astrocytes (d; GFAP), neurons (e; MAP2), or oligodendrocytes (f; MBP; n = 8). At least two independent experiments were performed for all analyses. Bars: (a) 20 µm; (b–f) 50 µm.
Figure 3.
TREM2 is specifically expressed on CD11b+CD45hiF4/80+ macrophages in AD mice. (a and b) Isolated brain myeloid cells were gated on CD11b (a) and divided into CD45lo and CD45hi populations (b). (c and f) TREM2+ cells were exclusively CD45hi (c) and F4/80+ (f; n = 41). (d and e) TREM2 expression was quantified on CD45lo and CD45hi populations in APPPS1 mice (d; two-way ANOVA, age P < 0.0001; genotype/cell type P < 0.0001, interaction P < 0.0001; Bonferroni-corrected Student’s t tests shown; n = 2–8), 5XFAD mice (e; two-way ANOVA, age P = 0.025, genotype/cell type P < 0.0001, interaction P = 0.0003; Bonferroni-corrected Student’s t tests shown; n = 5–9), and WT controls (d and e; n = 4–14). Error bars indicate SEM. **, P < 0.01; ***, P < 0.001. (g and h) Flow cytometry on APPPS1;Trem2−/− mice (g) revealed a lack of TREM2+ cells compared with APPPS1;Trem2+/+ mice (h; n = 7). At least two independent experiments were performed for all analyses.
Figure 4.
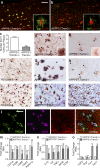
Plaque-associated myeloid cells are reduced in TREM2-deficient mice. (a–c) Confocal microscopy was used to examine Iba1 and 6E10 expression in 4-mo-old APPPS1;Trem2−/− mice (b) and APPPS1;Trem2+/+ controls (a; quantified in c). (d and e) IHC and Congo red costaining (arrows) was performed for Ly6C in APPPS1;Trem2+/+ mice (d) and APPPS1;Trem2−/− animals (e). (a, b, d, and e) Insets show higher-magnification images. (f–h) CD45 and Congo red staining (arrows) was performed in human AD tissue (f; n = 2), APPPS1;Trem2+/+ mice (g), and APPPS1;Trem2−/− mice (h). (i–k) P2RY12 and Congo red staining (arrows) was performed in human AD tissue (i; n = 2), APPPS1;Trem2+/+ mice (j), and APPPS1;Trem2−/− animals (k). (l) TREM2 colocalized with CD45 but not P2RY12. (m–o) qRT-PCR was performed on whole brain lysates to examine transcript levels of myeloid cell markers (m), proinflammatory cytokines (n), and antiinflammatory markers (o). All experiments used n = 7–8 mice per group unless otherwise noted, and at least two independent experiments were performed for all analyses. Error bars indicate SEM. *, P < 0.05; **, P < 0.01; ***, P < 0.001. Bars: (a and b) 50 µm; (d–l) 20 µm.
Figure 5.
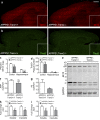
TREM2 deficiency reduces Aβ accumulation. (a) IHC with 6E10 was performed on brain slices from 4-mo-old APPPS1;Trem2+/+ and APPPS1;Trem2−/− mice (quantified in c; n = 7–8). (b) Analysis of ThioS plaque number revealed similar results (quantified in d; n = 7–8). (a and b) Insets show a higher magnification of the hippocampus. Bar, 1 mm. (e) APP and Aβ levels were assessed by Western blot using 6E10. (f and g) Quantified relative to GAPDH, there was no significant change in APP protein levels (f) but a significant reduction in Aβ (g) in APPPS1;Trem2−/− mice (n = 3–4). (h and i) ELISAs on brain lysates also showed a significant reduction in insoluble Aβ42 and a trend toward a reduction in soluble Aβ42 (h) and a trend toward a reduction in soluble and insoluble Aβ40 (i; n = 3–4). #, P < 0.10; *, P < 0.05; ***, P < 0.001. At least two independent experiments were performed for all analyses.
Figure 6.
TREM2 deficiency reduces astrocytosis and MAPT phosphorylation. (a and b) Astrocytosis was assessed in 4-mo-old APPPS1;Trem2+/+ (a) and APPPS1;Trem2−/− mice (b) using IHC for GFAP and 6E10 (n = 7–8). (c and f) The number of GFAP+ cells surrounding plaques was quantified (c; n = 3–4), and results were confirmed by qRT-PCR (f; n = 7–8). (d, e, g, and h) Hyperphosphorylated MAPT was detected in APPPS1;Trem2−/− (e and h) and APPPS1;Trem2+/+ mice (d and g) with AT8 (d and e) and AT180 antibodies (g and h; n = 7–8). Arrows indicate Congo red–positive plaques. (i) Quantification of the area of AT180 immunoreactivity revealed significant decreases in APPPS1;Trem2−/− mice (n = 3–4). At least two independent experiments were performed for all analyses. Error bars indicate SEM. *, P < 0.05; **, P < 0.01. Bar, 50 µm.
Similar articles
- Trem2 restrains the enhancement of tau accumulation and neurodegeneration by β-amyloid pathology.
Lee SH, Meilandt WJ, Xie L, Gandham VD, Ngu H, Barck KH, Rezzonico MG, Imperio J, Lalehzadeh G, Huntley MA, Stark KL, Foreman O, Carano RAD, Friedman BA, Sheng M, Easton A, Bohlen CJ, Hansen DV. Lee SH, et al. Neuron. 2021 Apr 21;109(8):1283-1301.e6. doi: 10.1016/j.neuron.2021.02.010. Epub 2021 Mar 5. Neuron. 2021. PMID: 33675684 - Role of TREM2 in Alzheimer's Disease and its Consequences on β- Amyloid, Tau and Neurofibrillary Tangles.
Singh AK, Mishra G, Maurya A, Awasthi R, Kumari K, Thakur A, Rai A, Rai GK, Sharma B, Kulkarni GT, Singh SK. Singh AK, et al. Curr Alzheimer Res. 2019;16(13):1216-1229. doi: 10.2174/1567205016666190903102822. Curr Alzheimer Res. 2019. PMID: 31481003 Review. - Disease Progression-Dependent Effects of TREM2 Deficiency in a Mouse Model of Alzheimer's Disease.
Jay TR, Hirsch AM, Broihier ML, Miller CM, Neilson LE, Ransohoff RM, Lamb BT, Landreth GE. Jay TR, et al. J Neurosci. 2017 Jan 18;37(3):637-647. doi: 10.1523/JNEUROSCI.2110-16.2016. J Neurosci. 2017. PMID: 28100745 Free PMC article. - TREM2 modifies microglial phenotype and provides neuroprotection in P301S tau transgenic mice.
Jiang T, Zhang YD, Chen Q, Gao Q, Zhu XC, Zhou JS, Shi JQ, Lu H, Tan L, Yu JT. Jiang T, et al. Neuropharmacology. 2016 Jun;105:196-206. doi: 10.1016/j.neuropharm.2016.01.028. Epub 2016 Jan 21. Neuropharmacology. 2016. PMID: 26802771 - New insights into the role of TREM2 in Alzheimer's disease.
Gratuze M, Leyns CEG, Holtzman DM. Gratuze M, et al. Mol Neurodegener. 2018 Dec 20;13(1):66. doi: 10.1186/s13024-018-0298-9. Mol Neurodegener. 2018. PMID: 30572908 Free PMC article. Review.
Cited by
- Association of APOE With Primary Open-Angle Glaucoma Suggests a Protective Effect for APOE ε4.
Margeta MA, Letcher SM, Igo RP Jr, Cooke Bailey JN, Pasquale LR, Haines JL, Butovsky O, Wiggs JL; NEIGHBORHOOD consortium. Margeta MA, et al. Invest Ophthalmol Vis Sci. 2020 Jul 1;61(8):3. doi: 10.1167/iovs.61.8.3. Invest Ophthalmol Vis Sci. 2020. PMID: 32614373 Free PMC article. - MEK1/2 activity modulates TREM2 cell surface recruitment.
Schapansky J, Grinberg YY, Osiecki DM, Freeman EA, Walker SG, Karran E, Gopalakrishnan SM, Talanian RV. Schapansky J, et al. J Biol Chem. 2021 Jan-Jun;296:100218. doi: 10.1074/jbc.RA120.014352. Epub 2020 Dec 25. J Biol Chem. 2021. PMID: 33839686 Free PMC article. - Knowledge gaps in Alzheimer's disease immune biomarker research.
Morgan DG, Mielke MM. Morgan DG, et al. Alzheimers Dement. 2021 Dec;17(12):2030-2042. doi: 10.1002/alz.12342. Epub 2021 May 13. Alzheimers Dement. 2021. PMID: 33984178 Free PMC article. Review. - The novel monoclonal antibody 9F5 reveals expression of a fragment of GPNMB/osteoactivin processed by furin-like protease(s) in a subpopulation of microglia in neonatal rat brain.
Kawahara K, Hirata H, Ohbuchi K, Nishi K, Maeda A, Kuniyasu A, Yamada D, Maeda T, Tsuji A, Sawada M, Nakayama H. Kawahara K, et al. Glia. 2016 Nov;64(11):1938-61. doi: 10.1002/glia.23034. Epub 2016 Jul 27. Glia. 2016. PMID: 27464357 Free PMC article. - Colony-stimulating factor 1 receptor inhibition prevents microglial plaque association and improves cognition in 3xTg-AD mice.
Dagher NN, Najafi AR, Kayala KM, Elmore MR, White TE, Medeiros R, West BL, Green KN. Dagher NN, et al. J Neuroinflammation. 2015 Aug 1;12:139. doi: 10.1186/s12974-015-0366-9. J Neuroinflammation. 2015. PMID: 26232154 Free PMC article.
References
Publication types
MeSH terms
Substances
Grants and funding
- AG023012/AG/NIA NIH HHS/United States
- R01 NS088137/NS/NINDS NIH HHS/United States
- NS047804/NS/NINDS NIH HHS/United States
- T32 NS077888/NS/NINDS NIH HHS/United States
- T32 NS067431/NS/NINDS NIH HHS/United States
- NS087298/NS/NINDS NIH HHS/United States
- T32 GM007250/GM/NIGMS NIH HHS/United States
- F31 AG048704/AG/NIA NIH HHS/United States
- R01 AG023012/AG/NIA NIH HHS/United States
- UL1 TR000439/TR/NCATS NIH HHS/United States
LinkOut - more resources
Full Text Sources
Other Literature Sources
Medical
Molecular Biology Databases
Research Materials
Miscellaneous


