The contribution of cohesin-SA1 to gene expression and chromatin architecture in two murine tissues - PubMed (original) (raw)
. 2015 Mar 31;43(6):3056-67.
doi: 10.1093/nar/gkv144. Epub 2015 Mar 3.
Affiliations
- PMID: 25735743
- PMCID: PMC4381060
- DOI: 10.1093/nar/gkv144
The contribution of cohesin-SA1 to gene expression and chromatin architecture in two murine tissues
Ana Cuadrado et al. Nucleic Acids Res. 2015.
Abstract
Cohesin, which in somatic vertebrate cells consists of SMC1, SMC3, RAD21 and either SA1 or SA2, mediates higher-order chromatin organization. To determine how cohesin contributes to the establishment of tissue-specific transcriptional programs, we compared genome-wide cohesin distribution, gene expression and chromatin architecture in cerebral cortex and pancreas from adult mice. More than one third of cohesin binding sites differ between the two tissues and these show reduced overlap with CCCTC-binding factor (CTCF) and are enriched at the regulatory regions of tissue-specific genes. Cohesin/CTCF sites at active enhancers and promoters contain, at least, cohesin-SA1. Analyses of chromatin contacts at the Protocadherin (Pcdh) and Regenerating islet-derived (Reg) gene clusters, mostly expressed in brain and pancreas, respectively, revealed remarkable differences that correlate with the presence of cohesin. We could not detect significant changes in the chromatin contacts at the Pcdh locus when comparing brains from wild-type and SA1 null embryos. In contrast, reduced dosage of SA1 altered the architecture of the Reg locus and decreased the expression of Reg genes in the pancreas of SA1 heterozygous mice. Given the role of Reg proteins in inflammation, such reduction may contribute to the increased incidence of pancreatic cancer observed in these animals.
© The Author(s) 2015. Published by Oxford University Press on behalf of Nucleic Acids Research.
Figures
Figure 1.
A large fraction of genomic cohesin positions are tissue-specific. (A) Number of cohesin SMC1 and SA1 positions in cerebral cortex and pancreas from 10 week-old mice obtained by ChIP-seq. Two replicates corresponding to independent experiments containing tissue from at least three individuals were performed. (B) Venn diagrams showing the overlap between SMC1 and SA1 positions in each tissue and between tissues. For cohesin and CTCF peaks (see Supplementary Figure S1), overlap is defined as reciprocal coincidence over at least 50% of peak length. (C) UCSC genome browser images illustrating cortex-specific (upper panel) and pancreas-specific (lower panel) cohesin positions located in chromosomes 11 and 15, respectively. The values for ChIP-seq data (y-axis) are normalized to input.
Figure 2.
Cohesin is enriched at the promoters of actively transcribed genes. (A) Transcriptional profiles from the cortex (left) and pancreas (right) of 10-week-old mice were determined by RNA-seq. Tissue-specific genes were selected for each tissue (see main text for details) and further confirmed by Gene Ontology analysis. (B) Cohesin distribution around the TSS (±6 kb) of genes expressed specifically in cortex (upper panels) and pancreas (lower panels) defined as peak frequency (%). Both SMC1 and SA1 distributions are shown. (C) Gene expression changes between wild-type and SA1 null brains (KO) from E17.5 embryos were characterized by RNA-seq (FDR < 0.05). (D) Cohesin distribution around the TSS of genes found to be down-regulated (left) and up-regulated (right) in SA1 null embryonic brains.
Figure 3.
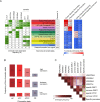
Cohesin is present at active promoters and enhacers. (A) Chromatin profiling in adult cortex by means of Hidden Markov Model (HMM) led to define 13 chromatin states (shown in different colours) according to the observed frequency of different chromatin marks (H3K4Me1, H3K4Me3, H3K27Me3, H3K27Ac), CTCF and cohesin SMC1 and SA1. The numbers in the table on the left correspond to the frequency with which a given mark is found at genomic positions corresponding to the chromatin state, annotated on the middle and assigned a colour code. Green shading indicates intensity (0–100). Genome% indicates the percentage of the genome corresponding to each chromatin state. The columns on the right show the functional enrichment of each chromatin state in cortex and pancreas-specific promoters (as selected in Figure 2) and cortex and small-intestine enhancers (as defined in (9)). (*) The sate named ‘CTCF&CohesinSA1’ contains, at least, cohesin-SA1 but it may also contain cohesin-SA2. (B) Genes were classified into quartiles according to their expression levels, obtained by RNA-seq, as follows: Q1, FPKM = 0 (n = 18 361), no expression; Q2, 0<FPKM≤0.296312 (_n_ = 7316), low expression; Q3, 0.296312<FPKM≤6.032485 (_n_ = 9315), moderate expression; Q4, FPKM>6.032485 (n = 9316), high expression. The frequency of the indicated chromatin states is shown for the quartiles containing expressed genes (Q1–Q3). AP, active promoters; APC, active promoters with cohesin; APCC, active promoters with cohesin and CTCF; PR, Polycomb repressed. (C) Heat-map visualization of the pairwise overlap between cerebral cortex chromatin marks and cortex-specific and non-specific (‘common’) cohesin and CTCF positions. Comparisons mentioned in the main text are highlighted by coloured rectangles.
Figure 4.
Chromatin architecture of the Pcdh locus in adult cortex and pancreas. (A) Details of the chromosome 18qB3 region containing the mouse Pcdh alpha, beta and gamma clusters. HS5–1 and HS16–20 enhancer regions are shown. (B) Upper panel: chromatin interactions detected by 4C-seq in cerebral cortex and pancreas using a 20-kb window size in the main trend subpanel. Red arrowheads indicate viewpoint positions. Middle and bottom panels show cohesin positions (defined by ChIP-seq) and gene expression (obtained by RNA-seq), respectively.
Figure 5.
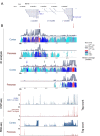
Chromatin architecture of the Reg locus in adult cortex and pancreas. (A) Levels of cohesin were assayed by immunoblot with SA1 and Rad21 antibodies in pancreas from wild-type and SA1 heterozygous mice (two individuals per genotype). GAPDH serves as loading control. (B) Table showing the four genes differentially expressed (FDR < 0.15) in pancreas from 10-week-old wild-type and SA1 heterozygous mice. (C) Validation of transcriptional changes in Reg genes by RT-qPCR. At least three individuals per condition were analysed. A two-tailed Student's _t_-test was applied. Data are shown as mean ± SEM (standard error of the mean). (D) The amount of cohesin SA1 and SMC1 at the sites in the Reg locus marked in (E) was analysed by ChIP-qPCR in the pancreas of wild-type and SA1 heterozygous mice. At least four animals per condition were used for the analysis. (E) Cohesin distribution across the Reg locus in cortex and pancreas, as determined by ChIP-seq. CTCF binding sites are also indicated. Black lines specify the position of primer pairs (1, 2 and 3) used in (D). The lower panel shows the analysis of the three-dimensional organization of the Reg locus in pancreas from wild-type and SA1 heterozygous mice by 4C-seq. Main trend corresponds to a 5-kb window size. The position of the viewpoint (VP2) is indicated (green arrow).
Similar articles
- A unique role of cohesin-SA1 in gene regulation and development.
Remeseiro S, Cuadrado A, Gómez-López G, Pisano DG, Losada A. Remeseiro S, et al. EMBO J. 2012 May 2;31(9):2090-102. doi: 10.1038/emboj.2012.60. Epub 2012 Mar 13. EMBO J. 2012. PMID: 22415368 Free PMC article. - The specific contributions of cohesin-SA1 to cohesion and gene expression: implications for cancer and development.
Cuadrado A, Remeseiro S, Gómez-López G, Pisano DG, Losada A. Cuadrado A, et al. Cell Cycle. 2012 Jun 15;11(12):2233-8. doi: 10.4161/cc.20318. Epub 2012 Jun 15. Cell Cycle. 2012. PMID: 22617390 - Distinct roles of cohesin-SA1 and cohesin-SA2 in 3D chromosome organization.
Kojic A, Cuadrado A, De Koninck M, Giménez-Llorente D, Rodríguez-Corsino M, Gómez-López G, Le Dily F, Marti-Renom MA, Losada A. Kojic A, et al. Nat Struct Mol Biol. 2018 Jun;25(6):496-504. doi: 10.1038/s41594-018-0070-4. Epub 2018 Jun 4. Nat Struct Mol Biol. 2018. PMID: 29867216 Free PMC article. - Genome-wide studies of CCCTC-binding factor (CTCF) and cohesin provide insight into chromatin structure and regulation.
Lee BK, Iyer VR. Lee BK, et al. J Biol Chem. 2012 Sep 7;287(37):30906-13. doi: 10.1074/jbc.R111.324962. Epub 2012 Sep 5. J Biol Chem. 2012. PMID: 22952237 Free PMC article. Review. - Cohesin ties up the genome.
Carretero M, Remeseiro S, Losada A. Carretero M, et al. Curr Opin Cell Biol. 2010 Dec;22(6):781-7. doi: 10.1016/j.ceb.2010.07.004. Epub 2010 Jul 31. Curr Opin Cell Biol. 2010. PMID: 20675112 Review.
Cited by
- Three-dimensional chromatin mapping of sensory neurons reveals that promoter-enhancer looping is required for axonal regeneration.
Palmisano I, Liu T, Gao W, Zhou L, Merkenschlager M, Mueller F, Chadwick J, Toscano Rivalta R, Kong G, King JWD, Al-Jibury E, Yan Y, Carlino A, Collison B, De Vitis E, Gongala S, De Virgiliis F, Wang Z, Di Giovanni S. Palmisano I, et al. Proc Natl Acad Sci U S A. 2024 Sep 17;121(38):e2402518121. doi: 10.1073/pnas.2402518121. Epub 2024 Sep 10. Proc Natl Acad Sci U S A. 2024. PMID: 39254997 - Cornelia de Lange syndrome: Correlation of brain MRI findings with behavioral assessment.
Roshan Lal TR, Kliewer MA, Lopes T, Rebsamen SL, O'Connor J, Grados MA, Kimball A, Clemens J, Kline AD. Roshan Lal TR, et al. Am J Med Genet C Semin Med Genet. 2016 Jun;172(2):190-7. doi: 10.1002/ajmg.c.31503. Epub 2016 May 10. Am J Med Genet C Semin Med Genet. 2016. PMID: 27164360 Free PMC article. - Improved transcription and translation with L-leucine stimulation of mTORC1 in Roberts syndrome.
Xu B, Gogol M, Gaudenz K, Gerton JL. Xu B, et al. BMC Genomics. 2016 Jan 5;17:25. doi: 10.1186/s12864-015-2354-y. BMC Genomics. 2016. PMID: 26729373 Free PMC article. - Rewiring of the promoter-enhancer interactome and regulatory landscape in glioblastoma orchestrates gene expression underlying neurogliomal synaptic communication.
Chakraborty C, Nissen I, Vincent CA, Hägglund AC, Hörnblad A, Remeseiro S. Chakraborty C, et al. Nat Commun. 2023 Oct 13;14(1):6446. doi: 10.1038/s41467-023-41919-x. Nat Commun. 2023. PMID: 37833281 Free PMC article. - Cohesin Mutations in Cancer.
De Koninck M, Losada A. De Koninck M, et al. Cold Spring Harb Perspect Med. 2016 Dec 1;6(12):a026476. doi: 10.1101/cshperspect.a026476. Cold Spring Harb Perspect Med. 2016. PMID: 27742736 Free PMC article. Review.
References
- Fraser P., Bickmore W. Nuclear organization of the genome and the potential for gene regulation. Nature. 2007;447:413–417. - PubMed
- Spitz F., Furlong E.E. Transcription factors: from enhancer binding to developmental control. Nat. Rev. Genet. 2012;13:613–626. - PubMed
Publication types
MeSH terms
Substances
LinkOut - more resources
Full Text Sources
Other Literature Sources
Molecular Biology Databases
Miscellaneous


