Evolution and phenotypic selection of cancer stem cells - PubMed (original) (raw)
Evolution and phenotypic selection of cancer stem cells
Jan Poleszczuk et al. PLoS Comput Biol. 2015.
Abstract
Cells of different organs at different ages have an intrinsic set of kinetics that dictates their behavior. Transformation into cancer cells will inherit these kinetics that determine initial cell and tumor population progression dynamics. Subject to genetic mutation and epigenetic alterations, cancer cell kinetics can change, and favorable alterations that increase cellular fitness will manifest themselves and accelerate tumor progression. We set out to investigate the emerging intratumoral heterogeneity and to determine the evolutionary trajectories of the combination of cell-intrinsic kinetics that yield aggressive tumor growth. We develop a cellular automaton model that tracks the temporal evolution of the malignant subpopulation of so-called cancer stem cells(CSC), as these cells are exclusively able to initiate and sustain tumors. We explore orthogonal cell traits, including cell migration to facilitate invasion, spontaneous cell death due to genetic drift after accumulation of irreversible deleterious mutations, symmetric cancer stem cell division that increases the cancer stem cell pool, and telomere length and erosion as a mitotic counter for inherited non-stem cancer cell proliferation potential. Our study suggests that cell proliferation potential is the strongest modulator of tumor growth. Early increase in proliferation potential yields larger populations of non-stem cancer cells(CC) that compete with CSC and thus inhibit CSC division while a reduction in proliferation potential loosens such inhibition and facilitates frequent CSC division. The sub-population of cancer stem cells in itself becomes highly heterogeneous dictating population level dynamics that vary from long-term dormancy to aggressive progression. Our study suggests that the clonal diversity that is captured in single tumor biopsy samples represents only a small proportion of the total number of phenotypes.
Conflict of interest statement
The authors have declared that no competing interests exist.
Figures
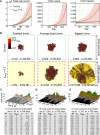
Fig 1. A) Tumor growth curves, cancer stem cell (CSC) number and fraction as a function of time for tumors without evolution (control, green solid curve) and with evolution probability of 50% (pmut = 0.5, red dashed curve).
B) Simulation snapshots of the smallest, an average-sized and biggest tumor in the control and evolved tumor at t = 730 days. s: number of cancer stem cells; n: number of total cancer cells. C) Temporal evolution of the 28 phenotypes in the smallest evolved tumor and trait details of the 10 most common phenotypes. D) Temporal evolution of the 1000 most common phenotypes at t = 730 days in an evolved averaged-sized tumor and trait details of the 10 most common phenotypes. E) Temporal evolution of the 1000 most common phenotypes at t = 730 days in the biggest evolved tumor and trait details of the 10 most common phenotypes.
Fig 2. A) Evolution of cancer stem cell traits in the biggest (solid blue curve), an average-sized (red dashed) and the smallest tumor (green dot-dashed).
ps: probability of symmetric division; ρmax: proliferation potential; μ: migration rate, α: spontaneous cell death probability. B) Cancer stem cell count over time in the biggest (solid blue curve), an average-sized (red dashed) and the smallest tumor (green dot-dashed). C) Correlation of tumor size with each average trait parameter. ***p<0.001; *p<0.05.
Fig 3. Parameter distribution in the biggest evolved tumor at t = 730 days.
Plots below the diagonal show the parameter pair prevalence in the tumor as well as the evolutionary trajectory of the parameter pair (+ marks the initial condition). Plots above the diagonal show the color-coded morphological distribution of parameter pairs in the final tumor. Colors as in corresponding plots below the diagonal.
Fig 4. A) Distribution of average parameter values and standard deviations in biopsy samples taken at 5-degree intervals around the tumor.
Color-coded heat map to further emphasize variation. ps: probability of symmetric division; ρmax: proliferation potential; μ: migration rate, α: spontaneous cell death probability. B) Fraction of captured phenotypes (ratio of unique phenotypes in a sample to the total number of unique phenotypes in the whole tumor) and fraction of cancer stem cells (ratio of CSC count to the total cell count within the collected sample) in biopsy samples taken at 5-degree intervals around the tumor. C) Average fraction of phenotypes captured with multiple equally distant biopsies within a 90-degrees tumor quadrant. D) Different tumor growth dynamics of re-seeded subpopulations from biopsy samples (10 subpopulations, ~10,000 cells each) taken at 135° (orange) and 240° (green).
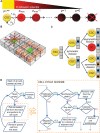
Fig 5. A) Schematic of the cellular hierarchy and proliferation potential attrition in the non-stem cancer cell population.
B) Schematic representation of competition for space in a regular lattice. C) Schematic of the division-dependent trait evolution. Only during symmetric CSC divisions traits are subject to evolution. D) Schematic of the simulation procedure and cell cycle evaluations.
Similar articles
- Non-stem cancer cell kinetics modulate solid tumor progression.
Morton CI, Hlatky L, Hahnfeldt P, Enderling H. Morton CI, et al. Theor Biol Med Model. 2011 Dec 30;8:48. doi: 10.1186/1742-4682-8-48. Theor Biol Med Model. 2011. PMID: 22208390 Free PMC article. - Cancer Stem Cells: A Minor Cancer Subpopulation that Redefines Global Cancer Features.
Enderling H, Hlatky L, Hahnfeldt P. Enderling H, et al. Front Oncol. 2013 Apr 15;3:76. doi: 10.3389/fonc.2013.00076. eCollection 2013. Front Oncol. 2013. PMID: 23596563 Free PMC article. - A multicompartment mathematical model of cancer stem cell-driven tumor growth dynamics.
Weekes SL, Barker B, Bober S, Cisneros K, Cline J, Thompson A, Hlatky L, Hahnfeldt P, Enderling H. Weekes SL, et al. Bull Math Biol. 2014 Jul;76(7):1762-82. doi: 10.1007/s11538-014-9976-0. Epub 2014 May 20. Bull Math Biol. 2014. PMID: 24840956 Free PMC article. - Cell plasticity and heterogeneity in cancer.
Marjanovic ND, Weinberg RA, Chaffer CL. Marjanovic ND, et al. Clin Chem. 2013 Jan;59(1):168-79. doi: 10.1373/clinchem.2012.184655. Epub 2012 Dec 6. Clin Chem. 2013. PMID: 23220226 Free PMC article. Review. - Cancer stem cells: A product of clonal evolution?
van Niekerk G, Davids LM, Hattingh SM, Engelbrecht AM. van Niekerk G, et al. Int J Cancer. 2017 Mar 1;140(5):993-999. doi: 10.1002/ijc.30448. Epub 2016 Oct 12. Int J Cancer. 2017. PMID: 27676693 Review.
Cited by
- Agent-based modeling of the prostate tumor microenvironment uncovers spatial tumor growth constraints and immunomodulatory properties.
van Genderen MNG, Kneppers J, Zaalberg A, Bekers EM, Bergman AM, Zwart W, Eduati F. van Genderen MNG, et al. NPJ Syst Biol Appl. 2024 Feb 21;10(1):20. doi: 10.1038/s41540-024-00344-6. NPJ Syst Biol Appl. 2024. PMID: 38383542 Free PMC article. - A circuit for secretion-coupled cellular autonomy in multicellular eukaryotic cells.
Qiao L, Sinha S, Abd El-Hafeez AA, Lo IC, Midde KK, Ngo T, Aznar N, Lopez-Sanchez I, Gupta V, Farquhar MG, Rangamani P, Ghosh P. Qiao L, et al. Mol Syst Biol. 2023 Apr 12;19(4):e11127. doi: 10.15252/msb.202211127. Epub 2023 Mar 1. Mol Syst Biol. 2023. PMID: 36856068 Free PMC article. - Cancer Stem Cells and Cell Cycle Genes as Independent Predictors of Relapse in Non-small Cell Lung Cancer: Secondary Analysis of a Prospective Study.
Masciale V, Banchelli F, Grisendi G, D'Amico R, Maiorana A, Stefani A, Morandi U, Stella F, Dominici M, Aramini B. Masciale V, et al. Stem Cells Transl Med. 2022 Aug 23;11(8):797-804. doi: 10.1093/stcltm/szac040. Stem Cells Transl Med. 2022. PMID: 35674389 Free PMC article. - Molecular mechanism of therapeutic approaches for human gastric cancer stem cells.
Hsieh HL, Yu MC, Cheng LC, Yeh TS, Tsai MM. Hsieh HL, et al. World J Stem Cells. 2022 Jan 26;14(1):76-91. doi: 10.4252/wjsc.v14.i1.76. World J Stem Cells. 2022. PMID: 35126829 Free PMC article. Review. - Cancer Stem Cells in Tumor Modeling: Challenges and Future Directions.
Dogan E, Kisim A, Bati-Ayaz G, Kubicek GJ, Pesen-Okvur D, Miri AK. Dogan E, et al. Adv Nanobiomed Res. 2021 Nov;1(11):2100017. doi: 10.1002/anbr.202100017. Epub 2021 Jun 23. Adv Nanobiomed Res. 2021. PMID: 34927168 Free PMC article.
References
- Hayflick L, Moorhead PS (1961) The serial cultivation of human diploid cell strains. Experimental Cell Research 25: 585–621. - PubMed
- Hayflick L (1965) The limited in vitro lifetime of human diploid cell strains. Experimental Cell Research 37: 614–636. - PubMed
- Bernard S, Bélair J, Mackey MC (2003) Oscillations in cyclical neutropenia: new evidence based on mathematical modeling. Journal of Theoretical Biology 223: 283–298. - PubMed
- Reya T, Morrison SJ, Clarke MF, Weissman IL (2001) Stem cells, cancer, and cancer stem cells. Nature 414: 105–111. - PubMed
Publication types
MeSH terms
LinkOut - more resources
Full Text Sources
Other Literature Sources


