PAK1 regulates RUFY3-mediated gastric cancer cell migration and invasion - PubMed (original) (raw)
PAK1 regulates RUFY3-mediated gastric cancer cell migration and invasion
G Wang et al. Cell Death Dis. 2015.
Abstract
Actin protrusion at the cell periphery is central to the formation of invadopodia during tumor cell migration and invasion. Although RUFY3 (RUN and FYVE domain containing 3)/SINGAR1 (single axon-related1)/RIPX (Rap2 interacting protein X) has an important role in neuronal development, its pathophysiologic role and relevance to cancer are still largely unknown. The purpose of this study was to elucidate the molecular mechanisms by which RUFY3 involves in gastric cancer cell migration and invasion. Here, our data show that overexpression of RUFY3 leads to the formation of F-actin-enriched protrusive structures at the cell periphery and induces gastric cancer cell migration. Furthermore, P21-activated kinase-1 (PAK1) interacts with RUFY3, and promotes RUFY3 expression and RUFY3-induced gastric cancer cell migration; inhibition of PAK1 attenuates RUFY3-induced SGC-7901 cell migration and invasion. Importantly, we found that the inhibitory effect of cell migration and invasion is significantly enhanced by knockdown of both PAK1 and RUFY3 compared with knockdown of RUFY3 alone or PAK1 alone. Strikingly, we found significant upregulation of RUFY3 in gastric cancer samples with invasive carcinoma at pathologic TNM III and TNM IV stages, compared with their non-tumor counterparts. Moreover, an obvious positive correlation was observed between the protein expression of RUFY3 and PAK1 in 40 pairs of gastric cancer samples. Therefore, these findings provide important evidence that PAK1 can positively regulate RUFY3 expression, which contribute to the metastatic potential of gastric cancer cells, maybe blocking PAK1-RUFY3 signaling would become a potential metastasis therapeutic strategy for gastric cancer.
Figures
Figure 1
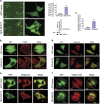
Overexpression of RUFY3 induces the formation of F-actin-enriched protrusion at the cell periphery. (a) GFP-RUFY3 localizes in F-actin-enriched invadopodia at the cell periphery of SGC-7901 cells. (Left panel) The living cell image acquisition was performed at 25 °C with SGC-7901 cells transfected with GFP-RUFY3 and undergoing a scratch wound assay, and GFP vector was used as a control. A representative image was shown. The white boxed areas in the left images ( × 100; scale bars, 200 _μ_m) are magnified in the right images ( × 600; scale bars, 24 _μ_m). The red boxed area in the right images shows that the cells expressing GFP-RUFY3 can localize at the periphery in a scratch area. (Right panel) Histogram showed the relative percentage of cells with actin protrusion at the migrating edge. Data are the average of at least three independent experiments with similar results, in which ~100 cells were counted (**P<0.01, compared with GFP vector). Protein expression was confirmed by western blotting assays using GFP-tagged antibody when equal glyceraldehyde 3-phosphate dehydrogenase (GAPDH) was used as the endogenous reference protein. (b and c) RUFY3 colocalizes with F-actin at the cell periphery. SGC-7901 cells were transiently transfected with pEGFP-C1 or pEGFP-RUFY3. Rhodamine-conjugated phalloidin was used to detect F-actin. After 24 h transfection, cells were fixed and permeabilized. (b) Images were captured using a scanning confocal fluorescence microscope and one confocal section is shown in each image. Scale bars, 10 _μ_m. (c) Histogram showed the relative percentage of colocalization cells expressing GFP-RUFY3 with F-actin at the cell periphery. The data show mean±S.E.M. (**P<0.01, compared with GFP vector), in which ~40 transfected cells were observed. (d) Colocalization of GFP-RIPX and myosinIIb at the cell periphery is shown by confocal microscopy. SGC-7901 cells were transiently transfected with GFP vector or GFP-RIPX. Colocalization of myosinIIb (red) with GFP-RIPX is shown by yellow fluorescence. Scale bars, 10 _μ_m. (e) Colocalization of GFP-RIPX and integrin _β_5 at the cell periphery by plating cells on vitronectin is observed by confocal microscopy. SGC-7901 cells were transiently transfected with GFP vector or GFP-RIPX. Colocalization of integrin _β_5 (red) with GFP-RIPX is shown by yellow fluorescence. Scale bars, 20 _μ_m. (f) Colocalization of GFP-RIPX and integrin _α_3_β_1 at the cell periphery by plating cells on vitronectin is observed by confocal microscopy. Scale bars, 20 _μ_m
Figure 2
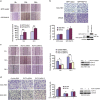
RUFY3 affects gastric cancer cell migration and invasion (a and b) Overexpression of RUFY3 promotes gastric cancer cell migration and invasion. (a) Cell motility was determined by assay measuring cell migration into the wound. (Upper panel) Representative photomicrographs of wound-healing results were taken under × 200 original magnification. Scale bars, 50 _μ_m. (Down panel) Histogram showed the percentage of wound closure. Data are the average of at least three independent experiments with similar results (*P <0.05, **P<0.01, compared with 0 h). (b) Cell invasion was determined by transwell assay with SGC-7901 and MKN45 cells transfected with pEGFP-vector or pEGFP-RUFY3. (Upper panel) Photographs represented the cells that traveled through the micropore membrane. Representative photomicrographs of transwell results were taken under × 200 original magnifications. Scale bars, 50 _μ_m. (Down panel) Number of invading cells is shown. The number of cells was counted in 16 independent symmetrical visual fields under the microscope ( × 400 original magnification) from three independent experiments (*P <0.05, **P<0.01, compared with control vector). Protein expression was confirmed by western blotting assays using GFP-tagged antibody when equal glyceraldehyde 3-phosphate dehydrogenase (GAPDH) was used as the endogenous reference protein. (c and d) Knockdown of RUFY3 inhibits gastric cancer cell migration and invasion. The different shRNAs (nos. 1 and 2) targeting RUFY3 were transfected into SGC-7901 and BGC-823 cells to perform the wound-healing and transwell invasion assays. (c) Photographs represented the cells migrating into the wounded area. (Left panel) Representative photomicrographs of wound-healing results were taken under × 200 original magnification. Scale bars, 50 _μ_m. (Middle panel) Histogram showed the relative migration distance of cells. Data are the average of at least three independent experiments with similar results (*P <0.05, **P<0.01, compared with 0 h). (Right panel) The efficacy of the RNAi of RUFY3 in SGC-7901 cells were determined by western blotting analysis using specific RUFY3 antibody, and the equal GAPDH was used as the endogenous reference protein.(d) Photographs represented the cells that traveled through the micropore membrane. (Left panel) Representative photomicrographs of transwell results were taken under × 200 original magnifications. Scale bars, 50 _μ_m. (Middle panel) Number of invading cells is shown. The number of cells was counted in 16 independent symmetrical visual fields under the microscope ( × 400 original magnifications) from three independent experiments (*P <0.05, **P<0.01, compared with control vector). (Right panel) The efficacy of the RNAi of RUFY3 in BGC-823 cells were determined by western blotting analysis using specific RUFY3 antibody, and the equal GAPDH was used as the endogenous reference protein
Figure 3
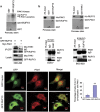
PAK1 can associate with RUFY3 in vitro and in vivo. (a) PAK1 phosphorylates RUFY3 in vitro. Glutathione _S_-transferase (GST) and GST-RUFY3 were used as PAK1 substrates in PAK1 kinase assay. (b) A specific interaction between RUFY3 and PAK1 was demonstrated by in vitro GST assay. Asterisks indicate GST, GST-RUFY3 and GST-PAK1 bands, and ponceau staining indicates the loading amounts. (Left panel) _In vitro_-translated His-PAK1 binds to purified GST-RUFY3. (Right panel) _In-vitro_-translated His-RUFY3 specifically interacts with GST-PAK1. (c) GFP-RUFY3 was co-precipitated with myc-PAK1. The cell lysate from HEK293 cells transfected with myc-PAK1 and GFP-RUFY3 were incubated with anti-GFP antibody. The immunoprecipitates were analyzed by western blot with anti-myc and anti-GFP antibodies. (d) Co-IP assays to identify endogenous PAK1 interacting with endogenous RUFY3 in COS-7 cells (left panel) and BGC-823 cells (right panel). In vivo anti-PAK1 antibody or anti-RUFY3 antibody immunoprecipitates endogenous RUFY3 or PAK1. Immunoblots were carried out as indicated. (e) Colocalization of PAK1 with GFP-RUFY3 at the cell periphery is shown by confocal microscopy. SGC-7901 cells were transiently transfected with GFP vector or GFP-RUFY3. (Left panel) Colocalization of PAK1 (red) with GFP-RUFY3 is shown by yellow fluorescence. Scale bars, 10 _μ_m. (Right panel) Histogram showed the relative percentage of colocalization cells expressing GFP-RUFY3 with PAK1 at the cell periphery. The data show mean±S.E.M. (**P<0.01, compared with GFP vector), in which ~40 transfected cells were observed
Figure 4
PAK1 positively regulates RUFY3 expression. (a and b) The protein level of RUFY3 was increased by the ectopic PAK1 expression level enhancing. (a) A dose-dependent increase of PAK1 plasmids were transfected into SGC-7901 cells (left panel) and MKN45 cells (right panel). Western blot assays were performed to detect the protein level of endogenous RUFY3. (b)The GFP-RUFY3 and the increasing amounts of PAK1 expression vector were transfected into SGC-7901 cells, after 24 h of transfection, the protein levels of His-PAK1 and GFP-RUFY3 were measured by western blot. (c and d) Inhibition of PAK1 expression can also decrease RUFY3 expression. (c) The SGC-7901 cells expressing GFP-RUFY3 were treated with PAK1-siRNA, and the protein levels of PAK1 and GFP-RUFY3 were measured by western blot. (d) The stable expressing PAK1-shRNA lentivirus SGC-7901 cells (left panel) and BGC-823 (right panel) cells were treated with two different shRNAs (nos. 1 and 2) targeting RUFY3, and the protein level of endogenous PAK1 and RUFY3 were measured by western blot
Figure 5
PAK1 regulates RUFY3-mediated cell migration and invasion. (a) Overexpression of PAK1 facilitates RUFY3-induced cell invasion. SGC-7901 cells were transfected with GFP-RUFY3 and myc-PAK1 or GFP vector and myc-PAK1, and were subjected to performing transwell invasion assay. Photographs represented the cells traveling through the micropore membrane. (Left panel) Representative photomicrographs of transwell results were taken under × 200 original magnifications. Scale bars, 50 _μ_m. (Middle panel) Number of invading cells is shown. The number of cells was counted in 16 independent symmetrical visual fields under the microscope ( × 400 original magnification) from three independent experiments (*P <0.05, **P<0.01, compared with control vector). (Right panel) The exogenous expression of RUFY3 and PAK1 were verified by western blot. (b and c) Inhibition of PAK1 attenuates RUFY3-mediated cell migration and invasion. (b)The SGC-7901 cells transfected with GFP-RUFY3 or GFP vector, which were along with PAK1-siRNA-treated (PAK1 siRNA) or control siRNA-treated (Control siRNA), were used to perform the wound-healing assay. (Left panel) Photographs represented the cells migrating into the wounded area. Scale bars: 50.0 _μ_m. (Middle panel) Histogram showed the percentage of wound closure. Data are the average of at least three independent experiments with similar results (*P <0.05, **P<0.01, compared with 0 h). (Right panel) The efficacy of PAK1-shRNA was determined by western blot. (c) SGC-7901 cells transfected with GFP-RUFY3 were treated with or without IPA-3 (5 _μ_M) for 24 h, Me2SO (DMSO) as a control, and used to perform the transwell invasion assay. Photographs represented the cells traveling through the micropore membrane. (Left panel) Representative photomicrographs of transwell results were taken under × 200 original magnifications. Scale bars, 50 _μ_m. (Middle panel) Number of invading cells is shown. The number of cells was counted in 16 independent symmetrical visual fields under the microscope ( × 400 original magnification) from three independent experiments (*P <0.05, **P<0.01, compared with control vector). (Right panel) The exogenous expression of RUFY3 was demonstrated by western blotting when cells were treated with or without IPA-3. (d) Knockdown of both PAK1 and RUFY3 can significantly inhibit cell invasion. The RUFY3-shRNA1 was transfected into stable expressing PAK1-shRNA lentivirus SGC-7901 cells and BGC-823 cells to perform the transwell invasion assay. Photographs represented the cells traveling through the micropore membrane. (Left panel) Representative photomicrographs of transwell results were taken under × 200 original magnifications. Scale bars, 50 _μ_m. (Middle panel) Number of invading cells is shown. The number of cells was counted in 16 independent symmetrical visual fields under the microscope ( × 400 original magnifications) from three independent experiments (*P <0.05, **P<0.01, compared with control vector). (Right panel) The efficacys of PAK1-shRNA and RUFY3-siRNA were determined by western blot
Figure 6
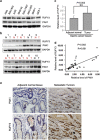
The positive correlation between RUFY3 and PAK1 in gastric cancer cells and clinical gastric cancer tissue samples. (a) The protein levels of RUFY3 in gastric cancer cell lines (BGC-823, MKN45, AGS MGC-803, SGC-7901, BGC-823 and MKN1) relative to the normal gastric epithelial cell line (GES-1) were analyzed by western blot. (b) The protein level of RUFY3 is positively correlated with PAK1 in gastric cancers and matched adjacent normal gastric tissue samples. Total protein from gastric cancer samples was extracted, and the protein levels of RUFY3 and PAK1 were measured by western blot. (c) Histogram showed the relative level of RUFY3 in gastric cancer tissues. Among 40 patients with gastric cancer, 28 of 40 (70%) samples revealed >50% increase in the RUFY3 level relative to their matched non-tumor adjacent tissues (_P_=0.003). (d) The relative protein level of RUFY3 was plotted against that of PAK1 in gastric cancers tissue samples with Spearman's correlation statistical analysis from (b). Spearman's correlation coefficient is 0.661 (_P_=0.002). (e) Immunohistochemical analyses of RUFY3 and PAK1 expression in adjacent normal gastric tissues and metastatic gastric cancer. Scale bar, 50 _μ_m
Similar articles
- P21-activated protein kinase 1 is overexpressed in gastric cancer and induces cancer metastasis.
Li LH, Luo Q, Zheng MH, Pan C, Wu GY, Lu YZ, Feng B, Chen XH, Liu BY. Li LH, et al. Oncol Rep. 2012 May;27(5):1435-42. doi: 10.3892/or.2012.1664. Epub 2012 Jan 27. Oncol Rep. 2012. PMID: 22293972 - P21-activated kinase 1 stimulates colon cancer cell growth and migration/invasion via ERK- and AKT-dependent pathways.
Huynh N, Liu KH, Baldwin GS, He H. Huynh N, et al. Biochim Biophys Acta. 2010 Sep;1803(9):1106-13. doi: 10.1016/j.bbamcr.2010.05.007. Epub 2010 Jun 1. Biochim Biophys Acta. 2010. PMID: 20595063 - Clinicopathological and cellular signature of PAK1 in human bladder cancer.
Huang K, Chen G, Luo J, Zhang Y, Xu G. Huang K, et al. Tumour Biol. 2015 Apr;36(4):2359-68. doi: 10.1007/s13277-014-2843-7. Epub 2014 Nov 21. Tumour Biol. 2015. PMID: 25412958 - Tyrosyl phosphorylated serine-threonine kinase PAK1 is a novel regulator of prolactin-dependent breast cancer cell motility and invasion.
Hammer A, Diakonova M. Hammer A, et al. Adv Exp Med Biol. 2015;846:97-137. doi: 10.1007/978-3-319-12114-7_5. Adv Exp Med Biol. 2015. PMID: 25472536 Free PMC article. Review. - Roles for RACK1 in cancer cell migration and invasion.
Duff D, Long A. Duff D, et al. Cell Signal. 2017 Jul;35:250-255. doi: 10.1016/j.cellsig.2017.03.005. Epub 2017 Mar 21. Cell Signal. 2017. PMID: 28336233 Review.
Cited by
- Effects of the Exposure of Human Non-Tumour Cells to Sera of Pancreatic Cancer Patients.
Sabanovic B, Giulietti M, Cecati M, Spolverato G, Benna C, Pucciarelli S, Piva F. Sabanovic B, et al. Biomedicines. 2022 Oct 15;10(10):2588. doi: 10.3390/biomedicines10102588. Biomedicines. 2022. PMID: 36289850 Free PMC article. - DOCK7 protects against replication stress by promoting RPA stability on chromatin.
Gao M, Guo G, Huang J, Hou X, Ham H, Kim W, Zhao F, Tu X, Zhou Q, Zhang C, Zhu Q, Liu J, Yan Y, Xu Z, Yin P, Luo K, Weroha J, Deng M, Billadeau DD, Lou Z. Gao M, et al. Nucleic Acids Res. 2021 Apr 6;49(6):3322-3337. doi: 10.1093/nar/gkab134. Nucleic Acids Res. 2021. PMID: 33704464 Free PMC article. - Non-Canonical Roles of Apoptotic Caspases in the Nervous System.
Dehkordi MH, Munn RGK, Fearnhead HO. Dehkordi MH, et al. Front Cell Dev Biol. 2022 Feb 23;10:840023. doi: 10.3389/fcell.2022.840023. eCollection 2022. Front Cell Dev Biol. 2022. PMID: 35281082 Free PMC article. Review. - Targeting p21-activated kinase 1 inhibits growth and metastasis via Raf1/MEK1/ERK signaling in esophageal squamous cell carcinoma cells.
Chen L, Bi S, Hou J, Zhao Z, Wang C, Xie S. Chen L, et al. Cell Commun Signal. 2019 Apr 11;17(1):31. doi: 10.1186/s12964-019-0343-5. Cell Commun Signal. 2019. PMID: 30971268 Free PMC article. - circSORBS1 inhibits lung cancer progression by sponging miR-6779-5p and directly binding RUFY3 mRNA.
Xu H, Zheng Y, Wu J, Zhang R, Zhao Q, Chen S, Peng W, Cai D, Gao Y, Chen X, Li D, Yuan S, Li G, Nan A. Xu H, et al. J Transl Med. 2024 Jun 24;22(1):590. doi: 10.1186/s12967-024-05423-0. J Transl Med. 2024. PMID: 38915053 Free PMC article.
References
- Steeg PS. Metastasis suppressors alter the signal transduction of cancer cells. Nat Rev Cancer. 2003;3:55–63. - PubMed
- Janoueix-Lerosey I, Pasheva E, de Tand MF, Tavitian A, de Gunzburg J. Identification of a specific effector of the small GTP-binding protein Rap2. Eur J Biochem. 1998;252:290–298. - PubMed
- Wang S, Zhang Z, Ying K, Chen JZ, Meng XF, Yang QS, et al. Cloning, expression, and genomic structure of a novel human Rap2 interacting gene (RPIP9) Biochem Genet. 2003;41:13–25. - PubMed
Publication types
MeSH terms
Substances
LinkOut - more resources
Full Text Sources
Other Literature Sources
Medical
Molecular Biology Databases
Research Materials


