YAP Inhibition Restores Hepatocyte Differentiation in Advanced HCC, Leading to Tumor Regression - PubMed (original) (raw)
. 2015 Mar 17;10(10):1692-1707.
doi: 10.1016/j.celrep.2015.02.027. Epub 2015 Mar 12.
Filippos Kottakis 1, Samira Benhamouche 2, Helen S Tian 3, Nicolas Chuvin 3, Christine A Parachoniak 1, Julia M Nagle 3, Rushika M Perera 1, Marjorie Lapouge 3, Vikram Deshpande 4, Andrew X Zhu 5, Albert Lai 6, Bosun Min 6, Yujin Hoshida 7, Joseph Avruch 8, Daniela Sia 9, Genís Campreciós 7, Andrea I McClatchey 4, Josep M Llovet 10, David Morrissey 6, Lakshmi Raj 6, Nabeel Bardeesy 11
Affiliations
- PMID: 25772357
- PMCID: PMC4565791
- DOI: 10.1016/j.celrep.2015.02.027
YAP Inhibition Restores Hepatocyte Differentiation in Advanced HCC, Leading to Tumor Regression
Julien Fitamant et al. Cell Rep. 2015.
Abstract
Defective Hippo/YAP signaling in the liver results in tissue overgrowth and development of hepatocellular carcinoma (HCC). Here, we uncover mechanisms of YAP-mediated hepatocyte reprogramming and HCC pathogenesis. YAP functions as a rheostat in maintaining metabolic specialization, differentiation, and quiescence within the hepatocyte compartment. Increased or decreased YAP activity reprograms subsets of hepatocytes to different fates associated with deregulation of the HNF4A, CTNNB1, and E2F transcriptional programs that control hepatocyte quiescence and differentiation. Importantly, treatment with small interfering RNA-lipid nanoparticles (siRNA-LNPs) targeting YAP restores hepatocyte differentiation and causes pronounced tumor regression in a genetically engineered mouse HCC model. Furthermore, YAP targets are enriched in an aggressive human HCC subtype characterized by a proliferative signature and absence of CTNNB1 mutations. Thus, our work reveals Hippo signaling as a key regulator of the positional identity of hepatocytes, supports targeting of YAP using siRNA-LNPs as a paradigm of differentiation-based therapy, and identifies an HCC subtype that is potentially responsive to this approach.
Copyright © 2015 The Authors. Published by Elsevier Inc. All rights reserved.
Figures
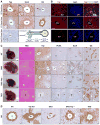
Figure 1. Hippo signaling is a rheostat controlling hepatocyte identity
A, B. Immunohistochemistry (A) and immunofluorescence (B) of mouse liver in the region of the portal vein (top row) and central vein (middle row) demonstrating nuclear and cytoplasmic YAP staining in bile ducts (arrow) and periportal hepatocytes, and absence of YAP in the first layer of pericentral hepatocytes. SOX9 shows nuclear staining in bile ducts and weaker nuclear staining in periportal hepatocytes, whereas it is excluded from the nucleus in pericentral hepatocytes. GS is a pericentral marker. CK19 is a biliary marker. The schematic representation of the porto-central axis indicates the territories of expression for YAP, SOX9 and GS. Yap KO liver (bottom row) is a negative control for YAP staining. Insets show magnified periportal or pericentral hepatocytes in (A). Bile duct is indicated by an asterisk in (B). Scale bars: 20μm (A) and 50μm (B). C. Gross, histologic and IHC analysis of livers of the indicated genotypes (Albumin-Cre models). Cross: necrotic region in TKO. Scale bars: 5mm (gross), 50μm (H&E, YAP, PCNA, SOX9) and 100 μm (GS). D. GS staining in pericentral regions. Scale bar: 20μm. PV: Portal vein, CV: Central vein, BD: Bile duct, HA: Hepatic artery. See also Figure S1.
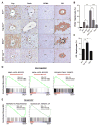
Figure 2. Acute effect of Hippo pathway modulation on hepatocyte identity
A–C. Mice were administered Cre adenovirus intravenously and livers were analyzed 2 weeks later by IHC for YAP, SOX9, PCNA and GS. The graphs quantify PCNA (B) and GS (C) staining. N= 3 mice in the WT, WTAd, Yap KOAd, TKOAd groups; 4 mice in the DKO Yap+/− Ad group and 5 mice in the DKOAd group. Error bars indicate S.E.M. *p<0.05, **p<0.01, ***p<0.001, ****p<0.0001. Scale bars: 20μm (YAP, SOX9) and 50μm (PCNA, GS). D, E. GSEA of mRNA expression data after acute deletion of Mst1/Mst2 in liver. DKO and WT mice were administered Adeno-Cre and liver mRNA was isolated after 8 days. D. GSEA revealed rapid loss of a broad program of hepatocyte differentiation genes and of targets of the master hepatocyte regulators, HNF4A and FOXA2. E) GSEA showing strong induction of a proliferation gene signature including established E2F targets. Liver-derived gene sets are indicated in red. NES: Normalized enrichment score; FDR: False discovery rate. Gene sets are from the Molecular Signatures Database except (HNF4a_LIVER_SPECIFIC) which is a curated list of liver-specific HNF4A targets (Saha et al., 2014). See also Figure S2 and Table S1.
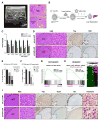
Figure 3. YAP suppresses the β-CATENIN pericentral program and drives invasive HCC downstream of Mst1/Mst2 DKO
A. Analysis of the indicated genotypes by H&E and SOX9 staining at 15 weeks. The dedifferentiation of hepatocytes to ADCs caused by Mst1/Mst2 DKO is blocked by hemizygous or homozygous Yap deletion, although scattered SOX9-positive cells are observed by this time point. Insets: High magnification images of regions denoted by arrowheads in the main panels. Note differences in the morphology of SOX9-positive cells between genotypes. Scale bar: 100 μm B. Left panel: Kaplan-Meier analysis showing time until animals reached endpoints for disease burden requiring euthanasia (see Methods). Median survival is indicated in brackets. N= 16 mice (DKO), 19 mice (DKO Yap+/−), 11 (TKO). ****p<0.0001. Right panels: Gross images of representative livers at sacrifice. C. Mean tumor burden at sacrifice. N= 8 mice (DKO), 7 mice (DKO Yap+/−) and 7 mice (TKO). Error bars indicate S.E.M. **p<0.01. D, E. Histologic and IHC analysis of tumors from DKO and TKO mice with end-stage disease. GS staining is quantified in (D). N= 4 mice per group. Error bars indicate S.E.M.*p<0.05 and **p<0.01. All tumors showed HCC histopathology, although distinct staining patterns were noted for liver markers. DKO tumors (E, top) stained positive for SOX9 and negative for GS and nuclear β-catenin, whereas the majority of TKO tumors (E, bottom) showed the opposite pattern. All TKO tumors lacked YAP staining. Scale bars: 20 μm (β-catenin), 100 μm (H&E, YAP, SOX9) and 200 μm (GS). See also Figure S3.
Figure 4. siLNP-mediated YAP silencing induces proliferative arrest and a pericentral hepatocyte differentiation program in advanced HCC
A. Ultrasound (US) detection of a liver tumor in DKOAd at 16 weeks after Adeno-Cre injection. The right panel shows corresponding histology of liver tumors. Interior vena cava (IVC). Scale bar: 100 μm. B. Schematic of therapeutic study. Upon detection of tumors by US imaging, animals were randomized into groups receiving siYAP-LNPs or control siLuc-LNPs and euthanized at the indicated time points. C. qRT-PCR analysis of tumors isolated after 4 or 9 days treatment. N= 32 tumors (siLuc), 18 tumors (siYAP 4 days) and 16 tumors (siYAP 9 days). Error bars indicate S.E.M. *p<0.05, **p<0.01, ***p<0.001. **D.** Representative IHC staining for YAP and KI67 in HCCs following 9 days treatment. Note that at 9 days HCC cells are preferentially targeted by siYAP-LNPs, whereas all liver cells show knockdown at later time points (see Fig. 5C). Scale bars: 20 μm (H&E, _right_) and 100 μm (H&E _left_, YAP, KI67). **E.** Quantification of YAP staining in HCC nodules at day 4 and 9. The chart shows the % of HCC nodules containing the indicated proportions of YAP-positive tumor cells (black, >75% of cells YAP-positive; grey, 30–75%; white, 0–30%). Note that YAP knockdown efficiency increases from day 4 to day 9. F. Quantification of KI67 staining at day 9. The chart shows % KI67-positive HCC cells in different tumor nodules grouped according to degree of YAP knockdown. Note that the decrease in KI67 staining correlates with effectiveness of YAP knockdown. siLuc-LNP: N= 20 tumors, from 3 treated mice; siYAP-LNP: N= 34 tumors from 4 treated mice. Error bars indicate S.E.M. **p<0.01, ****p<0.0001. G, H. GSEA of differentially expressed genes in response to siYAP-LNPs versus control siLuc-LNPs (day 9). G. Cell cycle genes are repressed. H. Left panel. Markers of hepatocyte differentiation are induced. Right panel. Heat map showing induction of markers specific to pericentral hepatocytes (Braeuning et al., 2006). NES: Normalized enrichment score. FDR: False discovery rate. I. By day 9, siYAP-LNPs result in loss of SOX9 staining, nuclear translocation of β-CATENIN and induction of GS. Scale bar 20 μm (H&E right, β-catenin) and 100 μm (H&E left, YAP, SOX9, GS). See also Figure S4 and Table S2.
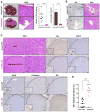
Figure 5. siLNP-mediated YAP silencing is an effective differentiation therapy in advanced HCC
Following detection of tumors by US imaging, DKOAd mice were treated with siRNA-LNPs for 28 days and then euthanized. A. Representative gross liver images and H&E stained sections. Arrows: visible liver tumors. Dotted lines: histologically confirmed HCC lesions. The charts show the number of histologically-validated HCC lesions/mouse (left) and tumor area occupied per whole liver cross-section (right; see Methods). N= 9 mice (siLuc-LNP) and 8 mice (siYAP-LNP). Scale bar 5 mm (gross) and 1 mm (H&E). Error bars indicate S.E.M. ***p<0.001, ****p<0.0001. B. The liver parenchyma shows restoration of zonal GS expression and disappearance of ADCs upon siYAP-LNP treatment. HCC lesions are indicated. Scale bar: 1 μm (GS) and 50 μm (H&E) C. siYAP-LNP treatment results in replacement of invasive HCCs by benign nodules with histopathologic features consistent with differentiation to regenerative hepatocytes, associated with loss of SOX9, infrequent PCNA staining, focal induction of nuclear β-CATENIN, and strong upregulation of GS. Scale bars: 100 μm and 20 μm (H&E right panel). D. Chart quantifying the proportion of nodules staining positive for GS. Error bars indicate S.E.M. ***p<0.001. See also Figure S5.
Figure 6. YAP positively regulates an E2F proliferation program and suppresses the Hnf4α hepatocyte differentiation pathway
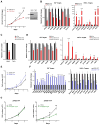
A. Left panel: Low passage HCC cultures derived from DKO mice display a proliferative advantage compared to TKO lines. N = number of independent cultures tested in each group. Right panel: Western blot analysis confirming that YAP expression is restricted to the DKO lines. B. qRT-PCR analysis shows that DKO lines are characterized by higher basal expression of E2F targets (left panel) and lower expression of HNF4α targets (right panel). Error bars indicate S.E.M. *p<0.05, **p<0.01, ***p<0.001, ****p<0.0001 C, D. DKO and TKO cell lines were transfected with siRNA against YAP or control siRNA**. C.** Quantification of cell growth data showing that siRNA-mediated YAP knockdown causes proliferative arrest of DKO lines but does not affect TKO cells. D. qRT-PCR analysis showing that YAP knockdown in DKO cells results in a significant decrease in the expression of multiple E2F-regulated cell cycle genes (left panel) and pronounced activation of HNF4A targets (right panel). Error bars indicate S.E.M. *p<0.05, **p<0.01, ***p<0.001, ****p<0.0001. E–G. TKO cells were transduced with retroviruses expressing human YAP (hYAP) or GFP control. E. YAP expression significantly increases the proliferation of TKO cells (left panel). F. Forced expression of YAP induces E2F targets (left panel) and inhibits HNF4A targets (right panel). Error bars indicate S.E.M. *p<0.05, **p<0.01, ***p<0.001, ****p<0.0001. G. Treatment with a CDK4/6 inhibitor (PD-0332991, 0.3 μM) impairs proliferation of TKO cells expressing YAP (right panel), without affecting GFP-expressing TKO control cells (left panel). Error bars indicate S.E.M. **p<0.01, ***p<0.001. See also Figure S6.
Figure 7. The YAP activity signature is enriched in human HCC subtypes defined by lack of CTNNB1 mutation and a proliferation gene profile
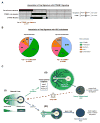
A. Analysis of 111 human HCC specimens reveals inverse correlation between the CTNNB1_-mutation signature and a YAP activation signature. B. Using a second HCC classification system (Chiang et al., 2008), the YAP activation signature (YAP+) is positively correlated with the aggressive Proliferation subclass, whereas absence of the signature (YAP-) significantly correlates with the CTNNB1 subclass. Fisher’s exact test was used for statistical analysis. C. Model illustrating the impact of Hippo/YAP modulation on liver biology. **(i)** In normal liver, YAP shows a decreasing gradient of nuclear and cytoplasmic expression along the porto-central axis. The final layer of hepatocytes adjacent to the central vein completely lacks YAP expression, whereas active β-catenin and GS are restricted to these cells. **(ii)** Activation of YAP in hepatocytes results in induction of proliferation-related E2F target genes, downregulation of the targets of the HNF4A and FOXA1,2, and loss of pericentral β-CATENIN targets (e.g. GS, OAT), as well as hepatocyte proliferation throughout the lobule and dedifferentiation of hepatocytes to ADCs in the portal area. The resulting HCCs are poorly differentiated, express SOX9 and lack nuclear β-CATENIN and its target, GS. Treatment with siYAP-LNPs leads to tumor regression and hepatocyte differentiation. **(iii)_** Yap deletion leads to an expansion of β-CATENIN targets in the central area. Additionally, Yap ablation completely blocks hepatocyte proliferation and oval cell expansion resulting from Mst1/Mst2 loss, and delays HCC development. The HCCs that develop display distinct differentiation markers and histopathology as compared to Yap-driven HCCs. ADC: Atypical Ductal Cells, BD: Bile duct, CV: Central vein, GS: glutamine synthetase, HA: Hepatic artery, OAT: ornithine aminotransferase, PV: Portal vein. See also Figure S7.
Similar articles
- AXIN deficiency in human and mouse hepatocytes induces hepatocellular carcinoma in the absence of β-catenin activation.
Abitbol S, Dahmani R, Coulouarn C, Ragazzon B, Mlecnik B, Senni N, Savall M, Bossard P, Sohier P, Drouet V, Tournier E, Dumont F, Sanson R, Calderaro J, Zucman-Rossi J, Vasseur-Cognet M, Just PA, Terris B, Perret C, Gilgenkrantz H. Abitbol S, et al. J Hepatol. 2018 Jun;68(6):1203-1213. doi: 10.1016/j.jhep.2017.12.018. Epub 2018 Mar 7. J Hepatol. 2018. PMID: 29525529 - C21 steroid-enriched fraction refined from Marsdenia tenacissima inhibits hepatocellular carcinoma through the coordination of Hippo-Yap and PTEN-PI3K/AKT signaling pathways.
Zhang Y, Li K, Ying Y, Chen B, Hao K, Chen B, Zheng Y, Lyu J, Tong X, Chen X, Wang Y, Zhan Z, Zhang W, Wang Z. Zhang Y, et al. Oncotarget. 2017 Nov 30;8(66):110576-110591. doi: 10.18632/oncotarget.22833. eCollection 2017 Dec 15. Oncotarget. 2017. PMID: 29299170 Free PMC article. - Oncogenic Determination of a Broad Spectrum of Phenotypes of Hepatocyte-Derived Mouse Liver Tumors.
Yamamoto M, Xin B, Watanabe K, Ooshio T, Fujii K, Chen X, Okada Y, Abe H, Taguchi Y, Miyokawa N, Furukawa H, Nishikawa Y. Yamamoto M, et al. Am J Pathol. 2017 Dec;187(12):2711-2725. doi: 10.1016/j.ajpath.2017.07.022. Epub 2017 Sep 28. Am J Pathol. 2017. PMID: 28964793 - ACADL plays a tumor-suppressor role by targeting Hippo/YAP signaling in hepatocellular carcinoma.
Zhao X, Qin W, Jiang Y, Yang Z, Yuan B, Dai R, Shen H, Chen Y, Fu J, Wang H. Zhao X, et al. NPJ Precis Oncol. 2020 Mar 25;4:7. doi: 10.1038/s41698-020-0111-4. eCollection 2020. NPJ Precis Oncol. 2020. PMID: 32219176 Free PMC article. - Targeting the Hippo Signaling Pathway for Tissue Regeneration and Cancer Therapy.
Juan WC, Hong W. Juan WC, et al. Genes (Basel). 2016 Aug 30;7(9):55. doi: 10.3390/genes7090055. Genes (Basel). 2016. PMID: 27589805 Free PMC article. Review.
Cited by
- Integration of Hippo-YAP Signaling with Metabolism.
Ibar C, Irvine KD. Ibar C, et al. Dev Cell. 2020 Jul 20;54(2):256-267. doi: 10.1016/j.devcel.2020.06.025. Dev Cell. 2020. PMID: 32693058 Free PMC article. Review. - The Hippo pathway in intestinal regeneration and disease.
Hong AW, Meng Z, Guan KL. Hong AW, et al. Nat Rev Gastroenterol Hepatol. 2016 Jun;13(6):324-37. doi: 10.1038/nrgastro.2016.59. Epub 2016 May 5. Nat Rev Gastroenterol Hepatol. 2016. PMID: 27147489 Free PMC article. Review. - Advances in targeted therapies for hepatocellular carcinoma in the genomic era.
Llovet JM, Villanueva A, Lachenmayer A, Finn RS. Llovet JM, et al. Nat Rev Clin Oncol. 2015 Jul;12(7):408-24. doi: 10.1038/nrclinonc.2015.103. Epub 2015 Jun 9. Nat Rev Clin Oncol. 2015. PMID: 26054909 Review. - Clinicopathological indices to predict hepatocellular carcinoma molecular classification.
Tan PS, Nakagawa S, Goossens N, Venkatesh A, Huang T, Ward SC, Sun X, Song WM, Koh A, Canasto-Chibuque C, Deshmukh M, Nair V, Mahajan M, Zhang B, Fiel MI, Kobayashi M, Kumada H, Hoshida Y. Tan PS, et al. Liver Int. 2016 Jan;36(1):108-18. doi: 10.1111/liv.12889. Epub 2015 Jun 29. Liver Int. 2016. PMID: 26058462 Free PMC article. - Regulation of Sox2 and stemness by nicotine and electronic-cigarettes in non-small cell lung cancer.
Schaal CM, Bora-Singhal N, Kumar DM, Chellappan SP. Schaal CM, et al. Mol Cancer. 2018 Oct 15;17(1):149. doi: 10.1186/s12943-018-0901-2. Mol Cancer. 2018. PMID: 30322398 Free PMC article.
References
- Benhamouche S, Decaens T, Godard C, Chambrey R, Rickman DS, Moinard C, Vasseur-Cognet M, Kuo CJ, Kahn A, Perret C, Colnot S. Apc tumor suppressor gene is the “zonation-keeper” of mouse liver. Dev Cell. 2006;10:759–770. - PubMed
LinkOut - more resources
Full Text Sources
Other Literature Sources
Molecular Biology Databases
Miscellaneous
