Quantifying nucleoporin stoichiometry inside single nuclear pore complexes in vivo - PubMed (original) (raw)
Quantifying nucleoporin stoichiometry inside single nuclear pore complexes in vivo
Lan Mi et al. Sci Rep. 2015.
Abstract
The nuclear pore complex (NPC) is one of the largest supramolecular structures in eukaryotic cells. Its octagonal ring-scaffold perforates the nuclear envelope and features a unique molecular machinery that regulates nucleocytoplasmic transport. NPCs are composed of ~30 different nucleoporins (Nups), averaged at 8, 16 or 32 copies per NPC. This estimate has not been confirmed for individual NPCs in living cells due to the inherent difficulty of counting proteins inside single supramolecular complexes. Here we used single-molecule SPEED microscopy to directly count the copy-number of twenty-four different Nups within individual NPCs of live yeast, and found agreement as well as significant deviation from previous estimates. As expected, we counted 8 copies of four peripheral Nups and 16 copies of fourteen scaffold Nups. Unexpectedly, we counted a maximum of 16 copies of Nsp1 and Nic96, rather than 32 as previously estimated; and found only 10-15 copies of six other Nups, rather than 8 or 16 copies as expected. This in situ molecular-counting technology can test structure-function models of NPCs and other supramolecular structures in cells.
Figures
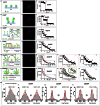
Figure 1. Counting the number of GFP molecules in synthetic protein complexes using SPEED microscopy.
(A) Diagram shows 1xGFP anchored on the surface of coverslip. (B) Wide-field epifluorescence images of 1xGFP. The fluorescent spot in the square was analyzed by SPEED microscopy; the spot generated the photobleaching curve shown in C. (C) The photobleaching curve of a 1xGFP molecule. The black dots represent the fluorescent signal; the red line is the fitted photobleaching steps; the number is the step count. (D–F) The anchoring pattern, the epi-fluorescence image and the photobleaching curve of 2xGFP molecules. (G–I) Construction and photobleaching analysis of 4xGFP molecules. (J) Diagram shows the deposition of 6xGFP on the surface of coverslips. Scale bar: 5 μM. (K) Wide-field epifluorescence images of 6xGFP on the surface of a coverslip. (L) Photobleaching curves of 6xGFP molecules, showing six photobleaching steps were clearly resolved. (M–Q) Construction and photobleaching analysis of 12xGFP molecules. To have a detailed view, the photobleaching steps of a 12xGFP molecule were separated into red and green boxed areas, as shown in O, P and Q. (R–V) Construction, imaging and the photobleaching steps of a 28xGFP molecule. (W) Intensity-based analyses of the copy number of GFPs in 6xGFP, 12xGFP and 28xGFP. (i) Distribution of intensities of single photobleaching steps collected from photobleaching curves of molecular complexes of GFPs (grey columns) fitted with a Gaussian function (red line). (ii–iv) Histograms (grey columns) fitted by Gaussian functions (red lines) show the distribution of initial intensities of photobleaching curves and the corresponding average copy numbers for 6xGFP, 12xGFP and 28xGFP constructs.
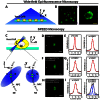
Figure 2. Single NPCs on the yeast NE illuminated by SPEED microscopy.
(A) Diagram of yeast cells being imaged by wide-field epi-fluorescence microscopy. A Cartesian coordinate system is shown. (B) A typical epi-fluorescence image of yeast cells expressing a Nup-GFP fusion protein. The enlarged portion (right panel) shows the heterogeneous distribution of tagged NPCs on the NE of yeast. (C) SPEED microscopy illumination of a single NPC in a single yeast cell. Yeasts in growth medium were immobilized on concanavalin A-coated coverslips (green). C, cytoplasm; N, nucleus. Single GFP-labeled NPCs (green) on the NE were illuminated by an inclined diffraction-limit illumination point spread function (iPSF) of SPEED microscopy at the equatorial plane of the nucleus in the focal plane (between the double red lines). The iPSF forms an angle of 45° to the z direction. (D) A typical single GFP-tagged NPC observed by SPEED microscopy. (E) The fluorescent spot of the illuminated single GFP-NPC was fit well by an asymmetrical Gaussian function in x and y directions. The full width at half maximum (FWHM) of either fitting was shown in pixels. (F–G) Typical GFP-tagged overlapped NPCs observed by SPEED microscopy and unresolved by Gaussian fitting. (H–I) Typical GFP-tagged overlapped NPCs observed by SPEED microscopy and resolved by Gaussian functions in y direction.
Figure 3. Counting the copy-number of Nup60-GFP in yeast NPCs.
(A) Yeasts expressing GFP-tagged Nup60 were observed in either bright-field or fluorescence mode of epi-fluorescence microscopy. (B) The sequential photobleaching images of Nup60-GFPs located in a single NPC over time by SPEED microscopy. Scale bar: 1 μm. (C) A typical photobleaching curve for a Nup60-GFP labeled NPC in yeast. Eight GFP-Nup60 photobleaching steps were resolved corresponding to eight molecules of Nup60 per NPC. The first several transient steps were enlarged for a detailed look (inset). (D) Distribution of intensities of single photobleaching steps collected from photobleaching curves of Nup60-GFPs (grey columns) fitted with a Gaussian function (red line). (E–F) Distributions of the initial intensities of photobleaching curves and the corresponding copy-number of Nup60-GFP per NPC. Both histograms were best-fitted by two Gaussian functions that generated two clustered intensities and two average copy-numbers (blue, green and red lines). (G) The copy numbers of Nup60-GFP per NPC directly counted from the photobleaching steps of Nup60-GFP labeled NPCs that have the initial intensities equal to and bigger than six-fold of the intensity of single Nup60-GFP in live yeast cells. Approximately 14% of all measured NPCs enabled us to obtain a maximum copy number of eight for Nup60-GFP per NPC.
Figure 4. Copy numbers of Nups in the yeast NPCs obtained from either the initial intensities or from the direct counted steps in photobleaching curves.
(A) Histogram of copy numbers of Nic96-GFP per NPC achieved from the initial intensities of Nic96-GFP molecules per NPC divided by the intensity of a single Nic96-GFP molecule. Gaussian fittings (red line) of the histogram yielded two averaged copies of 7.3 ± 2.8 (blue) and 13.3 ± 2.0 (green). (B) Direct counted copy numbers of Nic96-GFP per NPC. Approximately 3% of all the scanned fluorescent NPCs that have initial intensities equal to or bigger than that of fourteen copies of Nic96-GFP molecules generated a maximum copy number of 16. (C–D) The average intensity-based copy numbers and the photobleaching-step-based maximum copy of Nsp1-GFP per yeast NPC. (E–F) The intensity-based averaged copy numbers and the photobleaching-step-based maximum copy of POM152-GFP in yeast NPC. (G–H) The averaged intensity-based copy numbers and the photobleaching-step-based maximum copy of POM34-GFP per NPC. (I–J) The intensity-based averaged copy numbers and the photobleaching-step-based maximum copy of Nup100-GFP per NPC. (K–L) The intensity-based averaged copy numbers and the photobleaching-step-based maximum copy of Mlp1-GFP per NPC. (M–N) The intensity-based averaged copy numbers and the photobleaching-step-based maximum copy of Mlp2-GFP per NPC.
Similar articles
- Super-resolution mapping of scaffold nucleoporins in the nuclear pore complex.
Ma J, Kelich JM, Junod SL, Yang W. Ma J, et al. J Cell Sci. 2017 Apr 1;130(7):1299-1306. doi: 10.1242/jcs.193912. Epub 2017 Feb 15. J Cell Sci. 2017. PMID: 28202688 Free PMC article. - Nucleoporin's Like Charge Regions Are Major Regulators of FG Coverage and Dynamics Inside the Nuclear Pore Complex.
Peyro M, Soheilypour M, Ghavami A, Mofrad MR. Peyro M, et al. PLoS One. 2015 Dec 11;10(12):e0143745. doi: 10.1371/journal.pone.0143745. eCollection 2015. PLoS One. 2015. PMID: 26658558 Free PMC article. - A nanobody suite for yeast scaffold nucleoporins provides details of the nuclear pore complex structure.
Nordeen SA, Andersen KR, Knockenhauer KE, Ingram JR, Ploegh HL, Schwartz TU. Nordeen SA, et al. Nat Commun. 2020 Dec 2;11(1):6179. doi: 10.1038/s41467-020-19884-6. Nat Commun. 2020. PMID: 33268786 Free PMC article. - [Nuclear pores: from yeast to higher eukaryotes].
Doye V. Doye V. J Soc Biol. 2002;196(4):349-54. J Soc Biol. 2002. PMID: 12645306 Review. French. - Nuclear pore complex composition: a new regulator of tissue-specific and developmental functions.
Raices M, D'Angelo MA. Raices M, et al. Nat Rev Mol Cell Biol. 2012 Nov;13(11):687-99. doi: 10.1038/nrm3461. Nat Rev Mol Cell Biol. 2012. PMID: 23090414 Review.
Cited by
- Modeling of the mechano-chemical behaviour of the nuclear pore complex: current research and perspectives.
Garcia A, Rodriguez Matas JF, Raimondi MT. Garcia A, et al. Integr Biol (Camb). 2016 Oct 10;8(10):1011-1021. doi: 10.1039/c6ib00153j. Integr Biol (Camb). 2016. PMID: 27713975 Free PMC article. Review. - Super-resolution mapping of scaffold nucleoporins in the nuclear pore complex.
Ma J, Kelich JM, Junod SL, Yang W. Ma J, et al. J Cell Sci. 2017 Apr 1;130(7):1299-1306. doi: 10.1242/jcs.193912. Epub 2017 Feb 15. J Cell Sci. 2017. PMID: 28202688 Free PMC article. - Selective Degradation and Quantification of Nucleoporins in the Nuclear Pore by Auxin-Inducible Degrons and Single-Molecule Microscopy.
Tingey M, Li Y, Yang W. Tingey M, et al. Curr Protoc. 2022 Sep;2(9):e520. doi: 10.1002/cpz1.520. Curr Protoc. 2022. PMID: 36063146 Free PMC article. - Insights into the gate of the nuclear pore complex.
Zwerger M, Eibauer M, Medalia O. Zwerger M, et al. Nucleus. 2016;7(1):1-7. doi: 10.1080/19491034.2015.1130197. Epub 2016 Feb 22. Nucleus. 2016. PMID: 26902931 Free PMC article. - Characterization of nuclear pore complex targeting domains in Pom152 in Saccharomyces cerevisiae.
Brown JT, Haraczy AJ, Wilhelm CM, Belanger KD. Brown JT, et al. Biol Open. 2021 Oct 15;10(10):bio057661. doi: 10.1242/bio.057661. Epub 2021 Oct 20. Biol Open. 2021. PMID: 34557894 Free PMC article.
References
- Yang Q., Rout M. P. & Akey C. W. Three-dimensional architecture of the Isolated yeast nuclear pore complex: functional and evolutionary implications. Mol. Cell 1, 223–234 (1998). - PubMed
- Kiseleva E. et al. Yeast nuclear pore complexes have a cytoplasmic ring and internal filaments. J. Struct. Biol. 145, 272–288 (2004). - PubMed
Publication types
MeSH terms
Substances
Grants and funding
- GM094041/GM/NIGMS NIH HHS/United States
- GM097037/GM/NIGMS NIH HHS/United States
- R15 GM094041/GM/NIGMS NIH HHS/United States
- R01 GM097037/GM/NIGMS NIH HHS/United States
- R01 GM077520/GM/NIGMS NIH HHS/United States
- GM077520/GM/NIGMS NIH HHS/United States
LinkOut - more resources
Full Text Sources
Other Literature Sources
Molecular Biology Databases
Research Materials


