S-nitrosoglutathione reductase-dependent PPARγ denitrosylation participates in MSC-derived adipogenesis and osteogenesis - PubMed (original) (raw)
. 2015 Apr;125(4):1679-91.
doi: 10.1172/JCI73780. Epub 2015 Mar 23.
Samirah A Gomes, Erika B Rangel, Ellena C Paulino, Tatiana L Fonseca, Jinliang Li, Marilia B Teixeira, Cecilia H Gouveia, Antonio C Bianco, Michael S Kapiloff, Wayne Balkan, Joshua M Hare
- PMID: 25798618
- PMCID: PMC4396480
- DOI: 10.1172/JCI73780
S-nitrosoglutathione reductase-dependent PPARγ denitrosylation participates in MSC-derived adipogenesis and osteogenesis
Yenong Cao et al. J Clin Invest. 2015 Apr.
Abstract
Bone marrow-derived mesenchymal stem cells (MSCs) are a common precursor of both adipocytes and osteoblasts. While it is appreciated that PPARγ regulates the balance between adipogenesis and osteogenesis, the roles of additional regulators of this process remain controversial. Here, we show that MSCs isolated from mice lacking S-nitrosoglutathione reductase, a denitrosylase that regulates protein S-nitrosylation, exhibited decreased adipogenesis and increased osteoblastogenesis compared with WT MSCs. Consistent with this cellular phenotype, S-nitrosoglutathione reductase-deficient mice were smaller, with reduced fat mass and increased bone formation that was accompanied by elevated bone resorption. WT and S-nitrosoglutathione reductase-deficient MSCs exhibited equivalent PPARγ expression; however, S-nitrosylation of PPARγ was elevated in S-nitrosoglutathione reductase-deficient MSCs, diminishing binding to its downstream target fatty acid-binding protein 4 (FABP4). We further identified Cys 139 of PPARγ as an S-nitrosylation site and demonstrated that S-nitrosylation of PPARγ inhibits its transcriptional activity, suggesting a feedback regulation of PPARγ transcriptional activity by NO-mediated S-nitrosylation. Together, these results reveal that S-nitrosoglutathione reductase-dependent modification of PPARγ alters the balance between adipocyte and osteoblast differentiation and provides checkpoint regulation of the lineage bifurcation of these 2 lineages. Moreover, these findings provide pathophysiological and therapeutic insights regarding MSC participation in adipogenesis and osteogenesis.
Figures
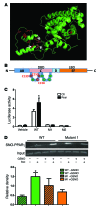
Figure 6. Identification of Cys 139 as a site of PPARγ S-nitrosylation.
(A) A 3D structure of PPARγ showed the 10 cysteines in red, with white arrows labeling the 3 mutated ones. The 3D structure was derived from ref. . (B) A topology map of PPARγ with 3 mutated cysteines in red. DBD, DNA-binding domain; LBD, ligand-binding domain. (C) PPARγ luciferase activity in HEK-293T cells overexpressed with WT and mutants, in the presence or absence of the PPARγ agonist rosiglitazone (1 μM). *P < 0.05, compared with WT CTL, analyzed by Bonferroni’s multiple comparison test (2-way ANOVA). n = 4. (D) SNO-PPARγ in HEK-293T cells overexpressed with WT and mutant 1 (Cys 139), measured by SNO-RAC. Omission of ascorbic acid was used as a negative control. *P < 0.05, compared with WT without GSNO treatment, analyzed by Bonferroni’s multiple comparison test (2-way ANOVA). n = 3. Data are presented as mean ± SEM.
Figure 5. GSNOR–/– MSCs have enhanced constitutive S-nitrosylation of PPARγ with decreased transcriptional activity.
(A) SNO-PPARγ in MSCs of WT versus GSNOR–/– mice was measured by SNO-RAC assay. UV, UV light; Asc, ascorbic acid. Pretreatment with UV light and omission of ascorbic acid were used as negative controls. *P < 0.05. n = 3. Statistical significance between 2 groups was determined by Student’s t test. Representative blots show S-nitrosylated and total PPARγ. The relative ratio of S-nitrosylated PPARγ to total PPARγ in WT mice is arbitrarily defined as 1. The lanes were run on the same gel, but were noncontiguous. (B) PPARγ luciferase activity in HEK-293T cells treated with GSNO in the presence or absence of rosiglitazone (Rosi) (1 μM). 2-way ANOVA, *P < 0.05, compared with PPARγ CTL; #P < 0.05, compared with PPARγ rosiglitazone, analyzed by Bonferroni’s multiple comparison test. n = 5. (C) ChIP analysis of PPARγ binding for the promoter region of FABP4 in WT and GSNOR–/– MSCs. *P < 0.05, compared with corresponding IgG; #P < 0.05, compared with WT PPARγ Ab group, analyzed by 2-way ANOVA Bonferroni’s multiple comparison test. n = 4. (D) ChIP analysis of PPARγ binding to the promoter region of the Fabp4 gene in WT MSCs treated with 500 μM GSNO. The lanes were run on the same gel, but were noncontiguous. *P < 0.05, compared with IgG without GSNO treatment; #P < 0.05, compared with PPARγ Ab without GSNO treatment, analyzed by Bonferroni’s multiple comparison test (2-way ANOVA). n = 4. Data are presented as mean ± SEM.
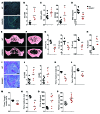
Figure 4. GSNOR–/– mice have enhanced bone formation and resorption.
All studies were conducted in 2-month-old male WT and GSNOR–/– mice. (A) Calcein double labeling of the distal femur; mineralization front was stained in green. Scale bars: 200 μm. n = 3. (B and C) Quantification of histomorphometric analysis of Ob.S/BS (B) and MAR and BFR/BS (C) in the femur (WT, n = 8; GSNOR–/–, n = 6). (D) Whole-body BMD. n = 6. (E and F) Representative images of the vertebra (E) and femur (F). n = 3. (G and H) Quantification of μCT analysis of BV/TV, Tb.Th, Tb.N (G), and Tb.Sp (H) (WT, n = 5; GSNOR–/–, n = 4). (I) Toluidine blue staining of the distal femur, the mineralized bone was stained red. Scale bars: 200 μm. n = 3. (J) Quantification of histomorphometric analysis of osteoclast content in the femur (WT, n = 8; GSNOR–/–, n = 6). (K–N) Femur maximum load (K), stiffness (L), Young’s module (M), and resiliency (N). n = 4. (O) PTH level in the serum. n = 7. (P) Serum FGF23 level. C-term, C-terminus. n = 6. * P <0.05; **P < 0.01; ***P < 0.001. Statistical significance between 2 groups was determined by unpaired Student’s t test (2-tailed) and presented as mean ± SEM.
Figure 3. GSNOR–/– mice have reduced body weight, fat mass, and adipocyte size.
(A and B) Whole-body morphology and body weight of 2-month-old male WT and GSNOR–/– mice. **P < 0.01. n = 6. (C and D) Percentage and weight of fat mass (C) and percentage and weight of lean mass (D) of 2-month-old male mice were measured by DEXA. **P < 0.01; ***P < 0.001. n = 6. (E) Adipose tissue was stained with H&E, and adipocyte surface area was quantified. Scale bars: 100 μm. n = 3. (F) Adipogenic gene expression in WAT (WT, n = 5; GSNOR–/–, n = 4). Statistical significance was determined by 2-way ANOVA and presented as mean ± SEM. **P < 0.01, compared with WT, analyzed by Bonferroni’s multiple comparison test. Statistical significance between 2 groups was determined by unpaired Student’s t test (2-tailed) and presented as mean ± SEM.
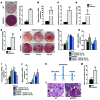
Figure 2. GSNOR–/– MSCs exhibit enhanced osteogenic differentiation.
(A) Whole-well scan of ALS staining of WT and GSNOR–/– MSCs. ALS staining was quantified. **P < 0.01. n = 6. (B) Expression of Bglap (osteocalcin) in MSCs grown in osteogenic medium. *P < 0.05. n = 6. (C–E) Expression of Runx2 (C), Spp1 (osteopontin, D), and Bglap (osteocalcin, E) at baseline in the absence of osteogenic supplements. *P < 0.05; **P < 0.01. n = 6. (F and G) WT and GSNOR–/– MSCs were grown in osteogenic medium and treated with 50 μM or 100 μM GSNOR inhibitor for 2 weeks. ALS staining was performed and quantified (2-way ANOVA; for strain, P = 0.0004; for drug, P = 0.9081). *P < 0.05, compared with WT, analyzed by Bonferroni’s multiple comparison test or 1-way ANOVA within strain. n = 3. (H–J) Cells were treated similarly to those shown in F and G, and expression of Spp1 (H), Runx2 (I), and Bglap (J) was determined (2-way ANOVA; for strain, P < 0.0001; for drug, P = 0.2829). *P < 0.05, compared with WT, analyzed by Bonferroni’s multiple comparison test or 1-way ANOVA within strain. n = 3. (K) Scheme for assessing MSC-based bone regeneration in vivo. (L) H&E staining of tissue samples from NOD-SCID mice after subcutaneous implantation with WT or GSNOR–/– MSCs following the protocol described in K. H&E staining was quantified (M). Formation of bone (B) and connective tissue (CT) around GelFoam (G) are indicated. Scale bars: 500 μm. n = 3. (M) Semiquantitative analysis of new bone formation. n = 3. *P < 0.05. Statistical significance between 2 groups was determined by unpaired Student’s t test (2-tailed) and presented as mean ± SEM.
Figure 1. GSNOR–/– MSCs have impaired adipogenic differentiation.
(A) ORO staining of WT and GSNOR–/– cells. Scale bars: 100 μm. n = 6. (B) ORO staining was quantified and normalized to baseline staining. ***P < 0.001. n = 6. (C) Expression of adipogenic genes in WT and GSNOR–/– MSCs grown in adipogenic medium, analyzed by 1-way ANOVA (overall P < 0.0001). n = 5–7. *P < 0.05; ***P < 0.001, compared with WT, analyzed by Bonferroni’s multiple comparison test. (D) Expression of Cd36 in WT and GSNOR–/– MSCs grown in adipogenic medium. *P < 0.05. n = 6. (E and F) Expression of Pparg (E) (2-way ANOVA; for strain, P = 0.0313; for drug, P = 0.5547) and Fabp4 (F) (2-way ANOVA; for strain, P < 0.0001; for drug, P = 0.2736) after GSNOR inhibitor treatment. *P < 0.05, compared with WT, analyzed by Bonferroni’s multiple comparison test. n = 3. (G) ORO staining of WT and GSNOR–/– MSCs grown in adipogenic medium and treated with 50 μM or 100 μM GSNOR inhibitor (GSNORi) for 2 weeks. Scale bars: 100 μm. n = 3. (H) ORO staining was quantified (2-way ANOVA; for strain, P < 0.0001; for drug, P = 0.0014). **P < 0.01; ***P < 0.001, compared with WT, analyzed by Bonferroni’s multiple comparison test. n = 3. Statistical significance between 2 groups was determined by unpaired Student’s t test (2-tailed) and presented as mean ± SEM.
Similar articles
- PPARγ suppression inhibits adipogenesis but does not promote osteogenesis of human mesenchymal stem cells.
Yu WH, Li FG, Chen XY, Li JT, Wu YH, Huang LH, Wang Z, Li P, Wang T, Lahn BT, Xiang AP. Yu WH, et al. Int J Biochem Cell Biol. 2012 Feb;44(2):377-84. doi: 10.1016/j.biocel.2011.11.013. Epub 2011 Nov 23. Int J Biochem Cell Biol. 2012. PMID: 22120652 - Structurally-diverse, PPARγ-activating environmental toxicants induce adipogenesis and suppress osteogenesis in bone marrow mesenchymal stromal cells.
Watt J, Schlezinger JJ. Watt J, et al. Toxicology. 2015 May 4;331:66-77. doi: 10.1016/j.tox.2015.03.006. Epub 2015 Mar 14. Toxicology. 2015. PMID: 25777084 Free PMC article. - Genetic inhibition of PPARγ S112 phosphorylation reduces bone formation and stimulates marrow adipogenesis.
Ge C, Zhao G, Li B, Li Y, Cawthorn WP, MacDougald OA, Franceschi RT. Ge C, et al. Bone. 2018 Feb;107:1-9. doi: 10.1016/j.bone.2017.10.023. Epub 2017 Oct 26. Bone. 2018. PMID: 29107124 Free PMC article. - Molecular Mechanisms of PPAR-γ Governing MSC Osteogenic and Adipogenic Differentiation.
Zhuang H, Zhang X, Zhu C, Tang X, Yu F, Shang GW, Cai X. Zhuang H, et al. Curr Stem Cell Res Ther. 2016;11(3):255-64. doi: 10.2174/1574888x10666150531173309. Curr Stem Cell Res Ther. 2016. PMID: 26027680 Review. - PPAR-γ and Wnt Regulate the Differentiation of MSCs into Adipocytes and Osteoblasts Respectively.
Li Y, Jin D, Xie W, Wen L, Chen W, Xu J, Ding J, Ren D. Li Y, et al. Curr Stem Cell Res Ther. 2018 Feb 23;13(3):185-192. doi: 10.2174/1574888X12666171012141908. Curr Stem Cell Res Ther. 2018. PMID: 29034841 Review.
Cited by
- Implications of Oxidative and Nitrosative Post-Translational Modifications in Therapeutic Strategies against Reperfusion Damage.
Buelna-Chontal M, García-Niño WR, Silva-Palacios A, Enríquez-Cortina C, Zazueta C. Buelna-Chontal M, et al. Antioxidants (Basel). 2021 May 8;10(5):749. doi: 10.3390/antiox10050749. Antioxidants (Basel). 2021. PMID: 34066806 Free PMC article. Review. - ADH5-mediated NO bioactivity maintains metabolic homeostasis in brown adipose tissue.
Sebag SC, Zhang Z, Qian Q, Li M, Zhu Z, Harata M, Li W, Zingman LV, Liu L, Lira VA, Potthoff MJ, Bartelt A, Yang L. Sebag SC, et al. Cell Rep. 2021 Nov 16;37(7):110003. doi: 10.1016/j.celrep.2021.110003. Cell Rep. 2021. PMID: 34788615 Free PMC article. - Osteogenic Factor Runx2 Marks a Subset of Leptin Receptor-Positive Cells that Sit Atop the Bone Marrow Stromal Cell Hierarchy.
Yang M, Arai A, Udagawa N, Hiraga T, Lijuan Z, Ito S, Komori T, Moriishi T, Matsuo K, Shimoda K, Zahalka AH, Kobayashi Y, Takahashi N, Mizoguchi T. Yang M, et al. Sci Rep. 2017 Jul 10;7(1):4928. doi: 10.1038/s41598-017-05401-1. Sci Rep. 2017. PMID: 28694469 Free PMC article. - Mesenchymal stem cell perspective: cell biology to clinical progress.
Pittenger MF, Discher DE, Péault BM, Phinney DG, Hare JM, Caplan AI. Pittenger MF, et al. NPJ Regen Med. 2019 Dec 2;4:22. doi: 10.1038/s41536-019-0083-6. eCollection 2019. NPJ Regen Med. 2019. PMID: 31815001 Free PMC article. Review. - _S_-nitrosylation drives cell senescence and aging in mammals by controlling mitochondrial dynamics and mitophagy.
Rizza S, Cardaci S, Montagna C, Di Giacomo G, De Zio D, Bordi M, Maiani E, Campello S, Borreca A, Puca AA, Stamler JS, Cecconi F, Filomeni G. Rizza S, et al. Proc Natl Acad Sci U S A. 2018 Apr 10;115(15):E3388-E3397. doi: 10.1073/pnas.1722452115. Epub 2018 Mar 26. Proc Natl Acad Sci U S A. 2018. PMID: 29581312 Free PMC article.
References
Publication types
MeSH terms
Substances
Grants and funding
- R01HL084275/HL/NHLBI NIH HHS/United States
- R01 HL107110/HL/NHLBI NIH HHS/United States
- R01 HL084275/HL/NHLBI NIH HHS/United States
- R01 HL110737/HL/NHLBI NIH HHS/United States
- R01 HL094849/HL/NHLBI NIH HHS/United States
- R01 HL110737-01/HL/NHLBI NIH HHS/United States
- R01-HL094849/HL/NHLBI NIH HHS/United States
LinkOut - more resources
Full Text Sources
Other Literature Sources
Molecular Biology Databases
Research Materials


