Nuclear Magnetic Resonance Structural Mapping Reveals Promiscuous Interactions between Clathrin-Box Motif Sequences and the N-Terminal Domain of the Clathrin Heavy Chain - PubMed (original) (raw)
Nuclear Magnetic Resonance Structural Mapping Reveals Promiscuous Interactions between Clathrin-Box Motif Sequences and the N-Terminal Domain of the Clathrin Heavy Chain
Yue Zhuo et al. Biochemistry. 2015.
Abstract
The recruitment and organization of clathrin at endocytic sites first to form coated pits and then clathrin-coated vesicles depend on interactions between the clathrin N-terminal domain (TD) and multiple clathrin binding sequences on the cargo adaptor and accessory proteins that are concentrated at such sites. Up to four distinct protein binding sites have been proposed to be present on the clathrin TD, with each site proposed to interact with a distinct clathrin binding motif. However, an understanding of how such interactions contribute to clathrin coat assembly must take into account observations that any three of these four sites on clathrin TD can be mutationally ablated without causing loss of clathrin-mediated endocytosis. To take an unbiased approach to mapping binding sites for clathrin-box motifs on clathrin TD, we used isothermal titration calorimetry (ITC) and nuclear magnetic resonance spectroscopy. Our ITC experiments revealed that a canonical clathrin-box motif peptide from the AP-2 adaptor binds to clathrin TD with a stoichiometry of 3:1. Assignment of 90% of the total visible amide resonances in the TROSY-HSQC spectrum of (13)C-, (2)H-, and (15)N-labeled TD40 allowed us to map these three binding sites by analyzing the chemical shift changes as clathrin-box motif peptides were titrated into clathrin TD. We found that three different clathrin-box motif peptides can each simultaneously bind not only to the previously characterized clathrin-box site but also to the W-box site and the β-arrestin splice loop site on a single TD. The promiscuity of these binding sites can help explain why their mutation does not lead to larger effects on clathrin function and suggests a mechanism by which clathrin may be transferred between different proteins during the course of an endocytic event.
Figures
Figure 1
ITC indicates that the clathrin N-terminal domain (TD) binds three clathrin-box AP2 peptides with low affinity. (a) Heat evolution as a function of adding increasing amounts of AP2 peptide to TD. The heats of dilution were measured separately and found to be <1% of the signal at the start of titration so were not considered further in the analysis. (b) Fitting the ITC data with Microcal-modified Origin 7 software to an _N_-identical site model indicates that each TD binds three AP2 peptides with a _K_D of 420 ± 4 μM. The fit (red) is overlaid on the data (black). Values shown on the figure are from the fit of the displayed data set. The average and standard deviations of three independent experiments gave the following values: K_D = 474 ± 140 μM, N = 3.0 ± 0.2 sites, Δ_H = −2.8 ± 0.2 kcal/mol, and T_Δ_S = 1.8 ± 0.4 kcal/mol. (c) The same data set shown in panel a was processed with NITPIC to produce the displayed thermogram. (d) The thermogram shown in panel c was integrated with NITPIC to produce the displayed isotherm. The error bars (blue) come from examining the noise in the interinjection periods. The data were then fit in SEDPHAT to a three-site model. The fit (red) is overlaid on the data (black), with the residual displayed below each isotherm (red). (e) The isotherm shown in panel c was fit in SEDPHAT to a two-site model. (f) The isotherm shown in panel d was fit to a one-site model. Notice the poor quality of the fits to the one- and two-site models, compared to the fit to the three-site models.
Figure 2
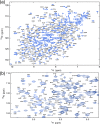
Backbone sequential resonance assignments of clathrin TD. (a) Two-dimensional 1H–15N TROSY-HSQC spectrum and assignments of the amide resonances. The assignable peaks are labeled by residue number; 90% of the total visible peaks could be assigned. (b) Enlarged view of the area boxed in panel a.
Figure 3
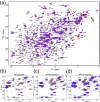
Mapping of chemical shifts induced by peptide binding. (a) TROSY-HSQC spectrum of 15N-labeled TD alone (black) overlaid with spectra of TD in the presence of increasing concentrations of unlabeled AP2 peptide. (b–d) Expanded views of the boxed area selected from panel a. TROSY-HSQC spectra of labeled TD titrated with (b) AP2 peptide, (c) AP180 peptide 1, and (d) AP180 peptide 2. In all panels, black spectra are 15N-labeled TD only, while red, orange, green, blue, and purple spectra correspond to ligand:protein ratios of 1:1, 2:1, 3:1, 5:1, and 9:1, respectively. Arrows indicate the directions of peak shifts upon addition of peptide.
Figure 4
Locations of shifted and broadened residues define three peptide binding sites on TD coincident with those previously defined by crystallography and mutational analyses. (a) Surface representation of TD structure in white with residue peaks that were either broadened or shifted by at least two standard deviations above the mean by the AP2 peptide in either red (site 1), blue (site 2), or green (site 3). (b) As in panel a, but for AP180 peptide 1. (c) As in panel a, but for AP180 peptide 2. (d) Mutations shown to affect binding to β-arrestin 2 (Q89, F91, K96, and K98), amphiphysin (F27 and Q152), and the β-arrestin 1 splice loop (R188) are highlighted on the TD structure in red, blue, and green, respectively. In all panels, a peptide from the β3 subunit of AP-3 [purple, Protein Data Bank (PDB) entry 1C9I], amphiphysin (yellow, PDB entry 1UTC), and the β-arrestin 1 splice loop (green, PDB entry 3GC3) are shown as they occur in the crystal structures of the respective TD–peptide complexes.
Figure 5
_K_D determinations indicate that all three peptides bind all three sites on TD with similar, low affinities. (a) Chemical shift changes (at least two standard deviations above the mean) induced by AP2 peptide plotted vs peptide:TD ratio and globally fit as described in Experimental Procedures. Fit lines colored red, blue, and green correspond to residues in peptide binding sites 1–3, respectively: _K_D = 867 ± 246 μM, n = 2.6 ± 0.4, _r_2 = 0.992, and reduced χ2 = 3.8 × 10⁻⁵. (b) As in panel a, but for AP180 peptide 1: _K_D = 829 ± 221 μM, n = 3.9 ± 0.3, _r_2 = 0.997, and reduced χ2 = 2.0 × 10⁻⁵. (c) As in panel a, but for AP180 peptide 2: _K_D = 899 ± 529 μM, n = 3.7 ± 0.6, _r_2 = 0.986, and reduced χ2 = 2.8 × 10⁻⁵. (d) As in panel a, but for an AP2 mutant peptide in which the DLL residues at positions 630–632 of the clathrin box were mutated to AAA. Residues and n were as in panel a to match the values of the WT peptide from which this mutant was derived: _K_D = 5371 ± 1602 μM, _r_2 = 0.972, and reduced χ2 = 2.1 × 10⁻⁵.
Similar articles
- Clathrin functions in the absence of the terminal domain binding site for adaptor-associated clathrin-box motifs.
Collette JR, Chi RJ, Boettner DR, Fernandez-Golbano IM, Plemel R, Merz AJ, Geli MI, Traub LM, Lemmon SK. Collette JR, et al. Mol Biol Cell. 2009 Jul;20(14):3401-13. doi: 10.1091/mbc.e08-10-1082. Epub 2009 May 20. Mol Biol Cell. 2009. PMID: 19458198 Free PMC article. - Molecular switches involving the AP-2 beta2 appendage regulate endocytic cargo selection and clathrin coat assembly.
Edeling MA, Mishra SK, Keyel PA, Steinhauser AL, Collins BM, Roth R, Heuser JE, Owen DJ, Traub LM. Edeling MA, et al. Dev Cell. 2006 Mar;10(3):329-42. doi: 10.1016/j.devcel.2006.01.016. Dev Cell. 2006. PMID: 16516836 - Two distinct interaction motifs in amphiphysin bind two independent sites on the clathrin terminal domain beta-propeller.
Miele AE, Watson PJ, Evans PR, Traub LM, Owen DJ. Miele AE, et al. Nat Struct Mol Biol. 2004 Mar;11(3):242-8. doi: 10.1038/nsmb736. Epub 2004 Feb 15. Nat Struct Mol Biol. 2004. PMID: 14981508 - Structural insights into the clathrin coat.
Young A. Young A. Semin Cell Dev Biol. 2007 Aug;18(4):448-58. doi: 10.1016/j.semcdb.2007.07.006. Epub 2007 Aug 16. Semin Cell Dev Biol. 2007. PMID: 17702618 Review. - Getting in touch with the clathrin terminal domain.
Lemmon SK, Traub LM. Lemmon SK, et al. Traffic. 2012 Apr;13(4):511-9. doi: 10.1111/j.1600-0854.2011.01321.x. Epub 2012 Jan 13. Traffic. 2012. PMID: 22239657 Free PMC article. Review.
Cited by
- Force redistribution in clathrin-mediated endocytosis revealed by coiled-coil force sensors.
Ren Y, Yang J, Fujita B, Jin H, Zhang Y, Berro J. Ren Y, et al. Sci Adv. 2023 Oct 13;9(41):eadi1535. doi: 10.1126/sciadv.adi1535. Epub 2023 Oct 13. Sci Adv. 2023. PMID: 37831774 Free PMC article. - Behaviour of intrinsically disordered proteins in protein-protein complexes with an emphasis on fuzziness.
Olsen JG, Teilum K, Kragelund BB. Olsen JG, et al. Cell Mol Life Sci. 2017 Sep;74(17):3175-3183. doi: 10.1007/s00018-017-2560-7. Epub 2017 Jun 8. Cell Mol Life Sci. 2017. PMID: 28597296 Free PMC article. Review. - Clathrin binding by the adaptor Ent5 promotes late stages of clathrin coat maturation.
Hung CW, Duncan MC. Hung CW, et al. Mol Biol Cell. 2016 Apr 1;27(7):1143-53. doi: 10.1091/mbc.E15-08-0588. Epub 2016 Feb 3. Mol Biol Cell. 2016. PMID: 26842894 Free PMC article. - Subtleties in Clathrin heavy chain binding boxes provide selectivity among adaptor proteins of budding yeast.
Defelipe LA, Veith K, Burastero O, Kupriianova T, Bento I, Skruzny M, Kölbel K, Uetrecht C, Thuenauer R, García-Alai MM. Defelipe LA, et al. Nat Commun. 2024 Nov 7;15(1):9655. doi: 10.1038/s41467-024-54037-z. Nat Commun. 2024. PMID: 39511183 Free PMC article. - A Novel Sequence in AP180 and CALM Promotes Efficient Clathrin Binding and Assembly.
Moshkanbaryans L, Xue J, Wark JR, Robinson PJ, Graham ME. Moshkanbaryans L, et al. PLoS One. 2016 Aug 30;11(8):e0162050. doi: 10.1371/journal.pone.0162050. eCollection 2016. PLoS One. 2016. PMID: 27574975 Free PMC article.
References
- McMahon H. T.; Boucrot E. (2011) Molecular mechanism and physiological functions of clathrin-mediated endocytosis. Nat. Rev. 12, 517–533. - PubMed
- Miele A. E.; Watson P. J.; Evans P. R.; Traub L. M.; Owen D. J. (2004) Two distinct interaction motifs in amphiphysin bind two independent sites on the clathrin terminal domain β-propeller. Nat. Struct. Mol. Biol. 11, 242–248. - PubMed
Publication types
MeSH terms
Substances
Grants and funding
- GM68933/GM/NIGMS NIH HHS/United States
- NS029051/NS/NINDS NIH HHS/United States
- P30 CA054174/CA/NCI NIH HHS/United States
- R56 NS029051/NS/NINDS NIH HHS/United States
- R01 NS029051/NS/NINDS NIH HHS/United States
LinkOut - more resources
Full Text Sources
Other Literature Sources
Research Materials


