eIF3 targets cell-proliferation messenger RNAs for translational activation or repression - PubMed (original) (raw)
eIF3 targets cell-proliferation messenger RNAs for translational activation or repression
Amy S Y Lee et al. Nature. 2015.
Abstract
Regulation of protein synthesis is fundamental for all aspects of eukaryotic biology by controlling development, homeostasis and stress responses. The 13-subunit, 800-kilodalton eukaryotic initiation factor 3 (eIF3) organizes initiation factor and ribosome interactions required for productive translation. However, current understanding of eIF3 function does not explain genetic evidence correlating eIF3 deregulation with tissue-specific cancers and developmental defects. Here we report the genome-wide discovery of human transcripts that interact with eIF3 using photoactivatable ribonucleoside-enhanced crosslinking and immunoprecipitation (PAR-CLIP). eIF3 binds to a highly specific program of messenger RNAs involved in cell growth control processes, including cell cycling, differentiation and apoptosis, via the mRNA 5' untranslated region. Surprisingly, functional analysis of the interaction between eIF3 and two mRNAs encoding the cell proliferation regulators c-JUN and BTG1 reveals that eIF3 uses different modes of RNA stem-loop binding to exert either translational activation or repression. Our findings illuminate a new role for eIF3 in governing a specialized repertoire of gene expression and suggest that binding of eIF3 to specific mRNAs could be targeted to control carcinogenesis.
Figures
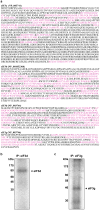
Extended Data Figure 1. PAR-CLIP reveals eIF3a, b, d, and g bind to RNA
a, Mass spectrometry identification of trypsin-released peptides from RNA-crosslinked eIF3 subunits. Peptides identified by mass spectrometry are highlighted in pink. b, c, Crosslinking and denaturing immunoprecipitation to validate subunit identification. As eIF3d and g co-migrate with eIF3l and e/f, respectively, subunit identification was validated by immunoprecipitation of individual proteins after crosslinking and treatment of lysates with SDS treatment and boiling.
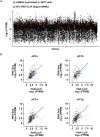
Extended Data Figure 2. Analysis of eIF3 PAR-CLIP targets
a, Scatterplot of fragments per kilobase of exon per million reads (FPKM) of all mRNAs expressed in 293T cells. mRNAs that are eIF3 PAR-CLIP targets are highlighted in red. b, Scatterplot of correlation between mRNA expression and PAR-CLIP read coverage for mRNAs that are eIF3 PAR-CLIP targets. The simple linear regression line is plotted in blue, with the 95% confidence region shaded in gray.
Extended Data Figure 3. Conservation of c-Jun and BTG1 eIF3-binding sites in primates and mammals
The eIF3-binding site is indicated in cyan. c-Jun Genbank IDs are: human (NM_002228.3, Homo sapiens), chimpanzee (XM_513442.5, Pan troglodytes), gorilla (XM_004025880.1, Gorilla gorilla), orangutan (XM_002810763.3, Pongo abelii), rhesus macaque (NM_001265850.2, Macaca mulatta), marmoset (XM_002750880.3, Callithrix jacchus), mouse (NM_010591.2, Mus musculus), cat (XM_006934825.1, Felis catus). BTG1 Genbank IDs are: human (NM_001731.2, Homo sapiens), chimpanzee (XM_509262.3, Pan troglodytes), orangutan (XM_002823578.2, Pongo abelii), rhesus macaque (NM_001266672.1, Macaca mulatta), marmoset (XM_002752814.3, Callithrix jacchus), mouse (NM_007569.2, Mus musculus), cat (XM_006933950.1, Felis catus), cow (NM_173999.3, Bos taurus).
Extended Data Figure 4. Interactions between native and recombinant eIF3 and the c-Jun and BTG1 RNA stem loops
a, Coomassie blue staining of purified native HeLa eIF3 or recombinant eIF3, resolved by SDS-PAGE. b, Representative native agarose gel electrophoresis shows a specific and binary interaction between native and recombinant eIF3 and the WT Jun stem loop structure, but not with the mutated stem loop or the WT BTG1 stem loop.
Extended Data Figure 5. Luciferase activity of c-Jun and BTG1 mutants in cells
a, b, Luciferase activity in 293T cells transfected with mRNAs containing the c-Jun 5′ UTR with a mutated stem loop (a) or the PSMB6 5′ UTR-BTG1 stem loop chimera (b). The results are given as the mean ± SD of three independent experiments, each performed in triplicate.
Extended Data Figure 6. Bypassing eIF3 translational control in H1299 cells reduces cell invasiveness
a, Functional classification of eIF3-bound RNAs. b, Representative western blot analysis of eIF3a expression levels in H1299 and IMR90 cells. GAPDH was detected as a loading control for normalized protein levels. c, Representative image of Matrigel invasion by H1299 or IMR90 cells. d, BTG1 protein levels after overexpression in H1299 cells. HSP90 was detected as a loading control. e, Matrigel invasion assay in H1299 cells after overexpression of BTG1. f, c-Jun protein levels after siRNA-mediated knockdown in H1299 cells. g, Matrigel invasion assay in H1299 cells after knockdown of c-Jun. The results of (e) and (g) are given as the mean ± SD of three independent experiments, each performed in duplicate.
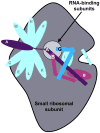
Extended Data Figure 7. Schematic of eIF3 subunits localization on the small ribosomal subunit
The eIF3 subunits bound to RNA in the PAR-CLIP experiment, eIF3a, b, and g, form a nexus in the distal eIF3 region. The location of eIF3d has not been assigned, and the schematic is adapted from .
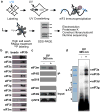
Figure 1. PAR-CLIP of the multi-protein translation initiation factor complex, eIF3
a, Schematic of PAR-CLIP methodology. 4-thiouridine-labeled (s4U) RNAs were crosslinked to proteins and endogenous eIF3 complexes were immunoprecipitated using an antibody that recognizes eIF3b. Separate cDNA libraries were constructed for individual crosslinked subunits. b, Immunoprecipitation of the eIF3 complex. Magnetic beads without eIF3b antibody were used as a negative control. c, Western blot of immunoprecipitated complexes after PAR-CLIP. d, Phosphorimage of SDS gel resolving 5′ 32P-labeled RNAs crosslinked to eIF3 subunits. Crosslinked RNAs cause the subunits to migrate ∼10 kD above their expected size. Immunoprecipitated samples prepared from 4-thiouridine-labeled 293T lysates treated without UV 365 nm light are shown as a negative control. Coomassie blue staining of purified native eIF3 resolved by SDS-PAGE is shown for size reference.
Figure 2. Analysis and validation of eIF3 PAR-CLIP-derived binding sites
a, Length distribution of PAR-CLIP clusters. b, Distribution of number of PAR-CLIP clusters per gene. c, Distribution of PAR-CLIP targets among different combinations of eIF3 subunit crosslinking. d, Validation of PAR-CLIP targets by eIF3 immunoprecipitation and RT-PCR. eIF3 immunoprecipitation was performed using an anti-eIF3b antibody as in Fig. 1b. As negative controls, the immunoprecipitation was performed with isotype-matched IgG or anti-HA antibody. e, Distribution of eIF3 crosslinking sites along mRNAs and in other classes of RNAs.
Figure 3. eIF3 is a positive and negative transcript-specific translational regulator
a, b, eIF3 PAR-CLIP cluster in the 5′ UTR of c-Jun mRNA (a) or BTG1 mRNA (b). Reads mapped are shown along the respective genes. c, Schematic of c-Jun and BTG1 5′ UTR-luciferase reporter mRNAs. The eIF3 PAR-CLIP cluster is nucleotide positions 181–214 for the c-Jun transcript (NM_002228) and positions 105–187 for the BTG1 transcript (NM_001731). d, e, Luciferase activity in cells transfected with mRNAs containing the c-Jun (d) or BTG1 (e) 5′ UTR with or without a deletion of the eIF3 crosslinking site. f, g, Luciferase activity in vitro from mRNAs driven by the c-Jun (f) or BTG1 (g) 5′ UTR, with or without competitor m7G cap analog. The results of d – g are given as the mean ± SD of three independent experiments, each performed in triplicate.
Figure 4. Opposing translation phenotypes are driven by different modes of eIF3–mRNA binding
a, SHAPE-based secondary structure of the c-Jun 5′ UTR surrounding the eIF3 PAR-CLIP site. Nucleotides are color-coded by their SHAPE reactivities, with higher reactivity reflecting single stranded behavior and non-reactivity indicating base pairing between nucleotides. b, Representative native gel shifts showing a specific and binary interaction between recombinant eIF3 and the wild type c-Jun stem loop structure but not the mutated stem loop. c, Luciferase activity in vitro of mRNAs driven by the c-Jun 5′ UTR containing stem loop mutations. d, SHAPE-based secondary structure of the BTG1 5′ UTR surrounding the eIF3 PAR-CLIP site. e, Luciferase activity in vitro from mRNAs driven by a PSMB6 5′ UTR-BTG1 stem loop chimera. The results of c and e are given as the mean ± SD of three independent experiments, each performed in triplicate. f, g, Representative images of the effect of siRNA-mediated knockdown of c-Jun (f) or BTG1 overexpression (g) on Matrigel invasion by H1299 cells. As a control, cells were transfected with a non-targeting siRNA (f) or empty vector (g). Quantification of cell migration is presented in Extended Data Fig. 6.
Similar articles
- Structure of the RNA Specialized Translation Initiation Element that Recruits eIF3 to the 5'-UTR of c-Jun.
Walker MJ, Shortridge MD, Albin DD, Cominsky LY, Varani G. Walker MJ, et al. J Mol Biol. 2020 Mar 27;432(7):1841-1855. doi: 10.1016/j.jmb.2020.01.001. Epub 2020 Jan 14. J Mol Biol. 2020. PMID: 31953146 Free PMC article. - Human eukaryotic initiation factor 4G (eIF4G) protein binds to eIF3c, -d, and -e to promote mRNA recruitment to the ribosome.
Villa N, Do A, Hershey JW, Fraser CS. Villa N, et al. J Biol Chem. 2013 Nov 15;288(46):32932-40. doi: 10.1074/jbc.M113.517011. Epub 2013 Oct 3. J Biol Chem. 2013. PMID: 24092755 Free PMC article. - The role of eIF3 and its individual subunits in cancer.
Hershey JW. Hershey JW. Biochim Biophys Acta. 2015 Jul;1849(7):792-800. doi: 10.1016/j.bbagrm.2014.10.005. Epub 2014 Nov 1. Biochim Biophys Acta. 2015. PMID: 25450521 Review. - Structural and mechanistic insights into hepatitis C viral translation initiation.
Fraser CS, Doudna JA. Fraser CS, et al. Nat Rev Microbiol. 2007 Jan;5(1):29-38. doi: 10.1038/nrmicro1558. Epub 2006 Nov 27. Nat Rev Microbiol. 2007. PMID: 17128284 Review. - eIF3: a versatile scaffold for translation initiation complexes.
Hinnebusch AG. Hinnebusch AG. Trends Biochem Sci. 2006 Oct;31(10):553-62. doi: 10.1016/j.tibs.2006.08.005. Epub 2006 Aug 22. Trends Biochem Sci. 2006. PMID: 16920360 Review.
Cited by
- Perturbations in eIF3 subunit stoichiometry alter expression of ribosomal proteins and key components of the MAPK signaling pathways.
Herrmannová A, Jelínek J, Pospíšilová K, Kerényi F, Vomastek T, Watt K, Brábek J, Mohammad MP, Wagner S, Topisirovic I, Valášek LS. Herrmannová A, et al. Elife. 2024 Nov 4;13:RP95846. doi: 10.7554/eLife.95846. Elife. 2024. PMID: 39495207 Free PMC article. - Targeting EIF3C to suppress the development and progression of nasopharyngeal carcinoma.
Zhao Q, Luo X, Li H, Bai Y, Chen Q, Yang M, Pei B, Xu C, Han S. Zhao Q, et al. Front Bioeng Biotechnol. 2022 Sep 6;10:994628. doi: 10.3389/fbioe.2022.994628. eCollection 2022. Front Bioeng Biotechnol. 2022. PMID: 36147539 Free PMC article. - Mutant Presenilin 1 Dysregulates Exosomal Proteome Cargo Produced by Human-Induced Pluripotent Stem Cell Neurons.
Podvin S, Jones A, Liu Q, Aulston B, Mosier C, Ames J, Winston C, Lietz CB, Jiang Z, O'Donoghue AJ, Ikezu T, Rissman RA, Yuan SH, Hook V. Podvin S, et al. ACS Omega. 2021 May 13;6(20):13033-13056. doi: 10.1021/acsomega.1c00660. eCollection 2021 May 25. ACS Omega. 2021. PMID: 34056454 Free PMC article. - A TORC1-histone axis regulates chromatin organisation and non-canonical induction of autophagy to ameliorate ageing.
Lu YX, Regan JC, Eßer J, Drews LF, Weinseis T, Stinn J, Hahn O, Miller RA, Grönke S, Partridge L. Lu YX, et al. Elife. 2021 May 14;10:e62233. doi: 10.7554/eLife.62233. Elife. 2021. PMID: 33988501 Free PMC article. - On the Way to Understanding the Interplay between the RNA Structure and Functions in Cells: A Genome-Wide Perspective.
Andrzejewska A, Zawadzka M, Pachulska-Wieczorek K. Andrzejewska A, et al. Int J Mol Sci. 2020 Sep 15;21(18):6770. doi: 10.3390/ijms21186770. Int J Mol Sci. 2020. PMID: 32942713 Free PMC article. Review.
References
- Hershey JW. Regulation of protein synthesis and the role of eIF3 in cancer. Braz J Med Biol Res. 2010;43:920–930. - PubMed
Publication types
MeSH terms
Substances
Grants and funding
- S10RR029668/RR/NCRR NIH HHS/United States
- S10RR027303/RR/NCRR NIH HHS/United States
- P50 GM102706/GM/NIGMS NIH HHS/United States
- S10 RR029668/RR/NCRR NIH HHS/United States
- S10 RR025622/RR/NCRR NIH HHS/United States
- S10 RR027303/RR/NCRR NIH HHS/United States
- Howard Hughes Medical Institute/United States
- S10RR025622/RR/NCRR NIH HHS/United States
LinkOut - more resources
Full Text Sources
Other Literature Sources
Molecular Biology Databases
Research Materials
Miscellaneous


