A model of breast cancer heterogeneity reveals vascular mimicry as a driver of metastasis - PubMed (original) (raw)
. 2015 Apr 16;520(7547):358-62.
doi: 10.1038/nature14403. Epub 2015 Apr 8.
Mar Soto 1, Sara Gutiérrez-Ángel 1, Christina A Hartl 1, Annika L Gable 1, Ashley R Maceli 1, Nicolas Erard 2, Alissa M Williams 1, Sun Y Kim 1, Steffen Dickopf 1, J Chuck Harrell 3, Andrew D Smith 4, Charles M Perou 3, John E Wilkinson 5, Gregory J Hannon 2, Simon R V Knott 2
Affiliations
- PMID: 25855289
- PMCID: PMC4634366
- DOI: 10.1038/nature14403
A model of breast cancer heterogeneity reveals vascular mimicry as a driver of metastasis
Elvin Wagenblast et al. Nature. 2015.
Abstract
Cancer metastasis requires that primary tumour cells evolve the capacity to intravasate into the lymphatic system or vasculature, and extravasate into and colonize secondary sites. Others have demonstrated that individual cells within complex populations show heterogeneity in their capacity to form secondary lesions. Here we develop a polyclonal mouse model of breast tumour heterogeneity, and show that distinct clones within a mixed population display specialization, for example, dominating the primary tumour, contributing to metastatic populations, or showing tropism for entering the lymphatic or vasculature systems. We correlate these stable properties to distinct gene expression profiles. Those clones that efficiently enter the vasculature express two secreted proteins, Serpine2 and Slpi, which were necessary and sufficient to program these cells for vascular mimicry. Our data indicate that these proteins not only drive the formation of extravascular networks but also ensure their perfusion by acting as anticoagulants. We propose that vascular mimicry drives the ability of some breast tumour cells to contribute to distant metastases while simultaneously satisfying a critical need of the primary tumour to be fed by the vasculature. Enforced expression of SERPINE2 and SLPI in human breast cancer cell lines also programmed them for vascular mimicry, and SERPINE2 and SLPI were overexpressed preferentially in human patients that had lung-metastatic relapse. Thus, these two secreted proteins, and the phenotype they promote, may be broadly relevant as drivers of metastatic progression in human cancer.
Figures
Extended Data Figure 1. Overview of vector plasmids and clonal abundances in the primary tumour and secondary sites after 4T1 transplantation
a, Schematic of the retroviral barcode vector (used for Figs 1, 2d, 4e and Extended Data Fig. 8f). b, Schematic of the lentiviral barcode vector (used for Fig. 2a–c). c, Schematic of the retroviral shRNA vector used for single gene knockdown. d, Schematic of the tandem retroviral shRNA vector used for double gene knockdown. e, Schematic of the retroviral cDNA vector used for gene overexpression. f, Distribution of clone abundances in the primary tumours and secondary sites for the 4T1 clones that engrafted and contributed to tumour formation in all five animals after orthotopic injection. g, Overlap of abundant clones in the primary tumour, lymph nodes, blood and in all blood-borne metastases (BBM: lung, liver and brain) (P < 0.001, hypergeometric test). h, Overlap of the abundant clones in the lymph nodes, liver, lung and brain.
Extended Data Figure 2. Morphology and proliferation rates of all clonal lines grown
Microscopic phase-contrast images of the 23 clonal lines discussed in Figs 2–4. Doubling times (DT), as calculated over a 3-day period, are colour-coded in the image borders. Original magnification, ×10.
Extended Data Figure 3. Tumour growth and metastases rates for individually injected clones and clonal composition of intracardiacally injected pool
a, Primary tumour volumes resulting from orthotopically injected individual clonal cell lines. Measurements were taken 14 and 24 days after injection (n = 4 mice). For comparison, the clonal composition of the primary tumour when the pool of clones is injected orthotopically is shown below. b, The percentage of lung metastatic burden for the animals discussed in a 24 days after injection (n = 4 mice). For comparison, the clonal composition of the lung when the pool of clones is injected orthotopically is shown below. c, A comparison of the clonal composition of CTCs and lung metastases when the pool of 23 clonal lines was orthotopically injected (data from Fig. 2c) versus injected into the left cardiac ventricle of mice (n = 10 mice for orthotopic injections and n = 8 mice for intracardiac injections). d, Clonal compositions of the primary tumours, CTCs and lung metastases analysed in Fig. 2d. e, Clonal composition of CTCs and lung metastases after orthotopic injection when the individual clones were frozen down 3–5 times and cultured for a week each time (n = 5 mice). For all bar graphs, error bars extend to the values _q_3 + w(_q_3−_q_1), and _q_1 − w(_q_3 − _q_1), in which w is 1.5 and _q_1 and _q_3 are the twenty-fifth and seventy-fifth percentiles.
Extended Data Figure 4. SERPINE2 and SLPI expression in human patients and Serpine2 and Slpi shRNAs abundances in lung and CTCs after orthotopic and intracardiac injection
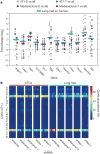
a, Analysis of Serpine2 and Slpi human orthologues SERPINE2 and SLPI, respectively in basal, Her2 or claudin-low breast cancer patients with no relapse as compared to patients with relapse in the lung (P < 0.005, Wilcoxon rank-sum, n indicated in figure). b, A non-targeting shRNA and two targeting each of Serpine2 and Slpi were infected separately into 4T1-T cells. After selection, the separately infected cells were pooled in equal amounts with the remaining 22 clonal lines and orthotopically injected into mice. The proportions of shRNAs shown are that of the CTCs and lung metastases in comparison to those in the primary tumour (P < 0.01, Wilcoxon rank-sum, n = 10 mice). c, 4T1-T cells were infected with a non-targeting shRNA or shRNAs targeting Serpine2 or Slpi. The shRNAs were cotained in a vector that constitutively expressed mCherry. The infected cells were then pooled with the other 22 clones and injected orthotopically (n = 10 mice). Shown are representative images of the resultant mCherry positive lung metastatic nodules. d, Quantification of all mCherry positive metastatic lung nodules in all mice (P < 0.01, Wilcoxon rank-sum, n = 10 mice). e, 4T1-parental cells were infected with a non-targeting shRNA or shRNAs targeting Serpine2 or Slpi. In each case the cells were then orthotopically injected into mice. Shown are representative images of haematoxylin-and-eosin-stained lung sections (n = 10 mice). f, Quantification of lung metastatic nodules in all haematoxylin-and-eosin-stained sections described in e (P < 0.01 and P < 0.005 for single- and double-knockdowns, respectively, Wilcoxon rank-sum, n = 10 mice). For all box plots, the edges of the box are the twenty-fifth and seventy-fifth percentiles. The error bars extend to the values _q_3 + w(_q_3−_q_1), and _q_1 − w(_q_3 − _q_1), in which w is 1.5 and _q_1 and _q_3 are the twenty-fifth and seventy-fifth percentiles.
Extended Data Figure 5. Leakiness index of clonal cell lines
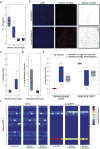
a, DAPI and dextran Alexa 647 (+ dextran inverted)-stained tumour sections from orthotopic tumours derived from parental-4T1, 4T1-L and 4T1-T cells. b, Leakiness index of primary tumours resulting from orthotopic injection of parental-4T1, 4T1-L and 4T1-T cells (P < 0.05, Wilcoxon rank-sum, n = 15 mice). c, The leakiness index of primary tumours derived from 4T1-T cells that have been infected with either a non-targeting shRNA or an shRNA targeting Serpine2 or Slpi (P < 0.03, Wilcoxon rank-sum, n = 18 mice). For all box plots, the edges of the box are the twenty-fifth and seventy-fifth percentiles. The error bars extend to the values _q_3 + w(_q_3 − _q_1), and _q_1 − w(_q_3 − _q_1), in which w is 1.5 and _q_1 and _q_3 are the twenty-fifth and seventy-fifth percentiles.
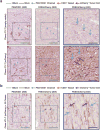
Extended Data Figure 6. Vascular mimicry in 4T1-T and pooled primary tumours
a, PAS/CD31 (left) and PAS/mCherry (right) staining of serially sectioned 4T1-T derived primary tumours, where the tumour cells constitutively express an empty vector or mCherry. Orange arrows indicate CD31+ endothelial blood vessels and blue arrows show PAS+/CD31− channels. The purple arrows indicate mCherry-positive tumour cells adjacent to PAS+ channels (green scale bars = 100 μm, grey scale bars = 50 μm). b, PAS/CD31 (left) and PAS/mCherry (right) staining of serially sectioned primary tumours resulting from orthotopic injection of a pool of the 23 clones, in which the 4T1-T clonal line constitutively expresses mCherry. Orange arrows indicate CD31+ endothelial blood vessels and blue arrows show PAS+/CD31− channels. The purple arrows indicate mCherry-positive tumour cells adjacent to PAS+ channels (green scale bars = 100 μm, grey scale bars = 50μm).
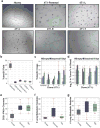
Extended Data Figure 7. Overexpression of Serpine2 and Slpi in parental 4T1 and clonal cell lines
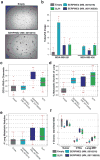
a, Images of HUVECs, parental 4T1, 4T1-L, 4T1-I, 4T1-E and 4T1-T cells grown on Matrigel to assess tube formation ability. b, Number of tubular structures identified per ×5 microscopic field when 4T1-T cells had been infected with a non-targeting shRNA or shRNAs targeting Serpine2 or Slpi and grown on Matrigel (P<0.0002, Wilcoxon rank-sum, n = 8 fields). c, Number of tubular structures identified per ×5 microscopic image when non-intravasating 4T1 clonal lines had been infected with an empty retroviral vector or vectors for overexpression of Serpine2 or Slpi (P < 0.03, Wilcoxon rank-sum, with the exception of 4T1-B overexpressing Slpi, n = 4 fields). d, Relative CTC proportions of the cells described in c after they had been pooled with the remaining clonal lines and orthotopically injected (P < 0.05, Wilcoxon rank-sum, with the exception of 4T1-F and 4T1-B Slpi, n = 10 mice). e, PAS+/CD31− channels in primary tumours resulting from orthotopic injection of parental 4T1 cells infected with an empty retroviral vector or vectors for overexpression of Serpine2 or Slpi (P < 0.01, Wilcoxon rank-sum, n = 10 fields). f, Quantification of the number of lung metastatic nodules resulting from the tumours described in e after 18 days (n = 4 mice). g, Quantification of the number of lung metastatic nodules resulting from the tumours described in e after 24 days (P<0.05, Friedman, n = 10 mice). For all box plots, the edges of the box are the twenty-fifth and seventy-fifth percentiles. The error bars extend to the values _q_3 + w(_q_3 − _q_1), and _q_1 − w(_q_3 − _q_1), in which w is 1.5 and _q_1 and _q_3 are the twenty-fifth and seventy-fifth percentiles.
Extended Data Figure 8. Overexpression of SERPINE2 and SLPI in human breast cancer cell lines
a, MDA-MB-231 cells infected with an empty overexpression vector plated on Matrigel (top) and MDA-MB-231 cells overexpressing SERPINE2 (NM_0016216) plated on Matrigel (bottom). b, Full quantification of tubular structures in basal cell lines MDA-MB-231 and MDA-MB-436 when infected with an empty overexpression vector or when infected with vectors for overexpressing SERPINE2 or SLPI (P < 0.05, Friedman test, for SERPINE2 isoform NM_0016216 and SLPI, n = 4 fields). c, Quantification of CD31−/PAS+ channels in MDA-MB-436-derived primary tumours cells that have been infected with an empty retroviral vector or vectors for overexpression of SERPINE2 or SLPI (P < 0.002, Wilcoxon rank-sum, for SERPINE2 isoform NM_001136528 and SLPI, n = 20 fields for empty, SERPINE2 NM_001136528 and NM_0016216 and n = 25 fields for SLPI). d, The percentage of lung metastatic burden after orthotopic injection of MDA-MB-231 cells that have been infected with an empty retroviral vector or vectors for overexpression of SERPINE2 or SLPI (P < 0.05, Wilcoxon rank-sum, n = 9 mice). e, Quantification of the number of lung metastatic nodules after orthotopic injection of MDA-MB-436 cells that have been infected with an empty retroviral vector or vectors for overexpression of SERPINE2 or SLPI (Wilcoxon rank-sum P < 0.05 for SERPINE2 isoform NM_001136528 and SLPI, n = 9 mice). f, Sub-clonal analysis of MDA-MB-436 cells that have been infected with an empty retroviral vector or vectors for overexpression of SERPINE2 or SLPI. Each cell line was infected with a barcode library and then the number of clones were quantified in the primary tumour, cardiovascular CTCs and lung metastatic cells (P < 0.02, Wilcoxon rank-sum, for SERPINE2 isoform NM_001136528 and SLPI in CTCs and lung metastasis, n = 5 mice). For all box plots, the edges of the box are the twenty-fifth and seventy-fifth percentiles. The error bars extend to the values _q_3 + w(_q_3−_q_1) and _q_1 − w(_q_3 − _q_1), where w is 1.5 and _q_1 and _q_3 are the twenty-fifth and seventy-fifth percentiles.
Extended Data Figure 9. Effect of warfarin on leakiness, metastasis and clonal abundance
a, Levels of prothrombin fragments F1 and F2 (active component of blood coagulation), as quantified by ELISA, after administration of warfarin in the drinking water of mice (P < 0.01, Wilcoxon rank-sum, n = 4 mice). b, DAPI and dextran Alexa 647 staining to visualize vascular leakage in primary tumours derived from the pool of 23 clonal lines. Animals were administered drinking water either with or without 10mg ml−1 warfarin. c, Leakiness index of primary tumours resulting from orthotopic injection of the pool of 23 clonal lines. After injection mice were administered drinking water with no warfarin or water containing 10mg ml−1 warfarin (P < 0.000005, Wilcoxon rank-sum, n = 10 mice). d, Counts of lung metastatic nodules in animals that were injected intravenously with the pool of 23 clonal lines administered drinking water with no warfarin or water containing 10mg ml−1 of warfarin (P,0.05, Wilcoxon rank-sum, n = 10 mice). e, The pool of 23 clonal lines was injected orthotopically and the mice administered drinking water with no warfarin or 10mg ml−1 warfarin. The percentage abundance of each clone in the cardiovascular CTCs of animals (either pre- or post-injection, P < 0.002, n = 7 mice for no warfarin, n = 7 mice for pre-injection and n = 5 mice for post-injection). f, The clone proportions in the resultant primary tumours and lung metastases described in (e) (P<0.003, Wilcoxon rank-sum, for lung metastases, n = 7 mice for no warfarin, n = 7 mice for pre-injection and n = 5 mice for post-injection). For all box plots, the edges of the box are the twenty-fifth and seventy-fifth percentiles. The error bars extend to the values _q_3 + w(_q_3 − _q_1), and _q_1 − w(_q_3 − _q_1), in which w is 1.5 and _q_1 and _q_3 are the twenty-fifth and seventy-fifth percentiles.
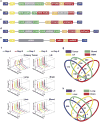
Figure 1. Clonal analysis of 4T1 transplantation by molecular barcoding
a, Retroviral barcoding strategy for identifying clonal populations within the 4T1 cell line. b, Relative proportions of clones that engrafted in all animals in the lymph node (LN), lung, liver, brain and blood. Columns represent independent experiments (n = 5 mice). Shown are the ∼1,400 clones that successfully engrafted in all animals.
Figure 2. Focused analysis of a subset of 4T1 clones throughout metastatic disease progression
a, Strategy for isolating individual molecularly barcoded 4T1 clones. b, Relative proportions of the clonal lines in vitro and in orthotopic primary tumours at 14 and 24 days (in vitro n =10 cell lines, in vivo n = 18 mice). c, Relative proportions of clonal lines among the vascular CTCs and secondary lesions in lymph node, brain, liver and lungs in animals corresponding to the tumours extracted at 24 days in b (n = 8 mice). d, Subclonal analysis of 4T1-L, 4T1-E and 4T1-T cells via secondary barcode library infection. Clonal lines were separately infected with a second barcode library, pooled with the 22 other lines and then orthotopically injected into two mice. Indicated is the number of clones identifiedin100 bootstrap samplesof1million sequence reads. e, Immunohistochemistry analysis for mCherry in lung metastases resulting from each of the three pooled injections discussed in d. mCherry is expressed in the secondary barcode library. Original magnification, ×20.
Figure 3. Serpine2 and Slpi are regulators of intravasation into the cardiovascular system
a, Genes upregulated in the intravasating clones 4T1-E and 4T1-T. RNA sequencing (RNA-seq) was performed for all clonal lines (n = 2 per cell line) as well as for two pairs of matched primary tumours and lung metastases. Grey dots represent the fold change of each gene in 4T1-E (light grey) or 4T1-T (dark grey) relative to each of the other clonal lines (the median values are plotted as blue and red dots for 4T1-E and 4T1-T, respectively). The green dotted lines represent the mean fold change in the tumour and lung metastases (met) pairs. b, Relative proportions of clonal lines in the CTCs and lung where 4T1-T has been infected with non-targeting shRNAs and shRNAs targeting Serpine2 and Slpi (P< 0.02, Wilcoxon rank-sum, n = 5 mice).
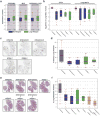
Figure 4. Vascular mimicry drives metastatic progression
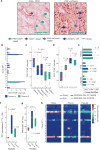
a, Serial sections of a primary tumour derived from 4T1-T cells constitutively expressing mCherry stained with PAS and either CD31 or mCherry. Brown arrow indicates CD31-positive blood vessels, green arrows CD31-negative/PAS-positive channels, blue arrows show mCherry-positive tumour cells, and grey arrows show PAS+ channels lined by mCherry-positive tumour cells. Scale bars, 50μm. b, Quantification of CD31−/PAS+ channels in tumours derived from each clonal line (median of n = 5 fields plotted). c, Quantification of CD31−/PAS+ channels in 4T1-T-derived primary tumours that have been infected with a non-targeting shRNA and shRNAs targeting Serpine2 or Slpi (P < 0.02, Wilcoxon rank-sum, n = 20 fields for shRenilla and n = 25 fields for shSerpine2-1, shSerpine2-2, shSlpi-1 and shSlpi-2). d, Quantification of CD31−/PAS+ channels in MDA-MB-231-derived primary tumours cells that have been infected with an empty vector or vectors for overexpression of SERPINE2 or SLPI (P < 0.0002, Wilcoxon rank-sum, n = 25 fields for empty, n = 14 fields for SERPINE2 (NM_001135528 and NM_0016216) and n = 9 fields for SLPI). e, Sub-clonal analysis of MDA-MB-231 cells that have been infected with an empty vector or vectors for overexpression of SERPINE2 or SLPI (P < 0.04, Wilcoxon rank-sum, n = 5 mice). f, Cardiovascular CTC abundance (measured by qPCR of the barcode vector) in animals injected orthotopically with all 23 clonal lines and administered regular drinking water or water containing 10 mg ml−1 warfarin (P < 0.05, Wilcoxon rank-sum, n = 9, 10 and 6 mice for mice administered no warfarin, warfarin pre-injection and warfarin post-injection, respectively). g, Numbers of lung metastatic nodules identified in the animals described in f (P < 0.04, Wilcoxon rank-sum, n = 9, 10 and 6 mice for mice administered no warfarin, warfarin pre-injection and warfarin post-injection, respectively). h, Relative proportions of each clone in the cardiovascular CTCs of animals that were orthotopically injected with the 23-clone pool and administered regular drinking water or water containing 10 mg ml−1 warfarin (either pre- or post-injection, P < 0.002, Wilcoxon rank-sum, n = 7, 7 and 5 mice for mice administered no warfarin, warfarin preinjection and warfarin post-injection, respectively). For all box plots, the edges of the box are the twenty-fifth and seventy-fifth percentiles. The error bars extend to the values _q_3 + w(_q_3 − _q_1) and _q_1 − w(_q_3 − _q_1), in which w is 1.5 and _q_1 and _q_3 are the twenty-fifth and seventy-fifth percentiles, respectively.
Comment in
- Cancer: An extravascular route for tumour cells.
Hendrix MJ. Hendrix MJ. Nature. 2015 Apr 16;520(7547):300-2. doi: 10.1038/nature14382. Epub 2015 Apr 8. Nature. 2015. PMID: 25855292 No abstract available.
Similar articles
- Serpin E2 promotes breast cancer metastasis by remodeling the tumor matrix and polarizing tumor associated macrophages.
Smirnova T, Bonapace L, MacDonald G, Kondo S, Wyckoff J, Ebersbach H, Fayard B, Doelemeyer A, Coissieux MM, Heideman MR, Bentires-Alj M, Hynes NE. Smirnova T, et al. Oncotarget. 2016 Dec 13;7(50):82289-82304. doi: 10.18632/oncotarget.12927. Oncotarget. 2016. PMID: 27793045 Free PMC article. - A microRNA regulon that mediates endothelial recruitment and metastasis by cancer cells.
Png KJ, Halberg N, Yoshida M, Tavazoie SF. Png KJ, et al. Nature. 2011 Dec 14;481(7380):190-4. doi: 10.1038/nature10661. Nature. 2011. PMID: 22170610 - The secretory leukocyte protease inhibitor (SLPI) suppresses cancer cell invasion but promotes blood-borne metastasis via an invasion-independent pathway.
Sugino T, Yamaguchi T, Ogura G, Kusakabe T, Goodison S, Homma Y, Suzuki T. Sugino T, et al. J Pathol. 2007 Jun;212(2):152-60. doi: 10.1002/path.2156. J Pathol. 2007. PMID: 17455170 Free PMC article. - A mouse mammary gland involution mRNA signature identifies biological pathways potentially associated with breast cancer metastasis.
Stein T, Salomonis N, Nuyten DS, van de Vijver MJ, Gusterson BA. Stein T, et al. J Mammary Gland Biol Neoplasia. 2009 Jun;14(2):99-116. doi: 10.1007/s10911-009-9120-1. Epub 2009 Apr 30. J Mammary Gland Biol Neoplasia. 2009. PMID: 19408105 Review. - Cancer Cell-derived Secretory Factors in Breast Cancer-associated Lung Metastasis: Their Mechanism and Future Prospects.
Urooj T, Wasim B, Mushtaq S, Shah SNN, Shah M. Urooj T, et al. Curr Cancer Drug Targets. 2020;20(3):168-186. doi: 10.2174/1568009620666191220151856. Curr Cancer Drug Targets. 2020. PMID: 31858911 Free PMC article. Review.
Cited by
- Detection and visualization of differential splicing in RNA-Seq data with JunctionSeq.
Hartley SW, Mullikin JC. Hartley SW, et al. Nucleic Acids Res. 2016 Sep 6;44(15):e127. doi: 10.1093/nar/gkw501. Epub 2016 Jun 1. Nucleic Acids Res. 2016. PMID: 27257077 Free PMC article. - Cytotrophoblast extracellular vesicles enhance decidual cell secretion of immune modulators via TNFα.
Taylor SK, Houshdaran S, Robinson JF, Gormley MJ, Kwan EY, Kapidzic M, Schilling B, Giudice LC, Fisher SJ. Taylor SK, et al. Development. 2020 Sep 8;147(17):dev187013. doi: 10.1242/dev.187013. Development. 2020. PMID: 32747437 Free PMC article. - Targeted imaging and inhibition of triple-negative breast cancer metastases by a PDGFRβ aptamer.
Camorani S, Hill BS, Collina F, Gargiulo S, Napolitano M, Cantile M, Di Bonito M, Botti G, Fedele M, Zannetti A, Cerchia L. Camorani S, et al. Theranostics. 2018 Oct 6;8(18):5178-5199. doi: 10.7150/thno.27798. eCollection 2018. Theranostics. 2018. PMID: 30429893 Free PMC article. - In Vitro Models of Blood and Lymphatic Vessels-Connecting Tissues and Immunity.
Bogseth A, Ramirez A, Vaughan E, Maisel K. Bogseth A, et al. Adv Biol (Weinh). 2023 May;7(5):e2200041. doi: 10.1002/adbi.202200041. Epub 2022 Jun 25. Adv Biol (Weinh). 2023. PMID: 35751460 Free PMC article. Review. - Crosstalk between Cancer Cells and Fibroblasts for the Production of Monocyte Chemoattractant Protein-1 in the Murine 4T1 Breast Cancer.
Imamura M, Li T, Li C, Fujisawa M, Mukaida N, Matsukawa A, Yoshimura T. Imamura M, et al. Curr Issues Mol Biol. 2021 Oct 22;43(3):1726-1740. doi: 10.3390/cimb43030122. Curr Issues Mol Biol. 2021. PMID: 34698088 Free PMC article.
References
- Miller FR, Miller BE, Heppner GH. Characterization of metastatic heterogeneity among subpopulations of a single mouse mammary tumor: heterogeneity in phenotypic stability. Invasion Metastasis. 1983;3:22–31. - PubMed
- Miller BE, Miller FR, Wilburn D, Heppner GH. Dominance of a tumor subpopulation line in mixed heterogeneous mouse mammary tumors. Cancer Res. 1988;48:5747–5753. - PubMed
- Fidler IJ, Kripke ML. Metastasis results from preexisting variant cells within a malignant tumor. Science. 1977;197:893–895. - PubMed
- Fidler IJ. Tumor heterogeneity and the biology of cancer invasion and metastasis. Cancer Res. 1978;38:2651–2660. - PubMed
Publication types
MeSH terms
Substances
Grants and funding
- P50-CA58223-09A1/CA/NCI NIH HHS/United States
- 21143/CRUK_/Cancer Research UK/United Kingdom
- HHMI/Howard Hughes Medical Institute/United States
- P50 CA058223/CA/NCI NIH HHS/United States
- R01 GM062534/GM/NIGMS NIH HHS/United States
- P30 CA045508/CA/NCI NIH HHS/United States
- P01 CA013106/CA/NCI NIH HHS/United States
- R37 GM062534/GM/NIGMS NIH HHS/United States
- 5P30CA045508/CA/NCI NIH HHS/United States
LinkOut - more resources
Full Text Sources
Other Literature Sources
Medical
Molecular Biology Databases
Miscellaneous
