Distinct Commensals Induce Interleukin-1β via NLRP3 Inflammasome in Inflammatory Monocytes to Promote Intestinal Inflammation in Response to Injury - PubMed (original) (raw)
. 2015 Apr 21;42(4):744-55.
doi: 10.1016/j.immuni.2015.03.004. Epub 2015 Apr 7.
Nobuhiko Kamada 2, Raúl Muñoz-Planillo 1, Yun-Gi Kim 1, Donghyun Kim 1, Yukiko Koizumi 1, Mizuho Hasegawa 1, Stephanie D Himpsl 3, Hilary P Browne 4, Trevor D Lawley 4, Harry L T Mobley 3, Naohiro Inohara 1, Gabriel Núñez 5
Affiliations
- PMID: 25862092
- PMCID: PMC4408263
- DOI: 10.1016/j.immuni.2015.03.004
Distinct Commensals Induce Interleukin-1β via NLRP3 Inflammasome in Inflammatory Monocytes to Promote Intestinal Inflammation in Response to Injury
Sang-Uk Seo et al. Immunity. 2015.
Abstract
The microbiota stimulates inflammation, but the signaling pathways and the members of the microbiota involved remain poorly understood. We found that the microbiota induces interleukin-1β (IL-1β) release upon intestinal injury and that this is mediated via the NLRP3 inflammasome. Enterobacteriaceae and in particular the pathobiont Proteus mirabilis, induced robust IL-1β release that was comparable to that induced by the pathogen Salmonella. Upon epithelial injury, production of IL-1β in the intestine was largely mediated by intestinal Ly6C(high) monocytes, required chemokine receptor CCR2 and was abolished by deletion of IL-1β in CCR2(+) blood monocytes. Furthermore, colonization with P. mirabilis promoted intestinal inflammation upon intestinal injury via the production of hemolysin, which required NLRP3 and IL-1 receptor signaling in vivo. Thus, upon intestinal injury, selective members of the microbiota stimulate newly recruited monocytes to induce NLRP3-dependent IL-1β release, which promotes inflammation in the intestine.
Copyright © 2015 Elsevier Inc. All rights reserved.
Figures
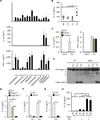
Figure 1. Commensal bacteria induce IL-1β
(A) Fecal contents (FC) obtained from GF or SPF mice were used to stimulate BMDM for 18 hrs. IL-1β was measured from culture supernatant by ELISA. (B) Total LP cells were isolated from PBS or antibiotic cocktail (ABX)-treated mice on day 7 after mock or 2.5% DSS treatment and cultured for 3 hrs. IL-1β, IL-6, and TNF-α from culture supernatant were measured by ELISA. (C) and (D) GF and SPF mice were treated with 2% DSS from day 0 to 6. Total LP cells were isolated on day 7. (C) Total LP cells were cultured for 3 hrs and IL-1β was measured by ELISA. (D) pro-IL-1β mRNA expression was analyzed by qRT-PCR and normalized relative to GAPDH expression. (A)-(D) Data are representative of at least two individual experiments and values represent mean of triplicate samples ± SD. **p < 0.01, ***p < 0.001.
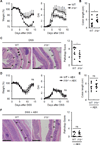
Figure 2. IL-1β induced by the commensal bacteria promotes colitis
(A) WT and _Il1b_−/− mice were treated with 2% DSS from day 0 to day 6. Body weight and disease activity index (DAI) were measured daily for two weeks. Values represent means ± SEM. (B) and (C) WT and _Il1b_−/− mice were treated with 2% DSS from day 0 to day 6 and euthanized at day 10. (B) Colon length was measured and (C) pathology score were assessed. (D) WT and _Il1b_−/− mice were treated with 2% DSS from day 0 to day 6 and received PBS or ABX daily by oral gavage from day −1 to 7. Body weight and disease activity index (DAI) were measured daily for two weeks. Values represent means ± SEM. (E) and (F) WT and _Il1b_−/− mice were treated with 2% DSS from day 0 to day 6 and and received PBS or ABX daily by oral gavage from day −1 to 7. Mice were euthanized at day 10. (B) Colon length was measured and (C) pathology score were assessed. (C) and (F) Represenative images of the distal colon. Open arrowheads denote mucosal ulcer with total loss of epithelium. Solid arrows indicate presence of acute inflammatory cells and/or edema in the submucosa. Scale bar; 500 µm. Every data are pooled from two separate experiments (n > 8, each group). *p < 0.05, **p < 0.01, ***p < 0.001.
Figure 3. Commensal bacteria induce IL-1β through the NLRP3 inflammasome
(A) and (B) Fecal contents (FC) obtained from SPF mice were used to stimulate WT, _Casp11_−/−, _Casp1_−/− _Casp11_−/− BMDM (A) and WT, _Aim2_−/−, _Nlrc4_−/−, _Nlrp3_−/−, _Pycard_−/− BMDM (B) for 18 hrs. IL-1β and TNF-α were measured from culture supernatant. (C) WT and _Nlrp3_−/− BMDM were stimulated with FC obtained from SPF mice and caspase-1 was detected by immunoblotting. Open arrow heads indicate non-specific bands. (D) and (E) WT, _Casp11_−/−, _Casp1_−/− _Casp11_−/−, _Nlrp3_−/−, and _Pycard_−/− mice were treated with 2.5% DSS from day 0 to 7. Total LP cells were cultured for 3 hrs and IL-1β and IL-6 were measured in culture supernatant. Values represent mean of triplicate samples ± SD. Data are representative for three experiments. *p < 0.05, **p < 0.01, ***p < 0.001.
Figure 4. Recruited inflammatory monocytes are the main source of IL-1β during DSS-induced colitis
(A) Total LP cells isolated on day 0 (naive) and on day 7 (DSS) after DSS treatment were cultured for 3 hrs and left unstimulated or cultured in the presence of 5 mM ATP for the additional 30 min. IL-1β and IL-6 were measured from culture supernatant. (B) and (C) Total LP cells were isolated at indicated times from WT mice given 2.5% DSS from day 0 to day 7. (B) IL-1β was measured from culture supernatant after 3 hrs of culture. (C) Percent of inflammatory monocytes (CD11b+Ly6Chigh) in CD45+ LP cells was determined by flow cytometry. Open circles represents means of values from individual mice. (D) Total LP cells were isolated from DSS-treated mice on day 7 after 2.5% DSS treatment and CD45+ cells were sorted according to CD11b and Ly6C expression. Sorted cells were cultured for 3 hrs and IL-1β in culture supernatant and Nlrp3 mRNA expression was analyzed by ELISA and qRT-PCR, respectively. (E) WT, _Aim2_−/−, _Nlrc4_−/−, _Nlrp3_−/−, and _Pycard_−/− mice were treated with 2.5% DSS for 7 days. Sorted inflammatory monocytes were cultured for 3 hrs and IL-1β was measured in culture supernatant. (F) GF and SPF mice were treated with 2% DSS for 6 days. Sorted inflammatory monocytes (IM) were cultured for 3 hrs and IL-1β was measured in culture supernatant. (G) WT and _Ccr2_−/− mice were treated with 2.5% DSS for 7 days. Total LP cells were cultured for 3 hrs and IL-1β was measured in culture supernatant. (H) IL-1β release by total LP cells isolated from indicated chimera mice. Mice received PBS or diphtheria toxin (DT) on day 0, 3, and 6. LP cells were isolated on day 7 and cultured for 3 hrs to measure cytokine concentrations in culture supernatant. Data are representative of at least two experiments. Values are means of triplicate samples ± SD. *p < 0.05, **p < 0.01, ***p < 0.001. See also Figure S1.
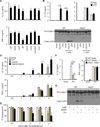
Figure 5. Selective commensals induce IL-1β release through the NLRP3 inflammasome
(A) BMDM were stimulated with indicated mouse commensal bacteria, Citrobacter rodentium (Cr), or Salmonella enterica serovar Typhimurium (_S_T) at a bacteria:macrophage ratio of 1. Ebc, Enterobacter cloacae; Ebh, E. hormaechei; Ecc, Enterococcus casseliflavus; Ecf, E. faecalis; Ecg, E. gallinarum; Ec, Escherichia coli; Ko, Klebsiella oxytoca; Kp, K. pneumoniae; Lm, Lactobacillus murinus; Lr, L. reuteri; Ss, Staphylococcus sciuri; Sx, S. xylosus; Pm, Proteus mirabilis. Levels of cytokines in culture supernatant and pro-IL-1β mRNA expression at 3 hrs were determined by ELISA and qRT-PCR, respectively. Values represent means of triplicate samples ± SD. (B) GF mice were mono-associated with indicated mouse commensal bacteria. Ba, Bacteroides acidifaciens; Cs, Clostridium sporogenes; Ec, E. coli; Pm, P. mirabilis. Mice were treated with 1% DSS for 7 days and total LP cells were isolated and cultured for 3 hrs to assess IL-1β release in supernatant. Means of values from one or two mice are indicated. Results are pooled from three experiments with similar results. (C) WT, Nlrp3−/−, and _Pycard_−/− BMDM were stimulated with mouse Pm and cytokines were measured in culture supernatant after 3 hrs. Values represent means of triplicate samples ± SD. (D) WT and _Nlrp3_−/− BMDM were stimulated with Ec, Pm, and ST for 3 hrs and caspase-1 activation was detected by immunoblotting. (E)-(G) WT or indicated mutant mice were treated with 2.5% DSS for 7 days and total LP cells were isolated and were stimulated with indicated bacteria at a bacteria: macrophage ratio of 1 for 3 hrs. Values represent means of triplicate samples ± SD. (H) GF mice or gnotobiotic mice monocolonized with mouse P. mirabilis by oral gavage were treated with 2% DSS for 6 days. Total LP cells were isolated on day 7 and IL-1β was determined in culture supernatant after 3 hrs. Values represent means of triplicate samples ± SD. Data are representative of at least two experiments. *p < 0.05, **p < 0.01, ***p < 0.001. See also Figure S2 and S3.
Figure 6. P. mirabilis HpmA mediates NLRP3 inflammasome activation
(A) BMDM were pre-incubated with LPS (100 ng/ml) for 3 hrs and then stimulated with P. mirabilis HI4320 (WT) and indicated isogenic mutants for 3 hrs at bacteria:macrophage ratio of 1. Cytokines were measured in culture supernatant after 3 hrs culture. (B) and (C) WT or Nlrp3_−/− BMDM were pre-incubated with Δ_hpmA Pm or LPS (100 ng/ml) for 3 hrs and left unstimulated or cultured in the presence of 5 mM ATP for additional 30 min. (B) IL-1β and TNF-α were measured from culture supernatant of WT BMDM. (C) Caspase-1 activation was detected by immunoblotting. (D) and (E) LPS-treated BMDM were incubated with HpmA-deficient (Δ_hpmA_) P. mirabilis mutant, and the same strain complemented with hpmA plasmid (Δ_hpmA+hpmA_). Cytokines in culture supernatant (D) and intracellular K+ concentrations (E) were measured at different time points. (F) and (G) WT and Nlrp3_−/−_BMDMs were stimulated with P. mirabilis (Pm) in culture medium containing the indicated concentration of extracellular K+. (D) Cytokine concentrations in culture supernatant were determined by ELISA. (E) Active caspase-1 in cell lysate and cell supernatant were detected by immunoblotting. Values are means of triplicate samples ± SD. Data are representative of at least three experiments. *p < 0.05, **p < 0.01, ***p < 0.001. See also Figure S4.
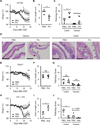
Figure 7. P. mirabilis enhances DSS-induced inflammation via NLRP3 and IL-1R signaling
Streptomycin-treated WT or _Nlrp3_−/− mice were gavaged with 1×10⁹ cfu of streptomycin-resistant P. mirabilis (Pm) on day 0, 4, and 8. Colitis was induced by administration of 1% DSS from day 0 to day 10. Mice were euthanized for analyses on day 15. (A)-(C) WT mice injected with PBS (n = 12) or inoculated with Pm (n = 15). (D) Representative histology of cecum and distal colon in WT mice in the absence and presence of Pm colonization after 1% DSS administration on day 15 after DSS administration. Open arrowheads denote damaged or ulcerated mucosa with total loss of epithelium, solid arrowheads indicate presence of inflammatory cells in the submucosa and edema. Scale bar; 500 µm. (E)-(G) _Nlrp3_−/− mice injected with PBS (n = 12) or inoculated with Pm (n = 11). (H)-(J) _Pm_-colonized WT mice were injected daily with PBS (n = 9) or Anakinra (Ana, 50 mg/kg, n = 8) from day 4. Body weight data were pooled from three (A) and (E) or two (H) separate experiments. Values represent means ± SEM. Colon length and pathology score were pooled from two experiments with similar results. *p < 0.05, **p < 0.01, ***p < 0.001, ns; not significant. See also Figure S5-S7.
Comment in
- Proteus mirabilis: The Enemy Within.
Dzutsev A, Trinchieri G. Dzutsev A, et al. Immunity. 2015 Apr 21;42(4):602-4. doi: 10.1016/j.immuni.2015.04.004. Immunity. 2015. PMID: 25902478
Similar articles
- Proteus mirabilis: The Enemy Within.
Dzutsev A, Trinchieri G. Dzutsev A, et al. Immunity. 2015 Apr 21;42(4):602-4. doi: 10.1016/j.immuni.2015.04.004. Immunity. 2015. PMID: 25902478 - Follistatin-like protein 1 enhances NLRP3 inflammasome-mediated IL-1β secretion from monocytes and macrophages.
Chaly Y, Fu Y, Marinov A, Hostager B, Yan W, Campfield B, Kellum JA, Bushnell D, Wang Y, Vockley J, Hirsch R. Chaly Y, et al. Eur J Immunol. 2014 May;44(5):1467-79. doi: 10.1002/eji.201344063. Epub 2014 Feb 20. Eur J Immunol. 2014. PMID: 24470197 Free PMC article. Clinical Trial. - Propionibacterium acnes Induces IL-1β secretion via the NLRP3 inflammasome in human monocytes.
Qin M, Pirouz A, Kim MH, Krutzik SR, Garbán HJ, Kim J. Qin M, et al. J Invest Dermatol. 2014 Feb;134(2):381-388. doi: 10.1038/jid.2013.309. Epub 2013 Jul 24. J Invest Dermatol. 2014. PMID: 23884315 Free PMC article. - Mechanism and Regulation of NLRP3 Inflammasome Activation.
He Y, Hara H, Núñez G. He Y, et al. Trends Biochem Sci. 2016 Dec;41(12):1012-1021. doi: 10.1016/j.tibs.2016.09.002. Epub 2016 Sep 23. Trends Biochem Sci. 2016. PMID: 27669650 Free PMC article. Review. - The NLRP3 inflammasome in health and disease: the good, the bad and the ugly.
Menu P, Vince JE. Menu P, et al. Clin Exp Immunol. 2011 Oct;166(1):1-15. doi: 10.1111/j.1365-2249.2011.04440.x. Epub 2011 Jul 15. Clin Exp Immunol. 2011. PMID: 21762124 Free PMC article. Review.
Cited by
- Human gut microbiota stimulate defined innate immune responses that vary from phylum to strain.
Spindler MP, Siu S, Mogno I, Li Z, Yang C, Mehandru S, Britton GJ, Faith JJ. Spindler MP, et al. Cell Host Microbe. 2022 Oct 12;30(10):1481-1498.e5. doi: 10.1016/j.chom.2022.08.009. Epub 2022 Sep 12. Cell Host Microbe. 2022. PMID: 36099923 Free PMC article. - Roles of Macrophages in the Development and Treatment of Gut Inflammation.
Han X, Ding S, Jiang H, Liu G. Han X, et al. Front Cell Dev Biol. 2021 Mar 2;9:625423. doi: 10.3389/fcell.2021.625423. eCollection 2021. Front Cell Dev Biol. 2021. PMID: 33738283 Free PMC article. Review. - _N_-acetylcysteine prevents catheter occlusion and inflammation in catheter associated-urinary tract infections by suppressing urease activity.
Manoharan A, Farrell J, Aldilla VR, Whiteley G, Kriel E, Glasbey T, Kumar N, Moore KH, Manos J, Das T. Manoharan A, et al. Front Cell Infect Microbiol. 2023 Oct 26;13:1216798. doi: 10.3389/fcimb.2023.1216798. eCollection 2023. Front Cell Infect Microbiol. 2023. PMID: 37965267 Free PMC article. - Rosiglitazone ameliorates radiation-induced intestinal inflammation in rats by inhibiting NLRP3 inflammasome and TNF-α production.
Hu L, Chen H, Zhang X, Feng Z, Zhang H, Meng Q. Hu L, et al. J Radiat Res. 2020 Nov 16;61(6):842-850. doi: 10.1093/jrr/rraa062. J Radiat Res. 2020. PMID: 32876675 Free PMC article. - Intestinal inflammation alters the antigen-specific immune response to a skin commensal.
Merana GR, Dwyer LR, Dhariwala MO, Weckel A, Gonzalez JR, Okoro JN, Cohen JN, Tamaki CM, Han J, Tasoff P, Palacios-Calderon Y, Ha CWY, Lynch SV, Segre JA, Kong HH, Kattah MG, Ma A, Scharschmidt TC. Merana GR, et al. Cell Rep. 2022 May 31;39(9):110891. doi: 10.1016/j.celrep.2022.110891. Cell Rep. 2022. PMID: 35649365 Free PMC article.
References
- Bauer C, Duewell P, Lehr HA, Endres S, Schnurr M. Protective and aggravating effects of Nlrp3 inflammasome activation in IBD models: influence of genetic and environmental factors. Dig. Dis. 2012;1(30 Suppl.):82–90. - PubMed
Publication types
MeSH terms
Substances
Grants and funding
- DK095782/DK/NIDDK NIH HHS/United States
- R01 AI116791/AI/NIAID NIH HHS/United States
- R01 DK091191/DK/NIDDK NIH HHS/United States
- DK091191/DK/NIDDK NIH HHS/United States
- P30 DK034933/DK/NIDDK NIH HHS/United States
- NIDDK 5P30DK034933/PHS HHS/United States
- WT086418MA/WT_/Wellcome Trust/United Kingdom
- R01 AI059722/AI/NIAID NIH HHS/United States
- 098051/WT_/Wellcome Trust/United Kingdom
- R01 DK095782/DK/NIDDK NIH HHS/United States
- WT_/Wellcome Trust/United Kingdom
- R01 AI063331/AI/NIAID NIH HHS/United States
LinkOut - more resources
Full Text Sources
Other Literature Sources
Molecular Biology Databases


