Prion-like transmission of neuronal huntingtin aggregates to phagocytic glia in the Drosophila brain - PubMed (original) (raw)
Prion-like transmission of neuronal huntingtin aggregates to phagocytic glia in the Drosophila brain
Margaret M P Pearce et al. Nat Commun. 2015.
Abstract
The brain has a limited capacity to self-protect against protein aggregate-associated pathology, and mounting evidence supports a role for phagocytic glia in this process. We have established a Drosophila model to investigate the role of phagocytic glia in clearance of neuronal mutant huntingtin (Htt) aggregates associated with Huntington disease. We find that glia regulate steady-state numbers of Htt aggregates expressed in neurons through a clearance mechanism that requires the glial scavenger receptor Draper and downstream phagocytic engulfment machinery. Remarkably, some of these engulfed neuronal Htt aggregates effect prion-like conversion of soluble, wild-type Htt in the glial cytoplasm. We provide genetic evidence that this conversion depends strictly on the Draper signalling pathway, unveiling a previously unanticipated role for phagocytosis in transfer of pathogenic protein aggregates in an intact brain. These results suggest a potential mechanism by which phagocytic glia contribute to both protein aggregate-related neuroprotection and pathogenesis in neurodegenerative disease.
Conflict of interest statement
Competing Financial Interests
The authors declare no competing financial interests.
Figures
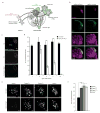
Figure 1. HttQ91 aggregates are cleared from ORN axons by phagocytic glia
(a) Cartoon depicting Drosophila olfactory system circuitry and the glial subtypes present in and around the antennal lobe. To evaluate the fate of HttQ91 aggregates formed in ORNs, a QF driver was used to express HttQ91 in a single class of ORNs whose axons terminate in the DA1 glomerulus of the antennal lobe. To assess transmission of HttQ91 aggregates from ORNs to glia, expression of HttQ91 in DA1 ORNs was coupled with Gal4-mediated expression of HttQ25 in glia. (b) Expression of HttQ25 or HttQ91 in DA1 ORNs. Expression of mCherry-tagged HttQ25 or HttQ91 (red) was restricted to the DA1 glomerulus, indicated by co-expression of the membrane marker mCD8-GFP (green). Antennal lobe neuropil was labeled with antibodies against Bruchpilot (Brp, magenta). Scale bars, 10μm. (c) HttQ91 expression in DA1 ORNs without or with antennal injury. Maximum intensity Z-projections of antennal lobes from 1 or 7 day-old adult flies expressing HttQ91 in DA1 ORNs, without or with antennal injury performed on day 1. Boundaries of each antennal lobe (“AL”; dotted lines) were approximated using DAPI-stained cell body nuclei that mark the periphery of the antennal lobe (not shown), and boundaries of each DA1 glomerulus (“DA1g”; solid lines) were approximated using HttQ91 signal. Scale bars, 10μm. (d) Average numbers of HttQ91 aggregates detected in the antennal lobe at the indicated ages without (black bars) or with (white bars) antennal injury were graphed (n.d. = not determined, n ≥ 10, ± s.e.m., *** p < 0.0005, Student’s _t_-test). (e) Draper mediates basal and injury-induced clearance of HttQ91 aggregates from DA1 ORNs. Draper was depleted using two independent UAS-RNAi lines expressed in glia or using the drprΔ5 null mutation (draper−/−), and maximum intensity Z-projections of the DA1 glomerulus from 7 day-old flies without or without antennal injury are shown. Scale bars, 5μm. (f) Average numbers of HttQ91 puncta were quantified for 7 day-old adults of the indicated genotype and graphed (n ≥ 8, ± s.e.m., *** p < 0.0005, one-way ANOVA followed by Tukey’s post hoc test).
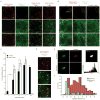
Figure 2. Prion-like transfer of HttQ91 aggregates from ORNs to the cytoplasm of glia
(a) HttQ25 aggregates when co-expressed with HttQ91 in glia. Maximum intensity Z-projections of one antennal lobe from 7 day-old adult flies expressing HttQ91-mCherry alone, HttQ25-YFP alone, HttQ91-mCherry and HttQ25-GFP together, or HttQ91-mCherry and GFP together in glia. The approximate boundary of each antennal lobe (“AL”) is indicated by the dotted lines. Scale bars, 10μm. (b) Induced aggregation of HttQ25 in glia by expression of HttQ91 in DA1 ORNs. Maximum intensity Z-projections of the antennal lobe from adult flies of the indicated age expressing HttQ91-mCherry in DA1 ORNs and HttQ25-YFP in glia, without or with antennal injury performed on day 1. Approximate boundaries of antennal lobes (“AL”; dotted line) and DA1 glomeruli (“DA1g”; solid line) are drawn. Because larger HttQ91 aggregates lacking HttQ25 dominate the red signal, co-localization between HttQ25 and smaller HttQ91 aggregates is underrepresented in the merged images. Fig. 2d demonstrates co-localization of HttQ25 with HttQ91 in a single Z-slice. Scale bars, 10μm. (c) Quantification of the number of glial HttQ25 puncta that were present as the flies age. The average numbers of HttQ25-YFP puncta detected in each antennal lobe without or with antennal injury were graphed as a function of time (n.d. = not determined, n ≥ 10, ± s.e.m., * p < 0.05, *** p < 0.0005, Student’s _t_-test). (d) A single 1.0μm optical Z-slice from the DA1 glomerulus of a 7 day-old fly with the same genotype as in (b and c). Arrows indicate HttQ25 aggregates (green) that co-localize with HttQ91 signal (red). Scale bar = 5μm. (e) YFP and mCherry fluorescence from a single HttQ25- and HttQ91-containing aggregate before (top) and after (bottom) photobleaching of the mCherry signal. Pixel-by-pixel FRET efficiency is shown in the heat map image and associated histogram. The mean FRET efficiency of the aggregate shown was ~28%. Scale bar, 1μm. (f) Histogram showing the distribution of diameters for all HttQ91 puncta detected in the DA1 glomerulus of 7 day-old flies (n = 204, red bars), and for those HttQ91 puncta that co-localized with HttQ25 (green bars).
Figure 3. Neuronal HttQ91 and glial HttQ25 aggregates associate with cytoplasmic markers
(a–c) Co-localization of HttQ91 or HttQ25 aggregates with the endogenous cytoplasmic markers Hsp70/Hsc70, Hsp90, and ubiquitin. Single 1.0μm optical Z-slices from the DA1 glomerulus of 7 day-old adult flies expressing HttQ91-mCherry in DA1 ORNs and HttQ25-YFP in glia and immunostained with antibodies against Hsp70/Hsc70 (a), Hsp90 (b), and ubiquitin (c). Unfilled arrowheads indicate HttQ91 aggregates that lack associated HttQ25 signal, and filled arrows indicate induced HttQ25 aggregates in glia. Scale bars, 5μm. (d) Quantification of the % co-localization of each aggregate subtype with the endogenous cytoplasmic markers (n ≥ 4, ± s.e.m., * p < 0.05, ** p < 0.01, *** p < 0.001, one-way ANOVA followed by Tukey’s post hoc test).
Figure 4. Draper is required for nucleation of glial HttQ25 by neuronal HttQ91 aggregates
(a) Draper is essential for transfer of HttQ91 aggregates from DA1 ORN axons to the glial cytoplasm. Maximum intensity Z-projections of the DA1 glomerulus from 7 day-old adult fly brains expressing HttQ91-mCherry in DA1 ORNs and HttQ25-YFP in glia, either without (control) or with depletion of Draper expression using two independent RNAi lines (DraperRNAi1 and DraperRNAi2) or the drprΔ5 null mutation (draper−/−). Scale bars, 5μm. (b) Quantification of the number of induced HttQ25 aggregates detected in the antennal lobe of 7 day-old adult flies as in (a) (n ≥ 8, ± s.e.m., *** p < 0.0005, one-way ANOVA followed by Tukey’s post hoc test)
Figure 5. Nucleation of glial HttQ25 by neuronal HttQ91 aggregates requires phagocytic engulfment genes
(a–k) Shark, Rac1, Crk, and dCed12 mediate entry of HttQ91 aggregates into the glial cytoplasm to induce aggregation of HttQ25. Maximum intensity Z-projections of the DA1 glomerulus from 6–8 day-old adult fly brains expressing HttQ91-mCherry in DA1 ORNs and HttQ25-YFP in glia, without (a) or with (b–i) glial expression of dsRNAs targeting shark (b), Rac1 (c), Crk (d and e), dCed12 (f) or bsk (g–i). Scale bars, 5μm. (j and k) Average numbers of HttQ91 aggregates (j) or induced HttQ25 aggregates (k) detected in the antennal lobe of 6–8 day-old adult fly brains as shown in (a) (n ≥ 8, ± s.e.m., * p < 0.05, ** p < 0.005, *** p < 0.0005, one-way ANOVA followed by Tukey’s post hoc test).
Similar articles
- Impairment of the Glial Phagolysosomal System Drives Prion-Like Propagation in a Drosophila Model of Huntington's Disease.
Davis GH, Zaya A, Pearce MMP. Davis GH, et al. J Neurosci. 2024 May 15;44(20):e1256232024. doi: 10.1523/JNEUROSCI.1256-23.2024. J Neurosci. 2024. PMID: 38589228 Free PMC article. - Phagocytic glia are obligatory intermediates in transmission of mutant huntingtin aggregates across neuronal synapses.
Donnelly KM, DeLorenzo OR, Zaya AD, Pisano GE, Thu WM, Luo L, Kopito RR, Panning Pearce MM. Donnelly KM, et al. Elife. 2020 May 28;9:e58499. doi: 10.7554/eLife.58499. Elife. 2020. PMID: 32463364 Free PMC article. - Downregulation of glial genes involved in synaptic function mitigates Huntington's disease pathogenesis.
Onur TS, Laitman A, Zhao H, Keyho R, Kim H, Wang J, Mair M, Wang H, Li L, Perez A, de Haro M, Wan YW, Allen G, Lu B, Al-Ramahi I, Liu Z, Botas J. Onur TS, et al. Elife. 2021 Apr 19;10:e64564. doi: 10.7554/eLife.64564. Elife. 2021. PMID: 33871358 Free PMC article. - Visualization of prion-like transfer in Huntington's disease models.
Jansen AH, Batenburg KL, Pecho-Vrieseling E, Reits EA. Jansen AH, et al. Biochim Biophys Acta Mol Basis Dis. 2017 Mar;1863(3):793-800. doi: 10.1016/j.bbadis.2016.12.015. Epub 2016 Dec 29. Biochim Biophys Acta Mol Basis Dis. 2017. PMID: 28040507 Review. - Intercellular Spread of Protein Aggregates in Neurodegenerative Disease.
Davis AA, Leyns CEG, Holtzman DM. Davis AA, et al. Annu Rev Cell Dev Biol. 2018 Oct 6;34:545-568. doi: 10.1146/annurev-cellbio-100617-062636. Epub 2018 Jul 25. Annu Rev Cell Dev Biol. 2018. PMID: 30044648 Free PMC article. Review.
Cited by
- Mutational analysis implicates the amyloid fibril as the toxic entity in Huntington's disease.
Drombosky KW, Rode S, Kodali R, Jacob TC, Palladino MJ, Wetzel R. Drombosky KW, et al. Neurobiol Dis. 2018 Dec;120:126-138. doi: 10.1016/j.nbd.2018.08.019. Epub 2018 Aug 30. Neurobiol Dis. 2018. PMID: 30171891 Free PMC article. - Phagocytic Roles of Glial Cells in Healthy and Diseased Brains.
Jung YJ, Chung WS. Jung YJ, et al. Biomol Ther (Seoul). 2018 Jul 1;26(4):350-357. doi: 10.4062/biomolther.2017.133. Biomol Ther (Seoul). 2018. PMID: 29316776 Free PMC article. Review. - C. elegans neurons jettison protein aggregates and mitochondria under neurotoxic stress.
Melentijevic I, Toth ML, Arnold ML, Guasp RJ, Harinath G, Nguyen KC, Taub D, Parker JA, Neri C, Gabel CV, Hall DH, Driscoll M. Melentijevic I, et al. Nature. 2017 Feb 16;542(7641):367-371. doi: 10.1038/nature21362. Epub 2017 Feb 8. Nature. 2017. PMID: 28178240 Free PMC article. - Transcellular spreading of huntingtin aggregates in the Drosophila brain.
Babcock DT, Ganetzky B. Babcock DT, et al. Proc Natl Acad Sci U S A. 2015 Sep 29;112(39):E5427-33. doi: 10.1073/pnas.1516217112. Epub 2015 Sep 8. Proc Natl Acad Sci U S A. 2015. PMID: 26351672 Free PMC article. - Astrocytes and microglia in neurodegenerative diseases: Lessons from human in vitro models.
Franklin H, Clarke BE, Patani R. Franklin H, et al. Prog Neurobiol. 2021 May;200:101973. doi: 10.1016/j.pneurobio.2020.101973. Epub 2020 Dec 9. Prog Neurobiol. 2021. PMID: 33309801 Free PMC article. Review.
References
- Knowles TP, Vendruscolo M, Dobson CM. The amyloid state and its association with protein misfolding diseases. Nat Rev Mol Cell Biol. 2014;15:384–396. - PubMed
- Braak H, Braak E. Neuropathological stageing of Alzheimer-related changes. Acta Neuropathol. 1991;82:239–259. - PubMed
- Braak H, Ghebremedhin E, Rub U, Bratzke H, Del Tredici K. Stages in the development of Parkinson’s disease-related pathology. Cell Tissue Res. 2004;318:121–134. - PubMed
- Costanzo M, et al. Transfer of polyglutamine aggregates in neuronal cells occurs in tunneling nanotubes. J Cell Sci. 2013;126:3678–3685. - PubMed
Publication types
MeSH terms
Substances
Grants and funding
- 5R01NS042842/NS/NINDS NIH HHS/United States
- R01 DC005982/DC/NIDCD NIH HHS/United States
- 5R01DC005982/DC/NIDCD NIH HHS/United States
- NS70420/NS/NINDS NIH HHS/United States
- F32 NS070420/NS/NINDS NIH HHS/United States
- R01 NS042842/NS/NINDS NIH HHS/United States
LinkOut - more resources
Full Text Sources
Other Literature Sources
Medical
Molecular Biology Databases


