Gut dysbiosis is linked to hypertension - PubMed (original) (raw)
Comparative Study
. 2015 Jun;65(6):1331-40.
doi: 10.1161/HYPERTENSIONAHA.115.05315. Epub 2015 Apr 13.
Monica M Santisteban 1, Vermali Rodriguez 1, Eric Li 1, Niousha Ahmari 1, Jessica Marulanda Carvajal 1, Mojgan Zadeh 1, Minghao Gong 1, Yanfei Qi 1, Jasenka Zubcevic 1, Bikash Sahay 1, Carl J Pepine 1, Mohan K Raizada 2, Mansour Mohamadzadeh 2
Affiliations
- PMID: 25870193
- PMCID: PMC4433416
- DOI: 10.1161/HYPERTENSIONAHA.115.05315
Comparative Study
Gut dysbiosis is linked to hypertension
Tao Yang et al. Hypertension. 2015 Jun.
Abstract
Emerging evidence suggests that gut microbiota is critical in the maintenance of physiological homeostasis. This study was designed to test the hypothesis that dysbiosis in gut microbiota is associated with hypertension because genetic, environmental, and dietary factors profoundly influence both gut microbiota and blood pressure. Bacterial DNA from fecal samples of 2 rat models of hypertension and a small cohort of patients was used for bacterial genomic analysis. We observed a significant decrease in microbial richness, diversity, and evenness in the spontaneously hypertensive rat, in addition to an increased Firmicutes/Bacteroidetes ratio. These changes were accompanied by decreases in acetate- and butyrate-producing bacteria. In addition, the microbiota of a small cohort of human hypertensive patients was found to follow a similar dysbiotic pattern, as it was less rich and diverse than that of control subjects. Similar changes in gut microbiota were observed in the chronic angiotensin II infusion rat model, most notably decreased microbial richness and an increased Firmicutes/Bacteroidetes ratio. In this model, we evaluated the efficacy of oral minocycline in restoring gut microbiota. In addition to attenuating high blood pressure, minocycline was able to rebalance the dysbiotic hypertension gut microbiota by reducing the Firmicutes/Bacteroidetes ratio. These observations demonstrate that high blood pressure is associated with gut microbiota dysbiosis, both in animal and human hypertension. They suggest that dietary intervention to correct gut microbiota could be an innovative nutritional therapeutic strategy for hypertension.
Keywords: butyrates; dysbiosis; hypertension; microbiota; minocycline.
© 2015 American Heart Association, Inc.
Conflict of interest statement
Disclosures
The authors have no conflicts of interest to disclose.
Figures
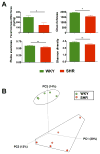
Figure 1. Gut microbiota communities in WKY rats and SHR
A. Decreased micro-ecological parameters of the gut. Fecal samples were collected from WKY (n=5) and SHR (n=6) rats and bacterial 16S ribosomal DNA were amplified and sequenced to analyze the compositions of microbial communities. Fecal biomass and microbial richness, evenness, and diversity of WKY and SHR were evaluated. B. Principal coordinate analysis of WKY and SHR. Weighted uniFrac analyses were used to calculate the distances between fecal samples from WKY and SHR. Each axis percentage describes how much variation that one dimension accounts for. Darker colored circles indicate a point closer to the reader, while lighter colored circles indicate a point further away. By comparing the samples in a 3 dimensional figure, a clear separation was observed between the two clusters, representing WKY and SHR rats, respectively. Results were compared by student’s t-test; * p<0.05; **p<0.01.
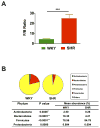
Figure 2. Comparison of microbiota composition between WKY rats and SHR
A. The Firmicutes to Bacteroidetes ratio (F/B ratio) was calculated as a biomarker of gut dysbiosis. B. Phylum breakdown of the four most abundant bacterial communities in the WKY (n=5) and SHR (n=6) fecal samples. A decrease of Bacteroidetes along with an increase of Firmicutes resulted in a dysbiosis signature of gut microbiota in SHR rats. A significant reduction of the Actinobacteria phylum correlated with a lower diversity value. Results were compared by student’s t-test; ** p<0.01; ***p<0.001.
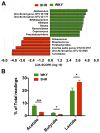
Figure 3. Diminished acetate- and butyrate-producing bacteria in SHR
A. Most enriched and depleted genera in the SHR versus WKY. Miseq reads of bacterial 16S ribosomal DNA were analyzed and assigned to specific genera based on the sequence similarities to Silva non-redundant 16S reference database. Linear discriminant analysis (LDA) along with effect size measurements was applied to present the enriched bacterial genera in SHR (red) and WKY (green). B. The relative proportions of acetate, butyrate and lactate producing bacteria in the gut microbiota in WKY (n=5) and SHR (n=6). Sequence reads were classified according to the primary end product of the assigned bacterial genera. Genera were classified into more than one group correspondingly if they were defined as producers of multiple metabolites. Genera that were defined as producing equol, histamine, hydrogen and propionate constituted a minor portion of the population and were therefore excluded from this analysis. Results were compared by student’s t-test; *p<0.05; ***p<0.001.
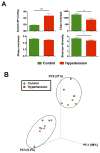
Figure 4. Reduced microbial richness and diversity in hypertension patients
A. Lower microbial richness and diversity in hypertension patients. The hypertension patient demonstrated significantly higher ambient systolic blood pressure when compared with control. Fecal samples from hypertension patient were collected and 16S rDNA library was prepared and analyzed by illumina Miseq sequencer. Richness, evenness, and diversity were used to evaluate general differences of microbial composition in different groups. B. Principal coordinate analysis of control and hypertension groups. Weighted uniFrac analyses were performed to calculate the distances between fecal samples from control and hypertension patients. Each axis percentage describes how much variation that one dimension accounts for. By comparing the samples in a 3 dimensional PCoA figure, two separate clusters were formed. Results were compared by student’s t-test; * p<0.05, *** p<0.001. Control=10, Hypertension=7.
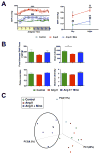
Figure 5. Minocycline attenuates Ang II infusion hypertension and causes a shift in the gut microbiota composition
A. Mean arterial pressure at four weeks of Ang II infusion and oral minocycline (Mino) treatment presented as 3-hour moving averages over 24 hours and the lowest and highest point during day and night recording. B. Fecal samples were collected and bacterial 16S ribosomal DNA were amplified and sequenced to analyze the compositions of microbial communities. Fecal biomass, richness, evenness, and diversity were used to evaluate general differences of microbial composition in different groups. Ang II alone displayed a decrease in richness of gut microbiota when compared with control. C. Principal coordinate analysis of three groups. Weighted uniFrac analyses were used to calculate the distances among fecal samples from control, Ang II and Ang II + Mino. The fecal microbiota composition shifted upon minocycline treatment and differs from control and Ang II groups. Results were compared by one-way ANOVA and Newman-Keuls post-hoc test; *p<0.05, ***p<0.001 vs control; ##p<0.01, ###p<0.001 vs Ang II; p<0.01 vs Ang II day; &&p<0.01 vs Ang II + Mino day. Control n=6, Ang II n=6, Ang II+Mino n=7.
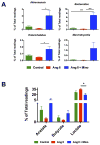
Figure 6. Comparison of microbiota composition in Ang II infusion model and minocycline treatment
A. The Firmicutes to Bacteroidetes ratio (F/B ratio) was calculated as a biomarker of gut dysbiosis. B. Description of mean proportional values of indicated phyla by pie chart. Gut microbiota was altered by chronic induction of hypertension (Ang II) towards dysbiosis, but Ang II + Mino administration reshaped microbiota composition towards diversity. Results were compared by one-way ANOVA and Newman-Keuls post-hoc test; *p<0.05, **p<0.01. Control n=6, Ang II n=6, Ang II+Mino n=7.
Figure 7. Bloom of acetate and butyrate producing bacteria upon treatment of minocycline
A. Expansion of several genera observed in the fecal samples from rats administrated by minocycline and angiotensin II. Miseq reads of bacterial 16S ribosomal DNA were analyzed and assigned to specific genera based on the sequence similarities to Silva non-redundant 16S reference database. The most accumulated genera of bacteria were identified by LEfSe as Akkermansia, Bacteroides, Enterorhabdus and Marvinbryantia. B. The relative proportions of acetate, butyrate and lactate producing bacteria in the gut microbiota in the rats either untreated or treated with Angiotensin II or Angiotensin II plus minocycline. Sequence reads were classified according to the primary end product of the assigned bacterial genera. Results were compared by one-way ANOVA and Newman-Keuls post-hoc test; *p<0.05, **p<0.01. Control n=6, Ang II n=6, Ang II+Mino n=7.
Similar articles
- Alterations in the gut microbiota can elicit hypertension in rats.
Adnan S, Nelson JW, Ajami NJ, Venna VR, Petrosino JF, Bryan RM Jr, Durgan DJ. Adnan S, et al. Physiol Genomics. 2017 Feb 1;49(2):96-104. doi: 10.1152/physiolgenomics.00081.2016. Epub 2016 Dec 23. Physiol Genomics. 2017. PMID: 28011881 Free PMC article. - Mycophenolate mediated remodeling of gut microbiota and improvement of gut-brain axis in spontaneously hypertensive rats.
Robles-Vera I, de la Visitación N, Toral M, Sánchez M, Gómez-Guzmán M, Jiménez R, Romero M, Duarte J. Robles-Vera I, et al. Biomed Pharmacother. 2021 Mar;135:111189. doi: 10.1016/j.biopha.2020.111189. Epub 2020 Dec 31. Biomed Pharmacother. 2021. PMID: 33388596 - High-Fiber Diet and Acetate Supplementation Change the Gut Microbiota and Prevent the Development of Hypertension and Heart Failure in Hypertensive Mice.
Marques FZ, Nelson E, Chu PY, Horlock D, Fiedler A, Ziemann M, Tan JK, Kuruppu S, Rajapakse NW, El-Osta A, Mackay CR, Kaye DM. Marques FZ, et al. Circulation. 2017 Mar 7;135(10):964-977. doi: 10.1161/CIRCULATIONAHA.116.024545. Epub 2016 Dec 7. Circulation. 2017. PMID: 27927713 - The human gastrointestinal tract and oral microbiota in inflammatory bowel disease: a state of the science review.
Lucas López R, Grande Burgos MJ, Gálvez A, Pérez Pulido R. Lucas López R, et al. APMIS. 2017 Jan;125(1):3-10. doi: 10.1111/apm.12609. Epub 2016 Oct 5. APMIS. 2017. PMID: 27704622 Review. - The gut microbiota and blood pressure in experimental models.
Jama HA, Kaye DM, Marques FZ. Jama HA, et al. Curr Opin Nephrol Hypertens. 2019 Mar;28(2):97-104. doi: 10.1097/MNH.0000000000000476. Curr Opin Nephrol Hypertens. 2019. PMID: 30531472 Review.
Cited by
- The Microbial Perspective: A Systematic Literature Review on Hypertension and Gut Microbiota.
Tsiavos A, Antza C, Trakatelli C, Kotsis V. Tsiavos A, et al. Nutrients. 2024 Oct 30;16(21):3698. doi: 10.3390/nu16213698. Nutrients. 2024. PMID: 39519531 Free PMC article. Review. - Bacterial live therapeutics for human diseases.
Frutos-Grilo E, Ana Y, Gonzalez-de Miguel J, Cardona-I-Collado M, Rodriguez-Arce I, Serrano L. Frutos-Grilo E, et al. Mol Syst Biol. 2024 Oct 23. doi: 10.1038/s44320-024-00067-0. Online ahead of print. Mol Syst Biol. 2024. PMID: 39443745 Review. - Arterial Hypertension: Novel Pharmacological Targets and Future Perspectives.
Popa IP, Clim A, Pînzariu AC, Lazăr CI, Popa Ș, Tudorancea IM, Moscalu M, Șerban DN, Șerban IL, Costache-Enache II, Tudorancea I. Popa IP, et al. J Clin Med. 2024 Oct 4;13(19):5927. doi: 10.3390/jcm13195927. J Clin Med. 2024. PMID: 39407987 Free PMC article. Review. - Changes in gut microbiota and metabolites of mice with intravenous graphene oxide-induced embryo toxicity.
Liu X, Wang Z, Teng C, Wang Z. Liu X, et al. Toxicol Res. 2024 Jun 11;40(4):571-584. doi: 10.1007/s43188-024-00242-3. eCollection 2024 Oct. Toxicol Res. 2024. PMID: 39345742 - Dietary fiber intake impacts gut bacterial and viral populations in a hypertensive mouse model.
Avellaneda-Franco L, Xie L, Nakai M, Barr JJ, Marques FZ. Avellaneda-Franco L, et al. Gut Microbes. 2024 Jan-Dec;16(1):2407047. doi: 10.1080/19490976.2024.2407047. Epub 2024 Sep 28. Gut Microbes. 2024. PMID: 39340212 Free PMC article.
References
- Anderson EA, Sinkey CA, Lawton WJ, Mark AL. Elevated sympathetic nerve activity in borderline hypertensive humans. Evidence from direct intraneural recordings. Hypertension. 1989;14:177–183. - PubMed
- Schlaich MP, Lambert E, Kaye DM, Krozowski Z, Campbell DJ, Lambert G, Hastings J, Aggarwal A, Esler MD. Sympathetic augmentation in hypertension: Role of nerve firing, norepinephrine reuptake, and angiotensin neuromodulation. Hypertension. 2004;43:169–175. - PubMed
Publication types
MeSH terms
Substances
Grants and funding
- UL1 TR000064/TR/NCATS NIH HHS/United States
- HL33610/HL/NHLBI NIH HHS/United States
- AI093370/AI/NIAID NIH HHS/United States
- UL1 TR001427/TR/NCATS NIH HHS/United States
- R01 HL033610/HL/NHLBI NIH HHS/United States
- UM1 HL087366/HL/NHLBI NIH HHS/United States
- R01 AI093370/AI/NIAID NIH HHS/United States
- R37 HL033610/HL/NHLBI NIH HHS/United States
LinkOut - more resources
Full Text Sources
Other Literature Sources
Medical
