Correlative stochastic optical reconstruction microscopy and electron microscopy - PubMed (original) (raw)
Correlative stochastic optical reconstruction microscopy and electron microscopy
Doory Kim et al. PLoS One. 2015.
Abstract
Correlative fluorescence light microscopy and electron microscopy allows the imaging of spatial distributions of specific biomolecules in the context of cellular ultrastructure. Recent development of super-resolution fluorescence microscopy allows the location of molecules to be determined with nanometer-scale spatial resolution. However, correlative super-resolution fluorescence microscopy and electron microscopy (EM) still remains challenging because the optimal specimen preparation and imaging conditions for super-resolution fluorescence microscopy and EM are often not compatible. Here, we have developed several experiment protocols for correlative stochastic optical reconstruction microscopy (STORM) and EM methods, both for un-embedded samples by applying EM-specific sample preparations after STORM imaging and for embedded and sectioned samples by optimizing the fluorescence under EM fixation, staining and embedding conditions. We demonstrated these methods using a variety of cellular targets.
Conflict of interest statement
Competing Interests: The authors have declared that no competing interests exist.
Figures
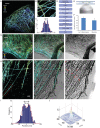
Fig 1. Correlative 3D STORM and TEM images of immunolabeled microtubules in a BS-C-1 cell.
(A) 3D STORM image of microtubules in a BS-C-1 cell on a No. 1.5 glass coverslip. (B) Magnified views of the boxed regions in (A). (C) Transverse profiles of localizations corresponding to regions boxed in white in b. Blue bars: localization frequency measured from the STORM image. Red line: Gaussian fit of the blue bars. (D) Flowchart of the major steps in correlative 3D STORM and TEM imaging of unembedded samples. (E) Scheme of the SiN window and the sample mounting geometry. (F) Normalized number of photons detected on the samples mounted on the normal No. 1.5 coverslip and the SiN window. The results are normalized to the average photon number obtained from samples on the No. 1.5 glass coverslip (photon number = 5233). (G) Correlative 3D STORM and TEM images of microtubules in a BS-C-1 cell. Left: STORM image. Right: TEM image. Middle: Overlaid image. (H) Magnified views of the boxed regions in (G). Red arrows in TEM image: thick filaments corresponding to microtubules. (I) Transverse profiles of localizations corresponding to regions boxed in white in (G). Blue bars: localization frequency measured from the STORM image. Red line: Gaussian fit of the blue bars. (J) Cross-correlation between STORM and TEM images. Scale bars, 5 μm in (A,G) and 500 nm in (B,H).
Fig 2. Correlative 3D STORM and TEM images of immunolabeled mitochondria in a BS-C-1 cell.
(A) Correlative 3D STORM and EM images of mitochondria in a BS-C-1 cell innumo-stained for TOM20. Left: STORM image. Right: SEM image. Middle: Overlaid image. Part of SiN mesh is visible on the upper left corner of the image. (B) Magnified views of the boxed regions in A. (C) xy cross-section of the 3D STORM image of mitochondria in the same region. Scale bars, 5 μm in (A) and 500 nm in (B, C).
Fig 3. Correlative 3D STORM and SEM imaging of individual filamentous influenza viruses.
(A) Flowchart of the major steps in the correlative 3D STORM and SEM imaging of unembedded samples. (B) Correlative 3D STORM and SEM images of Udorn virus immuno-labeled for HA. Left: STORM image. Right: SEM image. Middle: Overlaid image. (C) Magnified views of the boxed regions in (B). (D) Transverse profiles of localizations corresponding to regions boxed in red in (B). Blue bars: localization frequency measured from the STORM image. Red line: Gaussian fit of the blue bars. (E) Normalized photon numbers per switching event. The results are normalized to the average photon number obtained from samples on the No. 1.5 glass coverslip (photon number = 5233). (F) Cross-correlation between STORM and SEM images. (G) Correlative two-color STORM and SEM images of budding Udorn virus filaments immuno-labeled for M1 (red) and vRNP (green). Left: STORM image. Right: SEM image. Middle: Overlaid image. Scale bars, 500 nm in (B,C and G).
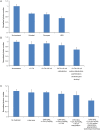
Fig 4. The average photon numbers per switching event of dye molecules under various conditions used in the correlative STORM and EM imaging.
(A) Normalized photon numbers in different resins. (B) Normalized photon numbers detected after various steps of sample treatment in the case of tannic acid—uranyl acetate fixed, Ultrabed-embedded samples. (C) Normalized photon numbers detected after various steps of sample treatment in the case of the osmium—potassium ferricyanide—uranyl acetate fixed, Ultrabed-embedded samples. The photon numbers in all cases are normalized to the control sample (photon number = 5233), which was post-fixed only with 4% PFA and 0.1% GA after immunolabeling without any additional membrane fixation (by osmium, tannic acid or uranyl acetate), dehydration, polymerization, sectioning or etching.
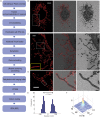
Fig 5. Correlative STORM and SEM-BSE images of resin-embeded sections containing filamentous influenza viruses budding from infected cells.
(A) Flowchart of the major steps in correlative 3D STORM and BSE-SEM imaging of embedded samples. (B) Correlative STORM and EM images of influenza infected A549 cells immuno-stained for HA. Left: STORM image. Right: SEM image. Middle: Overlaid image. (C) Magnified views of the boxed regions in a (B). Inset in yellow box: STORM image of an influenza virus filament, immuno-stained for HA, embedded in Ultrabed section without etching. (D) Magnified views of the boxed regions in (D). (E) Transverse profiles of localizations corresponding to regions in the white box in (D). Blue bars: localization frequency measured from the STORM image. Red line: Gaussian fit of the blue bars. (F) Cross-correlation between STORM and BSE-SEM images. Scale bars, 5 μm in (B) and 500 nm in (C, D).
Fig 6. Correlative STORM and BSE-SEM images of immunolabeled mitochondria in a resin-embeded sections of a BS-C-1 cell.
(A) Flowchart of the major steps in correlative 3D STORM and BSE-SEM imaging of embedded samples. (B) Correlative 3D STORM and EM images of cells immuno-stained for TOM20. Left: STORM image. Right: SEM image. Middle: Overlaid image. Scale bars, 500 nm.
Similar articles
- Recent Developments in Correlative Super-Resolution Fluorescence Microscopy and Electron Microscopy.
Jeong D, Kim D. Jeong D, et al. Mol Cells. 2022 Jan 31;45(1):41-50. doi: 10.14348/molcells.2021.5011. Mol Cells. 2022. PMID: 35114646 Free PMC article. Review. - Super-resolution correlative light-electron microscopy using a click-chemistry approach for studying intracellular trafficking.
Andrian T, Bakkum T, van Elsland DM, Bos E, Koster AJ, Albertazzi L, van Kasteren SI, Pujals S. Andrian T, et al. Methods Cell Biol. 2021;162:303-331. doi: 10.1016/bs.mcb.2020.09.001. Epub 2020 Oct 16. Methods Cell Biol. 2021. PMID: 33707017 - Correlative light- and electron microscopy with chemical tags.
Perkovic M, Kunz M, Endesfelder U, Bunse S, Wigge C, Yu Z, Hodirnau VV, Scheffer MP, Seybert A, Malkusch S, Schuman EM, Heilemann M, Frangakis AS. Perkovic M, et al. J Struct Biol. 2014 May;186(2):205-13. doi: 10.1016/j.jsb.2014.03.018. Epub 2014 Mar 31. J Struct Biol. 2014. PMID: 24698954 Free PMC article. - Three-dimensional super-resolution imaging by stochastic optical reconstruction microscopy.
Huang B, Wang W, Bates M, Zhuang X. Huang B, et al. Science. 2008 Feb 8;319(5864):810-3. doi: 10.1126/science.1153529. Epub 2008 Jan 3. Science. 2008. PMID: 18174397 Free PMC article. - Cryogenic Super-Resolution Fluorescence and Electron Microscopy Correlated at the Nanoscale.
Dahlberg PD, Moerner WE. Dahlberg PD, et al. Annu Rev Phys Chem. 2021 Apr 20;72:253-278. doi: 10.1146/annurev-physchem-090319-051546. Epub 2021 Jan 13. Annu Rev Phys Chem. 2021. PMID: 33441030 Free PMC article. Review.
Cited by
- A nanoscale visual exploration of the pathogenic effects of bacterial extracellular vesicles on host cells.
Kang M, Kim MJ, Jeong D, Lim HJ, Go GE, Jeong U, Moon E, Kweon HS, Kang NG, Hwang SJ, Youn SH, Hwang BK, Kim D. Kang M, et al. J Nanobiotechnology. 2024 Sep 6;22(1):548. doi: 10.1186/s12951-024-02817-6. J Nanobiotechnology. 2024. PMID: 39238028 Free PMC article. - In-section Click-iT detection and super-resolution CLEM analysis of nucleolar ultrastructure and replication in plants.
Franek M, Koptašíková L, Mikšátko J, Liebl D, Macíčková E, Pospíšil J, Esner M, Dvořáčková M, Fajkus J. Franek M, et al. Nat Commun. 2024 Mar 19;15(1):2445. doi: 10.1038/s41467-024-46324-6. Nat Commun. 2024. PMID: 38503728 Free PMC article. - Imaging of Isolated Exosomes by Correlative Microscopy.
Demir Ş, Erdal E, Bagriyanik HA. Demir Ş, et al. J Histochem Cytochem. 2024 Mar;72(3):149-156. doi: 10.1369/00221554241233346. Epub 2024 Feb 24. J Histochem Cytochem. 2024. PMID: 38400717 - Application of immuno- and affinity labeling with fluorescent dyes to in-resin CLEM of Epon-embedded cells.
Tanida I, Yamaguchi J, Suzuki C, Kakuta S, Uchiyama Y. Tanida I, et al. Heliyon. 2023 Jun 17;9(6):e17394. doi: 10.1016/j.heliyon.2023.e17394. eCollection 2023 Jun. Heliyon. 2023. PMID: 37389060 Free PMC article. - Recent development of computational cluster analysis methods for single-molecule localization microscopy images.
Hyun Y, Kim D. Hyun Y, et al. Comput Struct Biotechnol J. 2023 Jan 9;21:879-888. doi: 10.1016/j.csbj.2023.01.006. eCollection 2023. Comput Struct Biotechnol J. 2023. PMID: 36698968 Free PMC article. Review.
References
- Hell SW. Far-field optical nanoscopy. Science. 2007;316: 1153–1158. - PubMed
- Griffiths G, Hoppeler H. Quantitation in immunocytochemistry: correlation of immunogold labeling to absolute number of membrane antigens. J Histochem Cytochem. 1986;34: 1389–1398. - PubMed
- Robinson JM, Takizawa T, Vandre DD. Applications of gold cluster compounds in immunocytochemistry and correlative microscopy: comparison with colloidal gold. J Microsc. 2000;199: 163–179. - PubMed
Publication types
MeSH terms
Grants and funding
- P41 GM103412/GM/NIGMS NIH HHS/United States
- P41GM103412/GM/NIGMS NIH HHS/United States
- R01 GM068518/GM/NIGMS NIH HHS/United States
- HHMI/Howard Hughes Medical Institute/United States
- GM068518/GM/NIGMS NIH HHS/United States
LinkOut - more resources
Full Text Sources
Other Literature Sources


