Determining the role of IL-4 induced neuroinflammation in microglial activity and amyloid-β using BV2 microglial cells and APP/PS1 transgenic mice - PubMed (original) (raw)
Determining the role of IL-4 induced neuroinflammation in microglial activity and amyloid-β using BV2 microglial cells and APP/PS1 transgenic mice
Clare H Latta et al. J Neuroinflammation. 2015.
Abstract
Background: Microglia are considered the resident immune cells of the central nervous system (CNS). In response to harmful stimuli, an inflammatory reaction ensues in which microglia are activated in a sequenced spectrum of pro- and antiinflammatory phenotypes that are akin to the well-characterized polarization states of peripheral macrophages. A "classically" activated M1 phenotype is known to eradicate toxicity. The transition to an "alternatively" activated M2 phenotype encompasses neuroprotection and repair. In recent years, inflammation has been considered an accompanying pathology in response to the accumulation of extracellular amyloid-β (Aβ) in Alzheimer's disease (AD). This study aimed to drive an M2a-biased immune phenotype with IL-4 in vitro and in vivo and to determine the subsequent effects on microglial activation and Aβ pathology.
Methods: In vitro, exogenous IL-4 was applied to BV2 microglial cell cultures to evaluate the temporal progression of microglial responses. In vivo, intracranial injections of an adeno-associate-virus (AAV) viral vector were performed to assess long-term expression of IL-4 in the frontal cortex and hippocampus of Aβ-depositing, APP/PS1 transgenic mice. Quantitative real-time PCR was used to assess the fold change in expression of biomarkers representing each of the microglial phenotypes in both the animal tissue and the BV2 cells. ELISAs quantified IL-4 expression and Aβ levels. Histological staining permitted quantification of microglial and astrocytic activity.
Results: Both in vitro and in vivo models showed an enhanced M2a phenotype, and the in vivo model revealed a trend toward a decreased trend in Aβ deposition.
Conclusions: In summary, this study offers insight into the therapeutic potential of microglial immune response in AD.
Figures
Figure 1
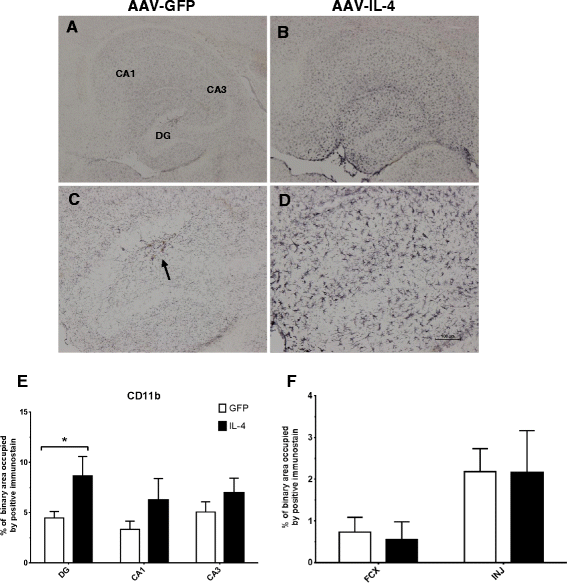
IL-4 shows increased CD11b immunostaining. A and B CD11b staining of hippocampal sections of the AAV-GFP- and the AAV-IL-4-injected mice, respectively. C and D Staining in the dentate gyrus (DG); an arrow shows the site of the hippocampal injection. E The percentage of binary area occupied by the positive immunostain in the hippocampus across all samples; F uses (N = 4) for AAV-IL4 samples because of damage in the frontal cortex of two AAV-IL-4 mice. *P < 0.05 between the AAV-GFP control (N = 8) and AAV-IL-4 (N = 6).
Figure 2
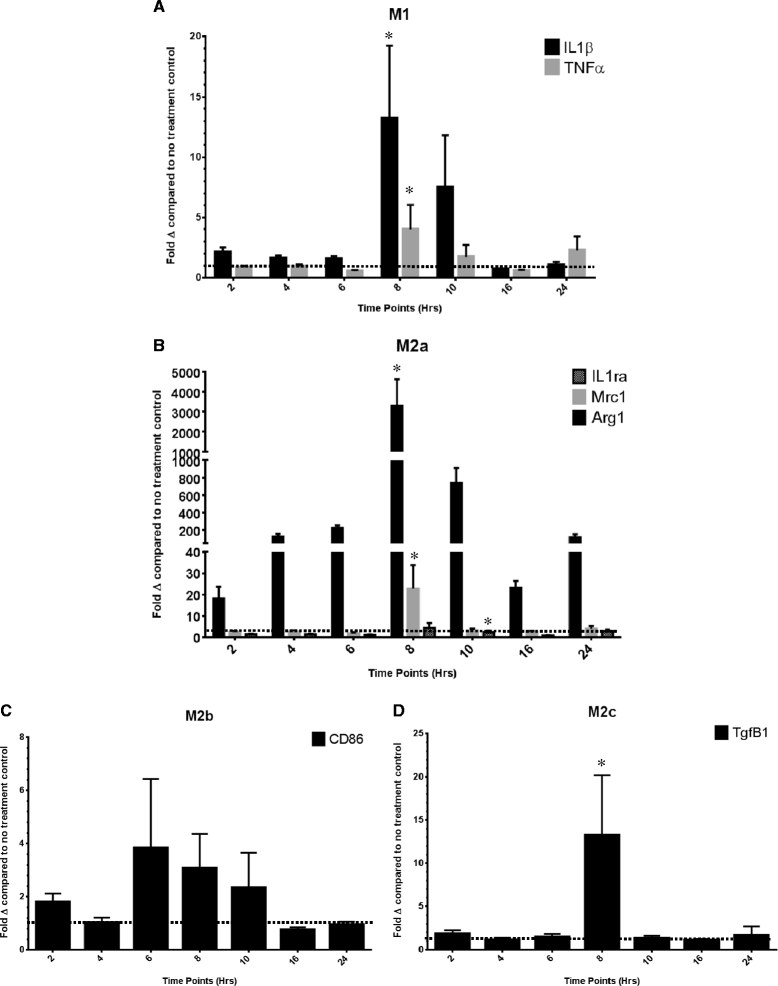
The relative gene expression for genes representative of the (A) M1, (B) M2a, (C) M2b and (D) M2c phenotypes of the IL-4-treated cell culture. Data are shown as the average fold change (± SEM) relative to the no treatment control at the 2-, 4-, 6-, 8-, 10-, 16- and 24-h time points. *The peak time point of gene expression determined by a repeated measures ANOVA of the fold changes in logarithmic form.
Figure 3
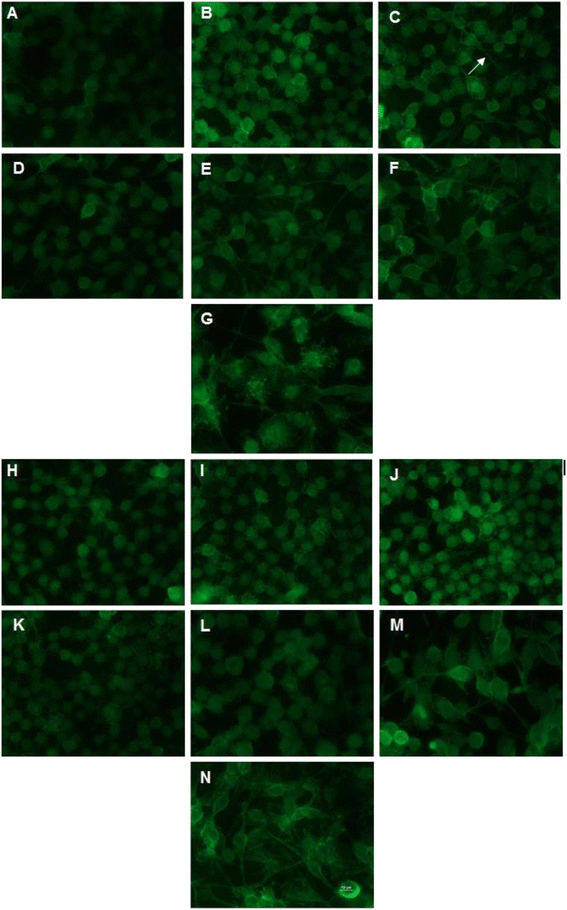
BV2 cell culture exposed to CD11b immunofluorescent staining over time. A-G Immunofluorescent staining of no-treatment control cells at 2, 4, 6 8, 10, 16 and 24 h, respectively. H-N Staining of cells exposed to the IL-4 treatment at 2, 4, 6, 8 10, 16 and 24 h, respectively. Images were taken with approximately the same cell confluency at a magnification of 60× and show a higher density of processes in the no treatment control compared to the IL-4-treated cells until 16 h. Arrow indicates extended processes seen on the untreated BV2 cells at 6 h.
Figure 4
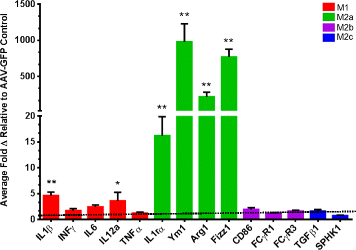
IL-4 induces an M2a neuroinflammatory phenotype in APP/PS1 transgenic mice. The figure shows the relative gene expression for genes representative of the M1, M2a, M2b and M2c phenotypes relative to the 18-s endogenous control. Data are shown as the average fold change (± SEM) normalized to the AAV-GFP control. *P < 0.05 between the AAV-GFP control (N = 8) and AAV-IL-4 mice (N = 6). **P < 0.01 between the AAV-GFP control and AAV-IL-4 mice.
Figure 5
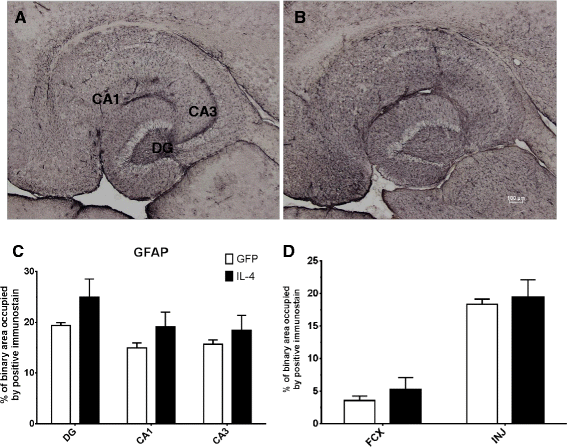
IL-4 shows increased GFAP immunostaining. A and B GFAP staining of hippocampal sections of the AAV-GFP- and the AAV-IL-4-injected mice, respectively. C The percentage of binary area occupied by the positive immunostain in the hippocampus across all samples; D uses (N = 4) for AAV-IL4 samples because of damage in the frontal cortex of two AAV-IL-4 mice. *P < 0.05 between the AAV-GFP control (N = 8) and AAV-IL-4 (N = 6).
Figure 6
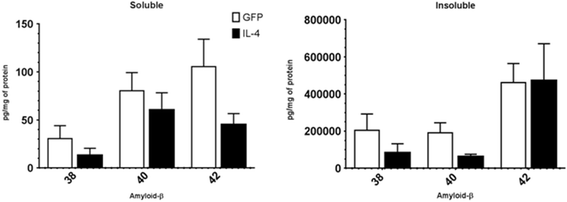
IL-4 causes a small decrease in Aβ deposition. This figure shows the relative amyloid-β expression (1–38,1-40,1-42) detected using a Meso Scale Discovery assay (MSD) for the AAV-GFP control and the AAV-IL-4-treated APP/PS1 transgenic mice. No statistically significant difference was seen between the AAV-GFP control and AAV-IL-4 groups, but the results show a decreasing trend (N = 8 AAV-GFP and N = 6 for AAV-IL-4). Immunostained Aβ plaques with Congo red could not be detected because the mice were only 3 months old. Compact plaques can be seen at 6 months of age.
Similar articles
- Dihydromyricetin inhibits microglial activation and neuroinflammation by suppressing NLRP3 inflammasome activation in APP/PS1 transgenic mice.
Feng J, Wang JX, Du YH, Liu Y, Zhang W, Chen JF, Liu YJ, Zheng M, Wang KJ, He GQ. Feng J, et al. CNS Neurosci Ther. 2018 Dec;24(12):1207-1218. doi: 10.1111/cns.12983. Epub 2018 Jun 4. CNS Neurosci Ther. 2018. PMID: 29869390 Free PMC article. - The effect of focal brain injury on beta-amyloid plaque deposition, inflammation and synapses in the APP/PS1 mouse model of Alzheimer's disease.
Collins JM, King AE, Woodhouse A, Kirkcaldie MT, Vickers JC. Collins JM, et al. Exp Neurol. 2015 May;267:219-29. doi: 10.1016/j.expneurol.2015.02.034. Epub 2015 Mar 4. Exp Neurol. 2015. PMID: 25747037 - Transition from an M1 to a mixed neuroinflammatory phenotype increases amyloid deposition in APP/PS1 transgenic mice.
Weekman EM, Sudduth TL, Abner EL, Popa GJ, Mendenhall MD, Brothers HM, Braun K, Greenstein A, Wilcock DM. Weekman EM, et al. J Neuroinflammation. 2014 Jul 25;11:127. doi: 10.1186/1742-2094-11-127. J Neuroinflammation. 2014. PMID: 25062954 Free PMC article. - Dynamic complexity of the microglial activation response in transgenic models of amyloid deposition: implications for Alzheimer therapeutics.
Morgan D, Gordon MN, Tan J, Wilcock D, Rojiani AM. Morgan D, et al. J Neuropathol Exp Neurol. 2005 Sep;64(9):743-53. doi: 10.1097/01.jnen.0000178444.33972.e0. J Neuropathol Exp Neurol. 2005. PMID: 16141783 Review. - Microglial toll-like receptors and Alzheimer's disease.
Su F, Bai F, Zhou H, Zhang Z. Su F, et al. Brain Behav Immun. 2016 Feb;52:187-198. doi: 10.1016/j.bbi.2015.10.010. Epub 2015 Oct 23. Brain Behav Immun. 2016. PMID: 26526648 Review.
Cited by
- The dual roles of cytokines in Alzheimer's disease: update on interleukins, TNF-α, TGF-β and IFN-γ.
Zheng C, Zhou XW, Wang JZ. Zheng C, et al. Transl Neurodegener. 2016 Apr 5;5:7. doi: 10.1186/s40035-016-0054-4. eCollection 2016. Transl Neurodegener. 2016. PMID: 27054030 Free PMC article. Review. - Microglia-mediated neuroinflammation and neuroplasticity after stroke.
Wang Y, Leak RK, Cao G. Wang Y, et al. Front Cell Neurosci. 2022 Aug 16;16:980722. doi: 10.3389/fncel.2022.980722. eCollection 2022. Front Cell Neurosci. 2022. PMID: 36052339 Free PMC article. Review. - Microglia-associated neuroinflammation is a potential therapeutic target for ischemic stroke.
Zhang W, Tian T, Gong SX, Huang WQ, Zhou QY, Wang AP, Tian Y. Zhang W, et al. Neural Regen Res. 2021 Jan;16(1):6-11. doi: 10.4103/1673-5374.286954. Neural Regen Res. 2021. PMID: 32788440 Free PMC article. - Non-Pharmacological Therapeutic Options for the Treatment of Alzheimer's Disease.
Huynh QS, Elangovan S, Holsinger RMD. Huynh QS, et al. Int J Mol Sci. 2022 Sep 20;23(19):11037. doi: 10.3390/ijms231911037. Int J Mol Sci. 2022. PMID: 36232336 Free PMC article. Review. - Efficacy and Safety of the Immunization with DNA for Alzheimer's Disease in Animal Models: A Systematic Review from Literature.
Martins YA, Tsuchida CJ, Antoniassi P, Demarchi IG. Martins YA, et al. J Alzheimers Dis Rep. 2017 Dec 2;1(1):195-217. doi: 10.3233/ADR-170025. J Alzheimers Dis Rep. 2017. PMID: 30480238 Free PMC article.
References
Publication types
MeSH terms
Substances
Grants and funding
- P30AG028383/AG/NIA NIH HHS/United States
- P20 GM103486/GM/NIGMS NIH HHS/United States
- P20 RR020171/RR/NCRR NIH HHS/United States
- P20GM103486/GM/NIGMS NIH HHS/United States
- R01 NS079637/NS/NINDS NIH HHS/United States
- 5P20RR020171/RR/NCRR NIH HHS/United States
- P30 AG028383/AG/NIA NIH HHS/United States
- NS079637/NS/NINDS NIH HHS/United States
LinkOut - more resources
Full Text Sources
Other Literature Sources
Medical
