Alternative 3' UTRs act as scaffolds to regulate membrane protein localization - PubMed (original) (raw)
. 2015 Jun 18;522(7556):363-7.
doi: 10.1038/nature14321. Epub 2015 Apr 20.
Affiliations
- PMID: 25896326
- PMCID: PMC4697748
- DOI: 10.1038/nature14321
Alternative 3' UTRs act as scaffolds to regulate membrane protein localization
Binyamin D Berkovits et al. Nature. 2015.
Abstract
About half of human genes use alternative cleavage and polyadenylation (ApA) to generate messenger RNA transcripts that differ in the length of their 3' untranslated regions (3' UTRs) while producing the same protein. Here we show in human cell lines that alternative 3' UTRs differentially regulate the localization of membrane proteins. The long 3' UTR of CD47 enables efficient cell surface expression of CD47 protein, whereas the short 3' UTR primarily localizes CD47 protein to the endoplasmic reticulum. CD47 protein localization occurs post-translationally and independently of RNA localization. In our model of 3' UTR-dependent protein localization, the long 3' UTR of CD47 acts as a scaffold to recruit a protein complex containing the RNA-binding protein HuR (also known as ELAVL1) and SET to the site of translation. This facilitates interaction of SET with the newly translated cytoplasmic domains of CD47 and results in subsequent translocation of CD47 to the plasma membrane via activated RAC1 (ref. 5). We also show that CD47 protein has different functions depending on whether it was generated by the short or long 3' UTR isoforms. Thus, ApA contributes to the functional diversity of the proteome without changing the amino acid sequence. 3' UTR-dependent protein localization has the potential to be a widespread trafficking mechanism for membrane proteins because HuR binds to thousands of mRNAs, and we show that the long 3' UTRs of CD44, ITGA1 and TNFRSF13C, which are bound by HuR, increase surface protein expression compared to their corresponding short 3' UTRs. We propose that during translation the scaffold function of 3' UTRs facilitates binding of proteins to nascent proteins to direct their transport or function--and this role of 3' UTRs can be regulated by ApA.
Conflict of interest statement
The authors declare no conflict of interests.
Figures
Extended Data Figure 1. Expression of the long CD47 3'UTR isoform correlates with cell surface expression of CD47 protein
(A) Fluorescence confocal microscopy of cells shown as in Fig. 1a. Representative images out of hundreds of cells are shown. Scale bars, 10 µm. (B) FACS analysis of endogenous CD47 expression in cells shown in Fig. 1a and (a). Permeabilized cells show total CD47 expression (purple) and non-permeabilized cells show surface CD47 expression (blue). Representative histograms are shown (HEK293 cells, n = 10, U2OS, Jurkat cells, n=5, Caov-3, n=3). Unstained cells are shown in grey. (C) Left, quantification of mean fluorescence intensity (MFI) values from (b). Right, fraction of surface and intracellular CD47 levels in cells lines from (b). Intracellular CD47 was calculated by subtracting CD47 surface values from total CD47 values. (D) Northern blot of HEK293 cells stably expressing the indicated shRNAs and hybridized for CD47. The shRNAs against CD47-LU target only the long 3'UTR isoforms of CD47. The blot and corresponding RNA gel are shown as in Fig. 1c. (E) Quantification of CD47 total mRNA and 3'UTR isoform levels in U2OS cells by qRT-PCR. _GAPDH_-normalized values after transfection of sh2 CD47-LU or sh Co are shown as the mean ± s.d., n = 3 biological replicates. The total amount of CD47 mRNA after transfection of sh Co was set to 1. (F) FACS analysis of endogenous CD47 protein expression after stable expression of shRNAs against CD47-LU in HEK293 cells. Surface (top) and total (bottom) CD47 expression is shown. Representative histograms out of n = 3 experiments are shown. Unstained cells are shown in grey. (G) Quantification of MFI values from (f) is displayed. Intracellular CD47 was calculated as in (b). (H) Northern blot of HEK293 cells after transfection of indicated constructs and hybridized against CD47. Mutation of the proximal polyadenylation signal in CD47-LU abrogates production of short 3'UTR isoforms. Asterisk indicates cross-hybridization to ribosomal RNAs. (I) Fluorescence confocal microscopy of endogenous CD47 and Calnexin protein in permeabilized U2OS cells. Calnexin partially co-localizes with CD47. A representative image out of hundreds of cells is shown. Scale bars, 10 µm.
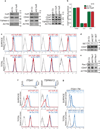
Extended Data Figure 2. UDPL depends on HuR, SET and Rac1 and mediates surface localization of membrane proteins
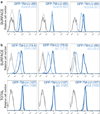
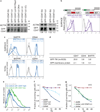
(A) Western blot of HEK293 cells transiently transfected (left, middle) or stably expressing (right) sh Co or shRNAs against HuR. The blot shows reduced HuR protein expression after HuR KD, but no change in protein expression of CD47, TSPAN13, CD44 or SET. ACTIN was used as loading control. (B) Quantification of CD47 total mRNA and 3'UTR isoform levels in HEK293 cells by qRT-PCR. _GAPDH_-normalized values after transfection of sh2 HuR or sh Co are shown. Shown is the mean ± s.d., n = 3 biological replicates. The total amount of CD47 mRNA after transfection of sh Co was set to 1. (C) FACS analysis of HEK293 cells stably expressing the indicated shRNAs. Histograms are shown as in Fig. 2b. Representative histograms from n = 3 experiments are shown. (D) Western blot of HEK293 cells stably expressing shRNAs against SET. Actin was used as loading control. The marker is shown in kD. (E) As in (D), but HEK293 cells stably expressing shRNAs against RAC1 are shown. (F) 3'-seq analysis shows 3'UTR isoform expression of ITGA1 in B-LCL and TSPAN13 in HEK293 cells shown as in Fig. 1b. FACS analysis of endogenous protein levels is shown as in Fig. 2c. Left panel shows ITGA1 expression in HeLa cells and right panel shows TSPAN13 expression in HEK293 cells. Representative histograms from n = 2 experiments are shown. (G) FACS analysis of GFP after transfection of constructs containing a signal peptide and GFP fused to the TMD, C-terminus and either the long 3'UTR (dark blue line) or the short 3'UTR (light blue line) of ITGA1 in HEK293 cells. Representative histograms from n = 3 experiments are shown as in Fig. 2d.
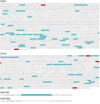
Extended Data Figure 3. 3'UTR isoforms that encode proteins using UDPL contain uridine-rich elements
Shown are the 3'UTR sequences of CD47, CD44, HuR-BS and HuR-BSΔ. Red, ApA signals. Blue, uridine-rich elements with the potential to be HuR-binding sites.
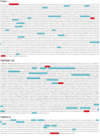
Extended Data Figure 4. 3'UTR isoforms that encode proteins using UDPL contain U-rich elements
Shown are the 3'UTR sequences of ITGA1, TNFRSF13C and TSPAN13. Red, ApA signals. Blue, U-rich elements with the potential to be HuR-binding sites.
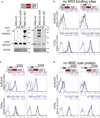
Extended Data Figure 5. Local recruitment of SET to the site of translation is required for UDPL
(A) Western blot of cells used in Fig. 3b shows the amount of overexpression achieved by transfection of MS2-mC-SET or MS2-mC-HuR [constructs, see (b)]. Left, anti-SET detects endogenous expression of SET as well as overexpressed SET. Right, anti-HuR detects endogenous HuR and overexpressed HuR. Actin was used as loading control. Anti-HuR and anti-SET were used on the same blot. Actin as loading control was performed once. The marker is shown in kD. Asterisk indicates unspecific band. mC, mCherry. (B) The top construct depicts GFP-TM-SU (Fig. 1e) and the bottom construct shows a fusion of MS2 coat protein (MS2), mC (red) and HuR or SET, respectively. Overexpression of HuR or SET compared with expression of MS2-mC alone does not change surface or total GFP expression, when co-transfected with GFP-TM-SU (without the addition of MS2-binding sites to the SU isoform) as shown by FACS analysis. Surface expression (top) and total expression (bottom) in HEK293 cells are shown. Values for MFI are shown in parentheses. Unstained cells are shown in grey. Representative histograms from n = 2 experiments are shown. (C) FACS analysis of cells used in Fig. 3b. MS2-binding sites (MS2-BS, RNA stem loops) were added to GFP-TM-SU (and the proximal polyadenylation signal was mutated) to obtain GFP-TM-SU-MS2-BS. Transfection of MS2-mC-HuR (left, dark purple line) or MS2-mC-SET (right, dark purple line) increases surface GFP expression compared with transfection of MS2-mC (light purple line), when GFP-TM-SU-MS2-BS is co-transfected. Thus, tethering of HuR or SET to the short 3'UTR of GFP-TM localizes GFP to the cell surface without changing total GFP expression. Histograms are shown as in (b). Representative histograms from n = 5 experiments are shown. (D) As in (c), but tethering was impaired by omission of the MS2 coat protein. Histograms are shown as in (b). Representative histograms from n = 2 experiments are shown. Summary of the tethering experiment: To tether SET or HuR to the 3'UTR (which brings it close to the site of translation through the scaffold function of the 3'UTR), we added MS2-binding sites (MS2-BS) to GFP-TM-SU (c). MS2-binding sites are derived from the bacteriophage MS2 and form RNA stem loops. The capsid protein of MS2 (here, called MS2) specifically recognizes these MS2 stem loops. Constructs were generated containing MS2 fused to mC and then either HuR, SET or with no further coding sequence (Fig. 3c). Co-expression of these constructs with the construct containing the short UTR and MS2-binding sites results in recruitment of SET or HuR to the short 3'UTR of GFP-TM. The cells that express MS2 fused to only mC localize GFP to the endoplasmic reticulum, but constructs containing MS2 fusions to HuR or SET localize GFP primarily to the cell surface (Fig. 3b and Extended Data Fig. 5c). Omitting either the MS2 or MS2-binding sites from the experiment abrogates surface localization (Extended Data Fig. 5b, d).
Extended Data Figure 6. CD47 contains at least two SET-binding sites in its cytoplasmic domains
(A) FACS analysis of surface GFP expression after transfection of GFP-TM-LU (dark blue line) and GFP-TM-LU constructs containing a single point mutation in the cytoplasmic C-terminus (light blue line), K290A (left), K297A (middle), K304A (right) in HEK293 cells. Partial destruction of a single SET-BS results in up to 37% reduction in GFP surface expression. Values for MFI are shown in parentheses. Unstained cells are shown in grey. Representative histograms from n = 5 experiments are shown. (B) FACS analysis of GFP expression after transfection of GFP-TM-LU (dark blue line), GFP-TM-LU containing a mutation of the SET-binding sites in the C-terminus (K290A, K304A; 2Km; light blue line; left), containing a deletion of the C-terminus (ΔC; light blue line; middle), or destruction of both SET-BS (ΔC combined with K163A, K166A, K175A; ΔCL; light blue line, right). Surface (top) and total (bottom) expression is shown in HEK293 cells. Values for MFI are shown in parentheses. Unstained cells are shown in grey. Representative histograms from several experiments are shown (2Km, n = 3; ΔC, n = 10; ΔCL, n = 4).
Extended Data Figure 7. CD47 protein has different functions dependent on whether it was generated by the SU or LU isoform
(A) Left, western blot of HEK293 cells after transfection of the indicated constructs shows GFP-CD47 expression using an anti-GFP antibody. Actin was used as loading control. Right, as in left panel after transfection of CD47-SU and CD47-LU into HEK293 (left) or JinB8 cells (right). GFP-CD47 expression was quantified after normalization with respect to Actin using Image J. Shown is the fold-change in GFP-CD47 expression of CD47-SU after setting CD47-LU to 1. (B) The experiment is similar to Fig. 3b and Extended Data Fig. 5c, but here the constructs containing the full open reading frame of CD47 were used. FACS analysis of GFP expression after transfection of CD47-SU-MS2-BS. Co-transfection of MS2-mC-HuR (left, dark purple line) or MS2-mC-SET (right, dark purple line) increases surface GFP expression compared to co-transfection of MS2-mC (light purple line). Surface expression is shown in non-permeabilized HEK293 cells. Values for MFI are shown in parentheses. Representative histograms from n = 3 experiments are shown. Unstained cells are shown in grey. (C) Left, FACS analysis of GFP after transfection of constructs containing a signal peptide and GFP fused to the open reading frame of BAFFR and either the long 3'UTR (BAFFR-LU, dark blue line) or the short 3'UTR (BAFFR-SU, light blue line) in HEK293 cells. Surface (top) and total (bottom) GFP expression is shown. Values for MFI are shown in parentheses. Representative histograms from n = 3 experiments are shown. Unstained cells are shown in grey. Right, as in left panel but for CD44. (D) Table showing the fold increase in surface GFP expression mediated by the LU isoform compared with the SU isoform. Top row shows values of constructs without the ECD and bottom row shows values of constructs containing the full coding regions of the indicated proteins. The fold increase in surface GFP expression was calculated from MFI (LU) / MFI (SU). The contribution of the ECD domain for surface expression of BAFFR is 1.2-fold (3.8 / 3.1). (E) FACS analysis of carboxyfluorescein succinimidyl ester (CFSE) uptake in macrophages. Macrophages were co-cultured without (grey) cells or with cells that were pre-treated with CFSE and expressed high or low amounts of surface CD47 (data not shown). The experiment shows that the macrophages phagocytose the cells depending on their CD47 surface expression levels. A representative histogram from n = 2 experiments is shown. (F) The fraction of surviving cells (TO-PRO3 negative) as measured by FACS analysis at day 3 (d3) after increasing doses of γ-irradiation is shown for Jurkat, JinB8 (CD47−/−) and the GFP+ fraction after nucleofection of JinB8 cells with either CD47-SU or CD47-LU. The values were obtained from the same experiment as shown in Fig. 4e, but here the values were calculated using all GFP positive cells. Shown are the values for mean ± s.d., n = 3 biological replicates. Gy, Gray. (G) The fraction of surviving cells (TO-PRO3 negative) as measured by FACS analysis at day 3 (d3) after increasing doses of γ-irradiation is shown for Jurkat, JinB8 (CD47−/−) and the GFP+ fraction after nucleofection of Jurkat cells with sh2 CD47-LU. Shown are the 20% of cells with the highest GFP expression (green). Shown are the values for mean ± s.d., n = 3 biological replicates. Gy, Gray.
Extended Data Figure 8. HuR, SET and RAC1 are widely and highly expressed
(A) The mRNAs of proteins necessary for UDPL are ubiquitously and highly expressed across cell lines (left) and tissues (right). Shown are values for transcripts per million (TPM). The median abundance levels of all expressed genes in the data sets are shown as dashed lines. ELAVL1 encodes HuR. The data set from ref. was analysed to obtain the TPM values. (B) Here, “HuR targets” consist of the union of HuR targets identified previously,. Membrane proteins consist of all the proteins that contain the tag “membrane” using gene ontology analysis. The fraction of membrane proteins found is consistent with the fraction of membrane proteins found in yeast . Fisher’s exact test shows no enrichment or depletion of membrane proteins among the HuR targets.
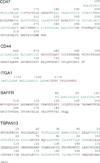
Extended Data Figure 9. All tested UDPL candidates have potential SET-binding sites in their cytoplasmic domains
Shown are the amino acid sequences of the TMDs and cytoplasmic domains of the membrane proteins studied. The TMDs are shown in green and the positively charged amino acids in the cytoplasmic domains, indicating potential SET-binding sites, are shown in red.
Figure 1. The long 3'UTR of CD47 localizes GFP-TM protein to the plasma membrane, whereas the short 3'UTR localizes it to the endoplasmic reticulum
(A) Fluorescence confocal microscopy of endogenous CD47 protein in non-permeabilized (top) and permeabilized (bottom) cells. IC, intracellular. (B) 3'-seq analysis of naïve B cells shows two 3'UTR isoforms of CD47 mRNA (short 3'UTR (SU) and long 3'UTR (LU)). Shown is the last exon of the gene model. Isoform abundance shown in transcripts per million (TPM). (C) Northern blot analysis of human cell lines confirming CD47 mRNA isoforms from (b). The corresponding ethidium-bromide-stained RNA gel is shown as loading control. (D) Staining of U2OS cells as in (a) after transfection of a control shRNA (sh Co) or an shRNA against the long CD47 3'UTR isoform. (E) CD47 protein contains an N-terminal signal peptide (S; green), ECD (blue), five TMDs (grey) and a cytoplasmic C-terminus (C; red). In both constructs, the ECD was replaced with GFP and either fused with the long (GFP-TM-LU) or the short CD47 3'UTR (GFP-TM-SU). Constructs are drawn to scale. (F) Fluorescence confocal microscopy of fixed U2OS cells after transfection of GFP-TM-LU or GFP-TM-SU. Bottom, with additional staining of the endoplasmic reticulum with anti-calnexin. (G) FACS analysis of GFP expression in transfected U2OS cells with (dark blue lines, detection of total expression) and without permeabilization (light blue lines, detection of surface (surf.) expression). Values for mean fluorescence intensity (MFI) are shown in parentheses. Unstained cells are shown in grey. Representative image from more than twenty experiments. (H) RNA-fluorescence in situ hybridization (FISH) (red) against GFP in permeabilized U2OS cells after transfection of GFP-TM-LU or GFP-TM-SU. Bottom panel also shows GPF-TM protein. a, d, f and h are representative images from hundreds of cells. Scale bars, 10 µm.
Figure 2. 3'UTR-dependent protein localization (UDPL) depends on HuR, SET and RAC1, and mediates surface localization of membrane proteins
(A) Model of UDPL. HuR binds to the long 3'UTR and recruits SET. During translation of CD47 mRNA this protein complex is targeted to the endoplasmic reticulum (ER) surface where SET binds to the newly translated cytoplasmic domains of CD47. This step likely requires energy. SET interacts with RAC1 and active RAC1 translocates SET and CD47 to the plasma membrane. (B) FACS analysis of endogenous CD47 protein expression in HEK293 cells. Left panel is after transfection of control shRNA (shCo) or shRNAs against HuR (shown are all GFP+ cells). Middle and right panels depict cells stably expressing the indicated shRNAs. Surface CD47 (top) and total CD47 protein (bottom) were measured. (C) 3'-seq analysis for CD44 in HEK293 cells and for TNFRSF13C in B-LCL cells, as shown in Fig. 1b. FACS analysis of endogenous CD44 protein in HEK293 cells (left) and endogenous BAFFR protein in SHSY-5Y cells (right) shown as in b (left). (D) Left, FACS analysis of GFP after transfection of constructs containing a signal peptide and GFP fused to the TMD and C terminus of CD44 and either the long 39UTR (dark blue line) or the short 3'UTR(light blue line) in U251 cells. Right, as in left panel, but for BAFFR with transfection into HeLa cells. (E) FACS analysis of GFP expression shows that HuR-BS is sufficient for surface localization of GFP-TM (dark blue line). Deletion of the binding sites from the HuR-BS construct (HuR-BSΔ) abrogates GFP surface expression (light blue line). For b, c, d and e surface and total protein expression were determined and shown as in Fig. 1g. Representative images from three (sh2 HuR, n = 5) biological replicates.
Figure 3. Mechanism of UDPL
(A) Left, RNA-immunoprecipitation after transfection of the indicated constructs into HEK293 cells. Protein-RNA complexes were pulled-down with anti-HuR antibody and GFP abundance was normalized to GAPDH and is shown as fraction of input. Right, RNA co-immunoprecipitation after transfection of the indicated shRNAs. Protein-RNA complexes were pulled down with anti-SET antibody and the abundance of CD47-LU was normalized to GAPDH and is shown as fraction of input. Shown is mean ± s.d., n = 3 biological replicates. ***P < 0.0003, **_P_ < 0.002, NS, not significant, (_P_ > 0.05), two-sided t-test for independent samples. (B) MS2-binding sites (see Extended Data Fig. 5) were added to GFP-TM-SU and co-transfected with MS2-mC (left), MS2-mC-HuR (middle) or MS2-mC-SET (right). mC, mCherry. Fluorescence confocal microscopy of HEK293 cells after transfection of indicated constructs shows that recruitment of HuR or SET to the short 3'UTR redirects localization of GFP protein from the endoplasmic reticulum to the cell surface. Representative images from hundreds of cells. Scale bars, 10 µm. (C) Co-immunoprecipitation of endogenous SET using anti-GFP antibody after transfection of CD47-SU or CD47-LU in HEK293 cells (for constructs, see Fig. 4a). 2% of input was loaded. (D) FACS analysis of surface GFP expression after transfection of GFP-TM-LU (dark blue line), GFP-TM-LU with a C-terminal deletion (ΔC; light blue line; left) or with destruction of both SET-binding sites (ΔC and K163A, K166A, K175A; ΔCL; light blue line, right). Shown as in Fig. 1g. Representative image from more than four experiments. (E) Co-immunoprecipitation of endogenous SET using anti-GFP antibody after transfection of the indicated constructs. 2% of input was loaded. Asterisk indicates unspecific band.
Figure 4. CD47 protein has different functions dependent on whether it was generated by the SU or LU isoform
(A) To generate GFP-CD47, GFP was inserted in frame between the signal peptide and the rest of the CD47 open reading frame. GFP-CD47 was fused with either the long or short CD47 3'UTR, called CD47-LU and CD47-SU respectively. (B) FACS analysis of surface (surf.; light blue) and total (dark blue) GFP–CD47 expression in transfected JinB8 cells. Shown as in Fig. 1g. Representative images from four experiments. (C) FACS analysis of GFP expression after transfection of CD47-LU or CD47-SU with or without co-transfection of dominant-negative RAC1 (N17RAC1). Shown as in Fig. 1g. Representative images from n = 7 (LU) and n = 2 (SU) experiments. (D) Fraction of Mitomycin C-treated cells that survived at d3 after co-culture with macrophages is displayed for Jurkat, JinB8 (CD47−/−) and the GFP+ JinB8 cells after nucleofection of CD47-LU or CD47-SU. Shown is mean ± s.d., n = 3 biological replicates. **P < 0.005, *_P_ < 0.02, NS, not significant (_P_ > 0.05), two-sided t-test for independent samples. (E) The fraction of surviving cells (TO-PRO3 negative) measured by FACS analysis at day 3 after γ-irradiation is shown for the same populations as in (d). Shown is mean ± s.d., n = 3 biological replicates of the 20% of cells with the highest GFP expression. Gy, Gray. (F) Fluorescence confocal microscopy of permeabilized U251 cells after transfection of CD47-LU or CD47-SU co-stained with anti-RAC1 antibody. Yellow indicates co-localization. Representative images from hundreds of cells. Scale bars, 10 µm. (G) Immunoprecipitation of endogenous RAC1–GTP (active RAC1) in HEK293 cells after transfection of CD47-LU, CD47-SU, or empty vector. Total RAC1 and GFP–CD47 were measured from input. n=3 biological replicates.
Comment in
- RNA: 3' UTR alternatives to protein localization.
Zlotorynski E. Zlotorynski E. Nat Rev Mol Cell Biol. 2015 Jun;16(6):327. doi: 10.1038/nrm3996. Epub 2015 May 8. Nat Rev Mol Cell Biol. 2015. PMID: 25953618 No abstract available.
Similar articles
- RNA: 3' UTR alternatives to protein localization.
Zlotorynski E. Zlotorynski E. Nat Rev Mol Cell Biol. 2015 Jun;16(6):327. doi: 10.1038/nrm3996. Epub 2015 May 8. Nat Rev Mol Cell Biol. 2015. PMID: 25953618 No abstract available. - Emerging Roles for 3' UTRs in Neurons.
Bae B, Miura P. Bae B, et al. Int J Mol Sci. 2020 May 12;21(10):3413. doi: 10.3390/ijms21103413. Int J Mol Sci. 2020. PMID: 32408514 Free PMC article. Review. - Alternative polyadenylation can regulate post-translational membrane localization.
Mitra M, Johnson EL, Coller HA. Mitra M, et al. Trends Cell Mol Biol. 2015;10:37-47. Trends Cell Mol Biol. 2015. PMID: 26937127 Free PMC article. - Alternative 3' UTRs play a widespread role in translation-independent mRNA association with the endoplasmic reticulum.
Cheng LC, Zheng D, Zhang Q, Guvenek A, Cheng H, Tian B. Cheng LC, et al. Cell Rep. 2021 Jul 20;36(3):109407. doi: 10.1016/j.celrep.2021.109407. Cell Rep. 2021. PMID: 34289366 Free PMC article. - Regulation by 3'-Untranslated Regions.
Mayr C. Mayr C. Annu Rev Genet. 2017 Nov 27;51:171-194. doi: 10.1146/annurev-genet-120116-024704. Epub 2017 Aug 30. Annu Rev Genet. 2017. PMID: 28853924 Review.
Cited by
- Elevated CD47 is a hallmark of dysfunctional aged muscle stem cells that can be targeted to augment regeneration.
Porpiglia E, Mai T, Kraft P, Holbrook CA, de Morree A, Gonzalez VD, Hilgendorf KI, Frésard L, Trejo A, Bhimaraju S, Jackson PK, Fantl WJ, Blau HM. Porpiglia E, et al. Cell Stem Cell. 2022 Dec 1;29(12):1653-1668.e8. doi: 10.1016/j.stem.2022.10.009. Epub 2022 Nov 15. Cell Stem Cell. 2022. PMID: 36384141 Free PMC article. - APC mutations dysregulate alternative polyadenylation in cancer.
Gabel AM, Belleville AE, Thomas JD, Pineda JMB, Bradley RK. Gabel AM, et al. Genome Biol. 2024 Oct 7;25(1):255. doi: 10.1186/s13059-024-03406-4. Genome Biol. 2024. PMID: 39375704 Free PMC article. - Activity-regulated synaptic targeting of lncRNA ADEPTR mediates structural plasticity by localizing Sptn1 and AnkB in dendrites.
Grinman E, Nakahata Y, Avchalumov Y, Espadas I, Swarnkar S, Yasuda R, Puthanveettil SV. Grinman E, et al. Sci Adv. 2021 Apr 16;7(16):eabf0605. doi: 10.1126/sciadv.abf0605. Print 2021 Apr. Sci Adv. 2021. PMID: 33863727 Free PMC article. - RNA: 3' UTR alternatives to protein localization.
Zlotorynski E. Zlotorynski E. Nat Rev Mol Cell Biol. 2015 Jun;16(6):327. doi: 10.1038/nrm3996. Epub 2015 May 8. Nat Rev Mol Cell Biol. 2015. PMID: 25953618 No abstract available. - The RNA-binding protein vigilin regulates VLDL secretion through modulation of Apob mRNA translation.
Mobin MB, Gerstberger S, Teupser D, Campana B, Charisse K, Heim MH, Manoharan M, Tuschl T, Stoffel M. Mobin MB, et al. Nat Commun. 2016 Sep 26;7:12848. doi: 10.1038/ncomms12848. Nat Commun. 2016. PMID: 27665711 Free PMC article.
References
Supplementary References
- Neviani P, et al. The tumor suppressor PP2A is functionally inactivated in blast crisis CML through the inhibitory activity of the BCR/ABL-regulated SET protein. Cancer Cell. 2005;8:355–368. - PubMed
- Nho RS, et al. PTEN regulates fibroblast elimination during collagen matrix contraction. J Biol Chem. 2006;281:33291–33301. - PubMed
- Reinhold MI, et al. In vivo expression of alternatively spliced forms of integrin-associated protein (CD47) Journal of cell science. 1995;108(Pt 11):3419–3425. - PubMed
- Bertrand E, et al. Localization of ASH1 mRNA particles in living yeast. Mol Cell. 1998;2:437–445. - PubMed
Publication types
MeSH terms
Substances
Grants and funding
- DRR-24-13/DRCRF/Damon Runyon Cancer Research Foundation/United States
- P30 CA008748/CA/NCI NIH HHS/United States
- U01 CA164190/CA/NCI NIH HHS/United States
- U01-CA164190/CA/NCI NIH HHS/United States
LinkOut - more resources
Full Text Sources
Other Literature Sources
Molecular Biology Databases
Research Materials
Miscellaneous

