APOBEC3A cytidine deaminase induces RNA editing in monocytes and macrophages - PubMed (original) (raw)
APOBEC3A cytidine deaminase induces RNA editing in monocytes and macrophages
Shraddha Sharma et al. Nat Commun. 2015.
Abstract
The extent, regulation and enzymatic basis of RNA editing by cytidine deamination are incompletely understood. Here we show that transcripts of hundreds of genes undergo site-specific C>U RNA editing in macrophages during M1 polarization and in monocytes in response to hypoxia and interferons. This editing alters the amino acid sequences for scores of proteins, including many that are involved in pathogenesis of viral diseases. APOBEC3A, which is known to deaminate cytidines of single-stranded DNA and to inhibit viruses and retrotransposons, mediates this RNA editing. Amino acid residues of APOBEC3A that are known to be required for its DNA deamination and anti-retrotransposition activities were also found to affect its RNA deamination activity. Our study demonstrates the cellular RNA editing activity of a member of the APOBEC3 family of innate restriction factors and expands the understanding of C>U RNA editing in mammals.
Figures
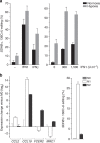
Figure 1. SDHB c.136C>U RNA editing in IFN-treated MEPs and M1 macrophages
(a) Mean and its s.e. (_n_=3) are shown on left for editing levels in MEPs optionally treated with IFN1 (600 U ml−1), IFNγ (200 U ml−1) and hypoxia (1% O2) for 24 h. The additive induction of SDHB c.136C>U RNA editing by the IFNs and hypoxia is also depicted on right. Matched MEPs of seven individuals were cultured under normoxia or hypoxia with 0, 300 or 1,500 U ml−1 IFN1 for 24 h. Mean and its s.e. (_n_=7) for editing levels in the cells are shown. Editing level in cells treated with both hypoxia and IFN1 was higher than in cells treated with only hypoxia or IFN1 (Wilcoxon test P<0.02, for both concentrations of IFN1). (**b**) M1 and M2 macrophages were generated from unpolarized M0 macrophages derived from CD14+ monocytes isolated from peripheral blood of three individuals. Mean and range (_n_=3) of expression of genes for markers of M1 and M2 polarization and _SDHB_ c.136C>U editing levels in the cells are depicted. Gene expression was quantified by RT–PCR and normalized to that of ACTB.
Figure 2. RNA editing in MEPs and macrophages
(a) Mean and range of RNA-editing levels (%) at sites identified by comparing transcriptome sequences of three pairs of hypoxic and normoxic MEPs, or M1 and M2 macrophages for differential RNA editing under hypoxia or M1 polarization. (b) Cumulative frequency plots of mean editing levels and fold-change effects of hypoxia or M1 polarization on editing level, by type of RNA editing. Fold-change values were estimated with the inverted β-binomial test and their absolute values are capped at 104. (c) Distributions for editing sites in coding RNAs of gene feature and effect of editing on amino acid coding, by type of RNA editing. (d) Logos indicating sequence conservation and nucleotide frequency for sequences bearing C>U editing sites (at position 0) with a higher editing level in hypoxic compared with normoxic MEPs (_n_=206) or M1 compared with M2 macrophages (_n_=122); mean and 95% confidence interval (CI) of relative entropy values are also plotted. (e) Stem-loop structure in SDHB RNA with the c.136C>U editing site underlined and 5-b palindromes forming the stem indicated. Histograms depict the distributions of flanking palindrome length by sequence at −3 to 0 positions for the sites whose sequence logos are shown in d. (f) Effect of hypoxia or M1 polarization on transcript levels of genes that are expressed in MEPs or macrophages and code for ADAR and cytidine deaminase enzymes and some markers of M1 (FCER1A and MRC1) or M2 (CCL2 and IL8) macrophage polarization. Mean and range (_n_=3) are shown; NS, not significant (FDR ⩾0.05, edgeR likelihood ratio test); #, not expressed; genes not marked NS or # are differentially expressed with FDR <0.05.
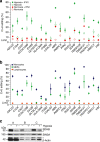
Figure 3. C>U RNA editing induced in MEPs and monocytes by hypoxia and IFN1.
(a) Site-specific C>U RNA editing for 19 genes of MEPs of three individuals was quantified by Sanger sequencing of RT–PCR products. MEPs were optionally treated with hypoxia and/or 600 U ml−1 IFN1 for 24 h. (b) Editing of the sites was also similarly examined in hypoxia- and IFN1-treated MEPs of another three individuals and in lymphocytes and CD14+ monocytes isolated from the MEPs. Because of absent or low gene expression, a C1QA RT–PCR product could not be obtained for any of the three lymphocyte isolates. Sanger sequence chromatograms for the three monocyte and two of the lymphocyte isolates are shown in Supplementary Fig. 3c. Site-specific C>U RNA editing in the monocytes and lymphocytes for 12 other genes is depicted in Supplementary Fig. 3b. Mean and its s.e. (n_=3) are shown in both panels. The detection limit for editing (5% level) is indicated. Samples without detectable editing were assigned a value of 3.8%. (c) SDHB and SIN3A protein levels in whole-cell lysates (20 μg protein) of monocytes isolated from normoxic and hypoxic MEPs of a separate set of three donors. Non-specific signals of the western blots are indicated by asterisk (*_).
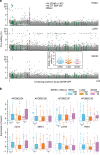
Figure 4. Association of APOBEC3A gene expression with SDHB c.136C>U RNA editing in tumour samples of TCGA
(a) C>U RNA editing was estimated from RNA-sequencing data for primary head and neck squamous cell carcinoma (HNSC, _n_=298), lung adenocarcinoma (LUAD, _n_=220) and secondary skin cutaneous melanoma (SKCM, _n_=187) tumours. Editing levels at all 213 C-bearing positions along SDHB ORF are plotted for every tumour. Mean levels at the positions (black), the c.136C site (red) and known C/T single-nucleotide polymorphism sites (green) are indicated. Inset shows SDHB c.136C>U editing levels and their mean and s.d. for tumours identified as positive for the editing. (b) Tukey's plots of expression of some APOBEC3 (A3) and hypoxia- (LDHA and PGK1) and macrophage-associated (CD14 and MRC1) genes among SDHB c.136C>U editing-positive and -negative tumours. Error bars denote 25th percentile −1.5 × interquartile range (IQR) and 75th percentile+1.5 × IQR values. Group sizes are noted in the legend. _*_FDR <0.05 (edgeR exact test for differential expression).
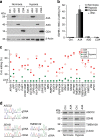
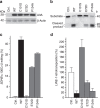
Figure 5. APOBEC3A induces C>U RNA editing in 293T transfectants.
(a) Immunoblots showing APOBEC3A (A3A), APOBEC3G (A3G) and CDA proteins in whole-cell lysates (20 μg protein) of 293T cells transiently transfected with an empty vector (Ctrl., control) or DNA constructs for expression of A3A, A3G or CDA proteins. (b) SDHB c.136C>U RNA editing in the 293T transfectants, which were optionally treated with hypoxia and/or 600 U ml−1 type I IFN (IFN1). Mean and range for _n_=3 are shown. (c) Estimation of site-specific C>U RNA editing by Sanger sequencing of RT–PCR products for 30 genes in the transfectants (_n_=1). The detection limit for editing (5% level) is indicated. Samples without detectable editing were assigned a value of 3.8%. Chromatograms for 19 genes are shown in Supplementary Fig. 5. Chromatograms of good quality could not be obtained for C1QA and TMEM179B for the A3G and CDA transfectants, and for the GPR160 site for the normoxic A3A transfectant. (d) Chromatograms of genomic DNA (gDNA) and cDNA PCR products of normoxic A3A transfectants, indicating C>U RNA editing without C>T genomic change at positions marked with * for ASCC2, SDHB and TMEM109. Immunoblots showing ASCC2, SDHB and TMEM109 proteins in whole-cell lysates (20 μg protein) of control or A3A transfectants on the right indicate reduced protein expression in association with A3A-induced stop codons in RNA. Only a single band of signal, which corresponded to a protein of full length, was seen in all three immunoblots.
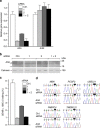
Figure 6. Knockdown of APOBEC3A (A3A) reduces C>U RNA editing in M1 macrophages
(a) A3A and APOBEC3G (A3G) gene expression in M1 macrophages that were transfected with a nonspecific (Ctrl.) or either one (1, 2) or equimolar mix (1+2) of two A3A_-specific siRNAs at 100 nM concentration. Gene expression measurements are normalized to that for ACTB. (b) Immunoblot for A3A protein (23 kDa) of whole-cell lysates (10 μg protein) of two of each set of three replicate transfectants. Nonspecific signals are indicated by an asterisk (*_). The signal for calnexin, a house-keeping protein, indicates total protein. (c) SDHB c.136C>U RNA-editing levels in the siRNA transfectants, which are determined by RT–qPCR. (d) Sanger sequence chromatogram traces of amplified cDNA fragments, indicating reduced site-specific RNA editing for five other genes in _A3A_-specific siRNA 1 compared with Ctrl. transfectants. Mean and range (_n_=3) are shown for a and c.
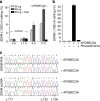
Figure 7. Activity of APOBEC3A (A3A) mutants in 293T transfectants
(a) A3A protein level in whole-cell lysates (20 μg protein) of cells transfected with an empty vector (Ctrl.) or expression constructs for wild-type (WT) A3A or its C101S, E72D or P134A variants. (b) Cytidine deamination activity of the transfectant lysates was examined in an in vitro reaction with a 5′ fluorescent dye-labelled ssDNA substrate of 40 bases (b). C>U deamination of the single cytidine residue of the substrate at position 23 followed by deglycosylation of the uridine and subsequent cleavage of the product at the abasic site was evaluated by electrophoresis of reactions of one hour duration on a polyacrylamide gel, whose fluorographic image is shown. (c) SDHB c.136C>U RNA editing in the transfectants. (d) Retrotransposition of a human LINE-1 element in a separate set of 293T transfectants. Retrotransposition, relative to the Ctrl. transfectant, was assessed with a luciferase reporter-based assay and is quantified as the ratio of firefly and Renilla luciferase activities. Mean and range (_n_=3) are shown for c and d.
Figure 8. In vitro cytidine deamination of SDHB RNA and ssDNA by APOBEC3A
(a) c.136C>U editing of an ∼1.1 kb exogenous SDHB ORF RNA by whole-cell lysates of control or APOBEC3A 293T transfectants. Duration of the deamination reactions and amount of lysate protein in them are noted. For some reactions, lysates were pre-heated at 85 °C for 15 min. (b) c.136C>U editing of the RNA by 10 μM purified _C_-His6-tagged APOBEC3A protein. The reactions had 180 amole SDHB RNA and 100 nM ZnCl2. (c) Sanger sequence chromatogram traces of PCR amplified products of SDHB deamination reactions that had either 180 amole of ∼1.1 kb SDHB RNA or 100 amole of SDHB ssDNA of 120 b as substrate. APOBEC3A protein was present in the+reactions at 5 and 20 μM in the reaction with RNA and DNA substrate, respectively. Reactions for b and c conducted for two hours at 37 °C. Mean and range (_n_=3) are shown in a and b, respectively.
Similar articles
- Transient overexpression of exogenous APOBEC3A causes C-to-U RNA editing of thousands of genes.
Sharma S, Patnaik SK, Kemer Z, Baysal BE. Sharma S, et al. RNA Biol. 2017 May 4;14(5):603-610. doi: 10.1080/15476286.2016.1184387. Epub 2016 May 5. RNA Biol. 2017. PMID: 27149507 Free PMC article. - Innate immune signaling induces high levels of TC-specific deaminase activity in primary monocyte-derived cells through expression of APOBEC3A isoforms.
Thielen BK, McNevin JP, McElrath MJ, Hunt BV, Klein KC, Lingappa JR. Thielen BK, et al. J Biol Chem. 2010 Sep 3;285(36):27753-66. doi: 10.1074/jbc.M110.102822. Epub 2010 Jul 8. J Biol Chem. 2010. PMID: 20615867 Free PMC article. - RNA editing enzyme APOBEC3A promotes pro-inflammatory M1 macrophage polarization.
Alqassim EY, Sharma S, Khan ANMNH, Emmons TR, Cortes Gomez E, Alahmari A, Singel KL, Mark J, Davidson BA, Robert McGray AJ, Liu Q, Lichty BD, Moysich KB, Wang J, Odunsi K, Segal BH, Baysal BE. Alqassim EY, et al. Commun Biol. 2021 Jan 22;4(1):102. doi: 10.1038/s42003-020-01620-x. Commun Biol. 2021. PMID: 33483601 Free PMC article. - An overview of cytidine deaminases.
Navaratnam N, Sarwar R. Navaratnam N, et al. Int J Hematol. 2006 Apr;83(3):195-200. doi: 10.1532/IJH97.06032. Int J Hematol. 2006. PMID: 16720547 Review. - C-to-U editing and site-directed RNA editing for the correction of genetic mutations.
Vu LT, Tsukahara T. Vu LT, et al. Biosci Trends. 2017 Jul 24;11(3):243-253. doi: 10.5582/bst.2017.01049. Epub 2017 May 8. Biosci Trends. 2017. PMID: 28484188 Review.
Cited by
- Replication-competent HIV-1 in human alveolar macrophages and monocytes despite nucleotide pools with elevated dUTP.
Cui J, Meshesha M, Churgulia N, Merlo C, Fuchs E, Breakey J, Jones J, Stivers JT. Cui J, et al. Retrovirology. 2022 Sep 16;19(1):21. doi: 10.1186/s12977-022-00607-2. Retrovirology. 2022. PMID: 36114511 Free PMC article. - Point mutation bias in SARS-CoV-2 variants results in increased ability to stimulate inflammatory responses.
Kosuge M, Furusawa-Nishii E, Ito K, Saito Y, Ogasawara K. Kosuge M, et al. Sci Rep. 2020 Oct 20;10(1):17766. doi: 10.1038/s41598-020-74843-x. Sci Rep. 2020. PMID: 33082451 Free PMC article. - C-to-U RNA Editing: A Site Directed RNA Editing Tool for Restoration of Genetic Code.
Bhakta S, Tsukahara T. Bhakta S, et al. Genes (Basel). 2022 Sep 12;13(9):1636. doi: 10.3390/genes13091636. Genes (Basel). 2022. PMID: 36140804 Free PMC article. Review. - Deciphering miRNAs' Action through miRNA Editing.
Correia de Sousa M, Gjorgjieva M, Dolicka D, Sobolewski C, Foti M. Correia de Sousa M, et al. Int J Mol Sci. 2019 Dec 11;20(24):6249. doi: 10.3390/ijms20246249. Int J Mol Sci. 2019. PMID: 31835747 Free PMC article. Review.
References
- Tang W., Fei Y. & Page M. Biological significance of RNA editing in cells. Mol. Biotechnol. 52, 91–100 (2012). - PubMed
- Peng Z. et al.. Comprehensive analysis of RNA-Seq data reveals extensive RNA editing in a human transcriptome. Nat. Biotechnol. 30, 253–260 (2012). - PubMed
- Li J. B. et al.. Genome-wide identification of human RNA editing sites by parallel DNA capturing and sequencing. Science 324, 1210–1213 (2009). - PubMed
Publication types
MeSH terms
Substances
LinkOut - more resources
Full Text Sources
Other Literature Sources
Research Materials
