Drinking Patterns in US Counties From 2002 to 2012 - PubMed (original) (raw)
Drinking Patterns in US Counties From 2002 to 2012
Laura Dwyer-Lindgren et al. Am J Public Health. 2015 Jun.
Abstract
Objectives: We estimated the prevalence of any drinking and binge drinking from 2002 to 2012 and heavy drinking from 2005 to 2012 in every US county.
Methods: We applied small area models to Behavioral Risk Factor Surveillance System data. These models incorporated spatial and temporal smoothing and explicitly accounted for methodological changes to the Behavioral Risk Factor Surveillance System during this period.
Results: We found large differences between counties in all measures of alcohol use: in 2012, any drinking prevalence ranged from 11.0% to 78.7%, heavy drinking prevalence ranged from 2.4% to 22.4%, and binge drinking prevalence ranged from 5.9% to 36.0%. Moreover, there was wide variation in the proportion of all drinkers who engaged in heavy or binge drinking. Heavy and binge drinking prevalence increased in most counties between 2005 and 2012, but the magnitude of change varied considerably.
Conclusions: There are large differences within the United States in levels and recent trends in alcohol use. These estimates should be used as an aid in designing and implementing targeted interventions and to monitor progress toward reducing the burden of excessive alcohol use.
Figures
FIGURE 1—
Behavioral Risk Factor Surveillance System survey questions on alcohol: United States, 2002–2012. Note. Vertical lines demarcate years when question text changed. Red is used to highlight the portions of the text unique to a given version of the question.
FIGURE 2—
Age-standardized alcohol use prevalence of (a) any drinking, (b) heavy drinking, and (c) binge drinking: Behavioral Risk Factor Surveillance System, United States, 2012.
FIGURE 3—
Ratio of male to female age-standardized alcohol use prevalence of (a) any drinking, (b) heavy drinking, and (c) binge drinking: Behavioral Risk Factor Surveillance System, United States, 2012.
FIGURE 4—
Age-standardized prevalence among all alcohol users of (a) heavy drinking and (b) binge drinking: Behavioral Risk Factor Surveillance System, United States, 2012.
FIGURE 5—
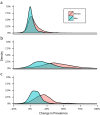
Change in age-standardized alcohol use prevalence of (a) any drinking, (b) heavy drinking, and (c) binge drinking: Behavioral Risk Factor Surveillance System, United States, 2005–2012.
FIGURE 6—
Change in age-standardized alcohol use prevalence, by gender, of (a) any drinking, (b) heavy drinking, and (c) binge drinking: Behavioral Risk Factor Surveillance System, United States, 2005–2012. Note. Counties with more than 25% decline or more than 100% increase in drinking prevalence are not included.
Similar articles
- Patterns of alcohol consumption and alcohol-impaired driving in the United States.
Flowers NT, Naimi TS, Brewer RD, Elder RW, Shults RA, Jiles R. Flowers NT, et al. Alcohol Clin Exp Res. 2008 Apr;32(4):639-44. doi: 10.1111/j.1530-0277.2008.00622.x. Epub 2008 Mar 13. Alcohol Clin Exp Res. 2008. PMID: 18341648 - Trends in alcohol use and binge drinking, 1985-1999: results of a multi-state survey.
Serdula MK, Brewer RD, Gillespie C, Denny CH, Mokdad A. Serdula MK, et al. Am J Prev Med. 2004 May;26(4):294-8. doi: 10.1016/j.amepre.2003.12.017. Am J Prev Med. 2004. PMID: 15110055 - What do binge drinkers drink? Implications for alcohol control policy.
Naimi TS, Brewer RD, Miller JW, Okoro C, Mehrotra C. Naimi TS, et al. Am J Prev Med. 2007 Sep;33(3):188-93. doi: 10.1016/j.amepre.2007.04.026. Am J Prev Med. 2007. PMID: 17826577 - Surveillance for certain health behaviors among selected local areas--United States, Behavioral Risk Factor Surveillance System, 2002.
Balluz L, Ahluwalia IB, Murphy W, Mokdad A, Giles W, Harris VB. Balluz L, et al. MMWR Surveill Summ. 2004 Jul 23;53(5):1-100. MMWR Surveill Summ. 2004. PMID: 15269697 - Alcohol-related injury visits: do we know the true prevalence in U.S. trauma centres?
MacLeod JB, Hungerford DW. MacLeod JB, et al. Injury. 2011 Sep;42(9):922-6. doi: 10.1016/j.injury.2010.01.098. Injury. 2011. PMID: 22081821 Review.
Cited by
- Alcohol Consumption on the Heaviest Drinking Occasion and Hangovers during the First Dutch COVID-19 Lockdown.
Merlo A, Severeijns NR, Hendriksen PA, Benson S, Scholey A, Garssen J, Bruce G, Verster JC. Merlo A, et al. Int J Environ Res Public Health. 2022 Apr 3;19(7):4301. doi: 10.3390/ijerph19074301. Int J Environ Res Public Health. 2022. PMID: 35409981 Free PMC article. - Increasing rates of early-onset Luminal A breast cancers correlate with binge drinking patterns.
Chen J, Kehm R, Yang W, Terry MB. Chen J, et al. Breast Cancer Res. 2024 Oct 18;26(1):145. doi: 10.1186/s13058-024-01894-7. Breast Cancer Res. 2024. PMID: 39425225 Free PMC article. - Alcohol, cigarette smoking, and ovarian reserve in reproductive-age African-American women.
Hawkins Bressler L, Bernardi LA, De Chavez PJ, Baird DD, Carnethon MR, Marsh EE. Hawkins Bressler L, et al. Am J Obstet Gynecol. 2016 Dec;215(6):758.e1-758.e9. doi: 10.1016/j.ajog.2016.07.012. Epub 2016 Jul 11. Am J Obstet Gynecol. 2016. PMID: 27418446 Free PMC article. - Sex and β-Endorphin Influence the Effects of Ethanol on Limbic Gabra2 Expression in a Mouse Binge Drinking Model.
Rhinehart EM, Nentwig TB, Wilson DE, Leonard KT, Chaney BN, Grisel JE. Rhinehart EM, et al. Front Genet. 2018 Nov 29;9:567. doi: 10.3389/fgene.2018.00567. eCollection 2018. Front Genet. 2018. PMID: 30555510 Free PMC article. - Factors Associated With Geographic Disparities in Gastrointestinal Cancer Mortality in the United States.
Ma C, Congly SE, Chyou DE, Ross-Driscoll K, Forbes N, Tsang ES, Sussman DA, Goldberg DS. Ma C, et al. Gastroenterology. 2022 Aug;163(2):437-448.e1. doi: 10.1053/j.gastro.2022.04.019. Epub 2022 Apr 25. Gastroenterology. 2022. PMID: 35483444 Free PMC article.
References
- Corrao G, Rubbiati L, Bagnardi V, Zambon A, Poikolainen K. Alcohol and coronary heart disease: a meta-analysis. Addiction. 2000;95(10):1505–1523. - PubMed
- Corrao G, Bagnardi V, Zambon A, La Vecchia C. A meta-analysis of alcohol consumption and the risk of 15 diseases. Prev Med. 2004;38(5):613–619. - PubMed
- Rehm J, Taylor B, Mohapatra S et al. Alcohol as a risk factor for liver cirrhosis: a systematic review and meta-analysis. Drug Alcohol Rev. 2010;29(4):437–445. - PubMed
Publication types
MeSH terms
LinkOut - more resources
Full Text Sources
Medical


