The histone deacetylase SIRT6 controls embryonic stem cell fate via TET-mediated production of 5-hydroxymethylcytosine - PubMed (original) (raw)
doi: 10.1038/ncb3147. Epub 2015 Apr 27.
Lukas Chavez 2, Yun Huang 2, Kenneth N Ross 1, Jiho Choi 1, Barbara Martinez-Pastor 1, Ryan M Walsh 1, Cesar A Sommer 3, Matthias Lienhard 2, Adrianne Gladden 4, Sita Kugel 1, Dafne M Silberman 5, Sridhar Ramaswamy 1, Gustavo Mostoslavsky 3, Konrad Hochedlinger 6, Alon Goren 4, Anjana Rao 2, Raul Mostoslavsky 1
Affiliations
- PMID: 25915124
- PMCID: PMC4593707
- DOI: 10.1038/ncb3147
The histone deacetylase SIRT6 controls embryonic stem cell fate via TET-mediated production of 5-hydroxymethylcytosine
Jean-Pierre Etchegaray et al. Nat Cell Biol. 2015 May.
Abstract
How embryonic stem cells (ESCs) commit to specific cell lineages and yield all cell types of a fully formed organism remains a major question. ESC differentiation is accompanied by large-scale histone and DNA modifications, but the relations between these epigenetic categories are not understood. Here we demonstrate the interplay between the histone deacetylase sirtuin 6 (SIRT6) and the ten-eleven translocation enzymes (TETs). SIRT6 targets acetylated histone H3 at Lys 9 and 56 (H3K9ac and H3K56ac), while TETs convert 5-methylcytosine into 5-hydroxymethylcytosine (5hmC). ESCs derived from Sirt6 knockout (S6KO) mice are skewed towards neuroectoderm development. This phenotype involves derepression of OCT4, SOX2 and NANOG, which causes an upregulation of TET-dependent production of 5hmC. Genome-wide analysis revealed neural genes marked with 5hmC in S6KO ESCs, thereby implicating TET enzymes in the neuroectoderm-skewed differentiation phenotype. We demonstrate that SIRT6 functions as a chromatin regulator safeguarding the balance between pluripotency and differentiation through Tet-mediated production of 5hmC.
Figures
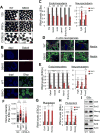
Figure 1. Sirt6 deficiency skews ESC differentiation towards neuroectoderm and promotes expression of Oct4, Sox2, Nanog
(A) EBs derived from WT and S6KO ESCs (129, iPSCs from 129 and C57BL/6 mouse strain). Scale bar, 250 μm. (B) Immunofluorescence of EBs from WT and S6KO (129 mouse strain) for Gata4 (scale bar, 250 μm) and Gfap (scale bar 500 μm). (C) Expression of endoderm, mesoderm and neuroectoderm genes in WT versus S6KO EBs. qRT-PCR data is expressed relative to WT EBs. (D) Immunofluorescence of in vitro generated neurons from WT and S6KO EBs for Nestin (green). Nuclei were stained with DAPI. (E) Expression of endoderm, mesoderm and neuroectoderm genes in WT versus S6KO ESCs. qRT-PCR data is expressed relative to WT EBs. (F) Quantification of Nanog levels (mean intensity, a.u.) per cell by immunostaining in WT and S6KO ESCs from 129 and C57BL/6 genetic backgrounds. Yellow bars represent mean +/− s.e.m. *** P < 0.001 by 1 way Anova followed by Tukey test analysis. (a.u., arbitrary units). (G) Core pluripotent gene expression in WT versus S6KO ESCs assessed by qRT-PCR analysis. (H) Core pluripotent gene expression in WT versus S6KO EBs assessed by qRT-PCR analysis. (I) Western blot analysis for the core pluripotent factors on WT versus S6KO EBs. These are representatives of at least n = 3 experimental replicates. The data on panels (C), (E), (F), (G) and (H) are at least n = 3 experimental replicates, values are mean +/− s.e.m. *P < 0.05, **P < 0.01, ***P < 0.001, ****P < 0.0001, *****P < 0.00001, by _t_-test analysis.
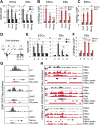
Figure 2. Sirt6-dependent regulation of core pluripotent genes
(A) Chromatin immunoprecipitation (ChIP) analysis for Sirt6 on core pluripotent gene promoters in WT ESCs and EBs. Data is expressed relative to IgG-ChIP control. (B) ChIP analysis for H3K56ac on core pluripotent gene promoters in both ESCs and EBs from WT and S6KO. Data is expressed relative to WT values. (C) ChIP analysis for H3K9ac on core pluripotent gene promoters in EBs from WT and S6KO. Data is expressed relative to WT values. (D) Schematic diagram of the Oct4 locus depicting primers used for ChIP assays in panels (E) and (F). (E) ChIP analysis for Sirt6 on the Oct4 locus in WT ESCs and EBs. Data is expressed relative to IgG-ChIP control. (F) ChIP analysis for H3K56ac on the Oct4 locus in EBs from WT and S6KO. Data is expressed relative to WT values. (G) Sirt6 ChIP-Seq binding profiles on Oct4, Sox2, and Nanog genes in WT and S6KO ESCs. Images were created with the Integrative Genomic Viewer (IGV) (Robinson et al., 2011). Data are normalized to total counts, and the scale rage is 0.0 – 7.0. (H) ChIP-Seq binding profiles of histone marks H3K56ac and H3K9ac on Oct4, Sox2 and Nanog genes in WT and S6KO ESCs. Images were created with the Integrative Genomic Viewer (IGV) (Robinson et al., 2011). Data are normalized to total counts, and the scale rage is 0.0 – 2.0. The red bars under each plot in panels (G) and (H) represent statistically significant peaks for each ChIP seq analysis.
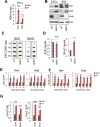
Figure 3. Oct4:Sox2-dependent upregulation of Tets in S6KO versus WT ESCs and EBs
(A) Tet1 and Tet2 gene expression in WT versus S6KO ESCs. qRT-PCR data is expressed relative to WT ESCs. (B) Western blot analysis for Tet1 and Tet2 in both ESCs and EBs. A representative of n = 3 biological replicates is shown. (C) Global 5mC and 5hmC levels assayed by slot blot analysis in WT versus S6KO ESCs. (D) Graphs showing fold change of 5mC and 5hmC from panel (H). (E) ChIP analysis for Oct4 on both Tet1 and Tet2 at Oct4:Sox2 predicted binding sites (Koh et al., 2011) in WT versus S6KO ESCs. Data is expressed relative to WT values. (F) ChIP analysis for Sox2 on both Tet1 and Tet2 at Oct4:Sox2 predicted binding sites (Koh et al., 2011) in WT versus S6KO ESCs. Data is expressed relative to WT values. The data are n = 3 experimental replicates. Values are mean +/− s.e.m. *P < 0.05, **P < 0.01, ***P < 0.001, by _t_-test analysis.
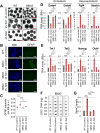
Figure 4. Tet knockdown rescues the differentiation phenotype of S6KO ESCs and global levels of 5hmC
(A) EBs derived from WT and S6KO ESCs stably infected with shRNA targeting Tet1 or Tet2. Scale bar, 500 μm. (B) Immunofluorescence of Tet knockdown EBs for Gfap. Scale bar, 500 μm. (C) Graph showing quantification of Gfap intensity (mean intensity, a.u.) per EB on panel (B). Red bars represent mean +/− s.e.m. ** P < 0.01, *** P < 0.001 by 1 way Anova followed by Tukey test analysis. (a.u., arbitrary units). Data are represented as detection of Gfap per each EB. Values are mean +/− s.e.m. **P < 0.01, ***P < 0.001 by _t_test analysis. (D) Gene expression of endoderm, and neuroectoderm genes in Tet knockdown EBs. qRT-PCR data is expressed relative to WT EBs stably transfected with shRNA control. (E) Expression of Tet and core pluripotent genes in Tet knockdown EBs analyzed as described above. (F) Global 5hmC levels assayed by slot blot analysis in Tet knockdown ESCs. (G) Graphs show fold change of 5hmC from panel (F). The data on panels (D), (E) and (G) are n = 3 experimental replicates, values are mean +/− s.e.m. *P < 0.05, **P < 0.01, ***P < 0.001, ****P < 0.0001 by _t_-test analysis.
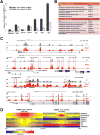
Figure 5. Characterization of genomic regions with change of 5hmC in S6KO compared to WT ESCs
(A) Total DHMRs with gain or loss of 5hmC in S6KO represent 0.04% or 0.03% of the genome, respectively (genomic windows). Both classes of DHMRs are significantly enriched in exons, promoters, and CpG islands, where DHMRs with gain or loss of 5hmC are similarly enriched at exons (p value ≤ 6.3e-155 and p value ≤ 1.5e-110, respectively), whereas DHMRs with gain of 5hmC are much stronger enriched than DHMRs with loss of 5hmC at promoters (p value ≤ 1.3e-252 and p value ≤ 6.3e-16, respectively), and at CpG islands (p value ≤ 1.4e-269 and p value ≤ 1.2e-48, respectively) (Fisher’s exact test). (B) Functional annotation (Huang et al., 2009) of genes with change of 5hmC (gain or loss) at exons, reveals significantly enriched gene ontology clusters associated with regulation of transcription and neuron differentiation. (C) UCSC browser visualization of 5hmC of gain of 5hmC in S6KO (red) versus WT (gray) at the promoter of _Hoxa_3, Gata2 and Pax6 genes, and at multiple other genomic regions in the vicinity. No changes in 5hmC levels on the Gusb gene, is shown as an analytical control. (D) Enrichment analysis of histone H3 modifications strongly connects H3K4me2 and low methylated regions to DHMRs with gain of 5hmC in S6KO. Both, gain and loss of 5hmC occurs at regions with elevated levels of CpG density and Tet1 binding. The marks are sorted by high (top) to low (bottom) enrichment at the center of DHMRs with gain of 5hmC in S6KO.
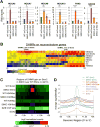
Figure 6. Association of 5hmC with H3K4me2, but not H3K9ac and/or H3K56ac in neuroectoderm genes upregulated in S6KO compared to WT ESCs
(A) Expression of neuroectoderm genes with gain of 5hmC in Tet knockdown ESCs. qRT-PCR data is expressed relative to WT-shControl. Data are n = 3 experimental replicates, values are mean +/− s.e.m. *P < 0.05, **P < 0.01, ****P < 0.0001 by _t_-test analysis. (B) Enrichment analysis of histone H3 modifications strongly connects H3K4me2 to upregulated neuroectoderm genes with gain of 5hmC in S6KO. The marks are sorted by high (top) to low (bottom) enrichment at the center of DHMRs with gain of 5hmC in S6KO. (C) Heat map plot of regions of DHMRs gain on 5hmC in S6KO over WT in ESCs showing average profile for +/− 3k centered around the 2216 regions with DHMR gains for the factors 5hmC, H3K56ac, H3K9ac, Sirt6, and Sox2 in WT and S6KO ESCs. Each row of the heat map represents mean values of enrichment z-scores in 100 bp windows in the +/−3kb region. (D) Enrichment line plot of average profile for regions of DHMRs gain on 5hmC in S6KO over WT mouse ESCs (n=2216) for data of panel (C). Semi-transparent band behind line shows standard error of the mean for each average profile.
Figure 7. Sirt6 deficiency triggers an in vivo differentiation defect in mouse and in human EBs, which is rescued by Tet knockdown on mouse teratomas
(A) Teratomas from C57BL/6 WT and S6KO ESCs. Data are shown as n = 5 biological replicates. (B) IHC analysis for β-III Tubulin and Oct4 on WT versus S6KO teratomas. Pictures are taken at 5×. IHC of one representative from n=3 experimental replicates is shown. (C) Teratomas derived from stably infected S6KO ESCs with shRNA targeting either Tet1 or Tet2 versus control shRNA. (D) and (E) IHC staining for β-III Tubulin, Oct4 and Gfap of teratomas from panel (C). One representative from n=3 experimental replicates is shown. Areas of Oct4 positive nuclear staining are demarked by the yellow arrows.
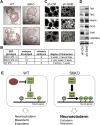
Figure 8. Sirt6 deficiency triggers an in vivo differentiation defect in mouse and in human EBs
(A) IHC analysis for GFP on chimeric mice (E12.5) derived from WT or S6KO iPSCs. Note that contribution of S6KO iPSCs is restricted to some neural tissues (yellow arrows). (B) Table showing the numbers of embryos developed and the degree of chimerism based on IHC with anti-GFP antibody. Note that S6KO iPSCs exhibit a week degree of chimerism or is restricted to the neural tissue in three embryos. (C) Human EBs (hEBs) stably infected with an shRNA control or shRNA targeting Sirt6. Scale bar, 300 μm. A representative of n = 5 biological replicates is shown. (D) Western blot analysis for Tet enzymes, Oct4 and the neuroectoderm marker Nestin on hEBs stably infected with an shRNA control or shRNA targeting Sirt6. A representative from n = 3 experimental replicates is shown. (E) Schematic representation depicting the role of Sirt6 as a regulator of ESC differentiation via repression of Oct4 and Sox2 gene expression which in turn controls Tet-dependent oxidation of 5mC into 5hmC, which is needed to achieve proper development of the germ layers. Sirt6 depletion causes a derepression of Oct4 and Sox2 triggering an upregulation of Tet-dependent 5hmC production that results in skewed development towards neuroectoderm.
Similar articles
- Epigenetic regulation of human adipose-derived stem cells differentiation.
Daniunaite K, Serenaite I, Misgirdaite R, Gordevicius J, Unguryte A, Fleury-Cappellesso S, Bernotiene E, Jarmalaite S. Daniunaite K, et al. Mol Cell Biochem. 2015 Dec;410(1-2):111-20. doi: 10.1007/s11010-015-2543-7. Epub 2015 Aug 26. Mol Cell Biochem. 2015. PMID: 26307369 - Tet1 and Tet2 regulate 5-hydroxymethylcytosine production and cell lineage specification in mouse embryonic stem cells.
Koh KP, Yabuuchi A, Rao S, Huang Y, Cunniff K, Nardone J, Laiho A, Tahiliani M, Sommer CA, Mostoslavsky G, Lahesmaa R, Orkin SH, Rodig SJ, Daley GQ, Rao A. Koh KP, et al. Cell Stem Cell. 2011 Feb 4;8(2):200-13. doi: 10.1016/j.stem.2011.01.008. Cell Stem Cell. 2011. PMID: 21295276 Free PMC article. - Pluripotency and Epigenetic Factors in Mouse Embryonic Stem Cell Fate Regulation.
Morey L, Santanach A, Di Croce L. Morey L, et al. Mol Cell Biol. 2015 Aug;35(16):2716-28. doi: 10.1128/MCB.00266-15. Epub 2015 Jun 1. Mol Cell Biol. 2015. PMID: 26031336 Free PMC article. Review. - TET enzymes and DNA hydroxymethylation in neural development and function - how critical are they?
Santiago M, Antunes C, Guedes M, Sousa N, Marques CJ. Santiago M, et al. Genomics. 2014 Nov;104(5):334-40. doi: 10.1016/j.ygeno.2014.08.018. Epub 2014 Sep 6. Genomics. 2014. PMID: 25200796 Review.
Cited by
- Sirtuins Affect Cancer Stem Cells via Epigenetic Regulation of Autophagy.
Sipos F, Műzes G. Sipos F, et al. Biomedicines. 2024 Feb 7;12(2):386. doi: 10.3390/biomedicines12020386. Biomedicines. 2024. PMID: 38397988 Free PMC article. Review. - Sirt6 regulates the proliferation of neural precursor cells and cortical neurogenesis in mice.
Wei Y, Wang X, Ma Z, Xiang P, Liu G, Yin B, Hou L, Shu P, Liu W, Peng X. Wei Y, et al. iScience. 2023 Dec 9;27(2):108706. doi: 10.1016/j.isci.2023.108706. eCollection 2024 Feb 16. iScience. 2023. PMID: 38288355 Free PMC article. - The many faces of SIRT6 in the retina and retinal pigment epithelium.
Cheng J, Keuthan CJ, Esumi N. Cheng J, et al. Front Cell Dev Biol. 2023 Nov 1;11:1244765. doi: 10.3389/fcell.2023.1244765. eCollection 2023. Front Cell Dev Biol. 2023. PMID: 38016059 Free PMC article. Review. - SIRT6 deficiency causes ovarian hypoplasia by affecting Plod1-related collagen formation.
Li L, Hua R, Hu K, Chen H, Yin Y, Shi X, Peng K, Huang Q, Qiu Y, Li X, Liu Q, Liu S, Wang Z. Li L, et al. Aging Cell. 2024 Feb;23(2):e14031. doi: 10.1111/acel.14031. Epub 2023 Nov 7. Aging Cell. 2024. PMID: 37936548 Free PMC article. - TET3-mediated DNA oxidation is essential for intestinal epithelial cell response to stressors.
Gonzalez EA, Liu Y, Wang D, Jeziorek M, Bandyopadhyay S, Rao A, Gao N, Etchegaray JP. Gonzalez EA, et al. Proc Natl Acad Sci U S A. 2023 Sep 12;120(37):e2221405120. doi: 10.1073/pnas.2221405120. Epub 2023 Sep 5. Proc Natl Acad Sci U S A. 2023. PMID: 37669386 Free PMC article.
References
- Ficz G, Branco MR, Seisenberger S, Santos F, Krueger F, Hore TA, Marques CJ, Andrews S, Reik W. Dynamic regulation of 5-hydroxymethylcytosine in mouse ES cells and during differentiation. Nature. 2011;473:398–402. - PubMed
Publication types
MeSH terms
Substances
Grants and funding
- 5R01HD058013-05/HD/NICHD NIH HHS/United States
- R01 GM093072/GM/NIGMS NIH HHS/United States
- HD065812/HD/NICHD NIH HHS/United States
- R01 HD065812/HD/NICHD NIH HHS/United States
- HHMI/Howard Hughes Medical Institute/United States
- R01 CA151535/CA/NCI NIH HHS/United States
- CA151535/CA/NCI NIH HHS/United States
- R01 HD058013/HD/NICHD NIH HHS/United States
- GM093072-01/GM/NIGMS NIH HHS/United States
- DK088190-01A1/DK/NIDDK NIH HHS/United States
- R01 DK088190/DK/NIDDK NIH HHS/United States
LinkOut - more resources
Full Text Sources
Other Literature Sources
Molecular Biology Databases
Research Materials
