Maternal fucosyltransferase 2 status affects the gut bifidobacterial communities of breastfed infants - PubMed (original) (raw)
doi: 10.1186/s40168-015-0071-z. eCollection 2015.
Sarah M Totten 2, Jennifer T Smilowitz 1, Mina Popovic 3, Evan Parker 4, Danielle G Lemay 5, Maxwell L Van Tassell 6, Michael J Miller 6, Yong-Su Jin 6, J Bruce German 1, Carlito B Lebrilla 2, David A Mills 7
Affiliations
- PMID: 25922665
- PMCID: PMC4412032
- DOI: 10.1186/s40168-015-0071-z
Maternal fucosyltransferase 2 status affects the gut bifidobacterial communities of breastfed infants
Zachery T Lewis et al. Microbiome. 2015.
Abstract
Background: Individuals with inactive alleles of the fucosyltransferase 2 gene (FUT2; termed the 'secretor' gene) are common in many populations. Some members of the genus Bifidobacterium, common infant gut commensals, are known to consume 2'-fucosylated glycans found in the breast milk of secretor mothers. We investigated the effects of maternal secretor status on the developing infant microbiota with a special emphasis on bifidobacterial species abundance.
Results: On average, bifidobacteria were established earlier and more often in infants fed by secretor mothers than in infants fed by non-secretor mothers. In secretor-fed infants, the relative abundance of the Bifidobacterium longum group was most strongly correlated with high percentages of the order Bifidobacteriales. Conversely, in non-secretor-fed infants, Bifidobacterium breve was positively correlated with Bifidobacteriales, while the B. longum group was negatively correlated. A higher percentage of bifidobacteria isolated from secretor-fed infants consumed 2'-fucosyllactose. Infant feces with high levels of bifidobacteria had lower milk oligosaccharide levels in the feces and higher amounts of lactate. Furthermore, feces containing different bifidobacterial species possessed differing amounts of oligosaccharides, suggesting differential consumption in situ.
Conclusions: Infants fed by non-secretor mothers are delayed in the establishment of a bifidobacteria-laden microbiota. This delay may be due to difficulties in the infant acquiring a species of bifidobacteria able to consume the specific milk oligosaccharides delivered by the mother. This work provides mechanistic insight into how milk glycans enrich specific beneficial bacterial populations in infants and reveals clues for enhancing enrichment of bifidobacterial populations in at risk populations - such as premature infants.
Keywords: Bifidobacteria; Breastfeeding; FUT2; Human milk oligosaccharides; Infant; Marker gene sequencing; Secretor; Short-chain fatty acids.
Figures
Figure 1
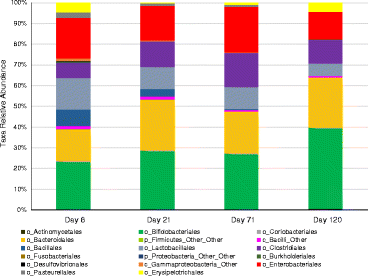
Average fecal bacterial populations in the infant cohort over time. Taken from order-level or higher classification levels of the marker gene sequencing data.
Figure 2
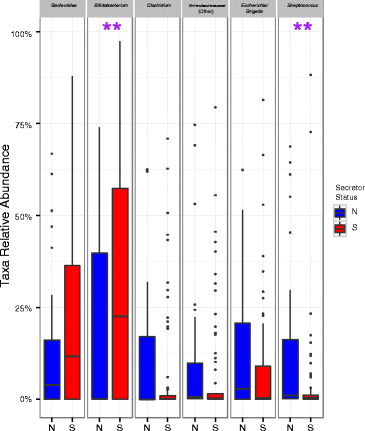
Comparison of relative levels of gut microbiota in secretor-fed infants and non-secretor-fed infants. Asterisks indicate significant differences (p < 0.05) in the relative levels of various gut microbes using a Wilcoxon rank sum test. The color boxplots show the quartiles above and below the median; the dark line near the center of the box denotes the median. The whiskers extend to the first and fourth quartiles, and the black dots show outliers. N = non-secretor, S = secretor.
Figure 3
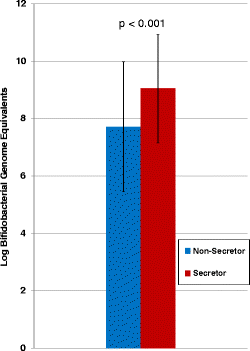
Average absolute levels of bifidobacteria in secretor versus non-secretor-fed infants (all samples of each secretor status averaged together). The one-tailed type three _t_-test p value was <0.001.
Figure 4
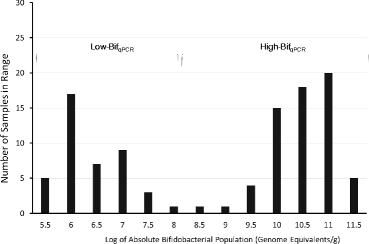
Histogram of absolute bifidobacterial populations. Bimodal distribution of results from bifidobacterial qPCR showing the lack of intermediate levels.
Figure 5
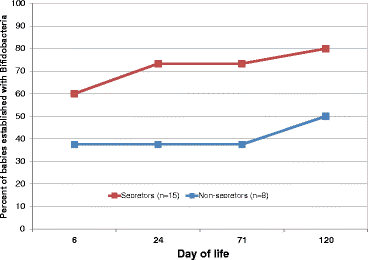
Percentage of infants with high bifidobacteria over time. Based on when each qualifying infant crossed the cutoff point of 108.5 bifidobacterial genome equivalents/gram feces. Infants qualified for this analysis by having the appropriate time points available to know when they are first established with bifidobacteria; for example, if the day 6 sample is missing, it is impossible to know if the infant was established at that time or not, and thus, that infant was excluded from this analysis.
Figure 6
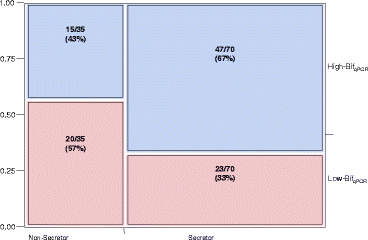
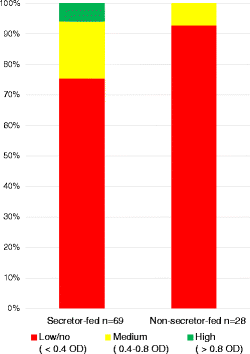
Contingency plot of secretor status by bifidobacterial content. Pearson chi-square test was significant (p = 0.0171), indicating that mother’s secretor status and infant bifidobacteria levels are dependent variables. A Fisher’s exact test yielded p = 0.015.
Figure 7
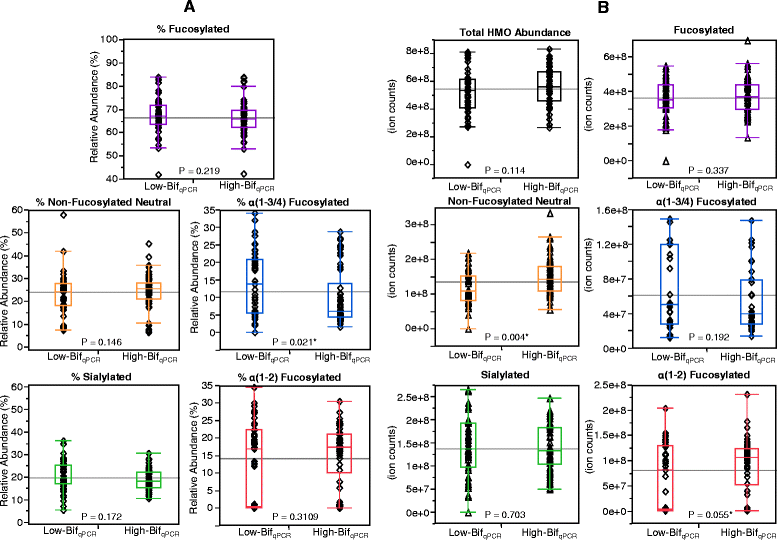
Differences in milk HMOs fed to infants that were High-Bif qPCR or Low-Bif qPCR in the corresponding feces. (A) shows relative abundance and (B) shows absolute abundance. The p values are from a two-tailed unpaired _t_-test. * = Significant at 95% confidence level. HMO = human milk oligosaccharide.
Figure 8
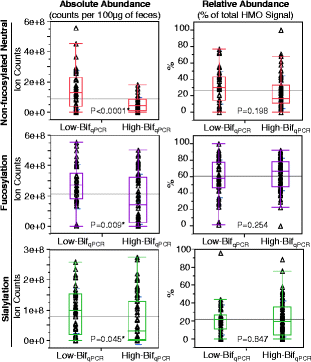
Differences in fecal HMOs between samples that were either High-Bif qPCR or Low-Bif qPCR . The p values are from a two-tailed unpaired _t_-test. * = Significant at 95% confidence level. HMO = human milk oligosaccharide.
Figure 9
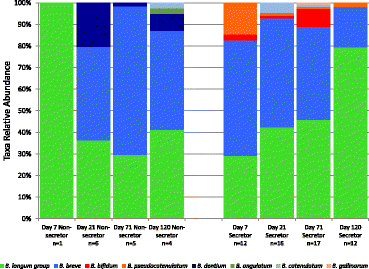
Bifidobacterial isolates obtained from fecal samples. Data from 382 isolates from 38 babies across 73 samples. Eight species of bifidobacteria were detected. The B. longum group and B. breve were the most commonly detected. Other species detected include B. pseudocatenulatum, B. catelanum, B. gallinarum, B. bifidum, B. dentium, and B. angulatum. Non = non-secretor-fed, Sec = secretor-fed, and n = number of samples from which isolates were obtained. The ‘n’ denotes the number of samples represented in each bar, not the number of isolates.
Figure 10
Bifidobacterial isolates growth on 2′-fucosyllactose. The OD achieved by each strain during growth on 2′-fucosyllactose (2FL) was compared with the OD obtained in the absence of sugar source as a negative control and lactose as a positive control. This difference in OD (ΔOD) was used as a parameter to evaluate the strain’s ability to grow on the 2FL.
Figure 11
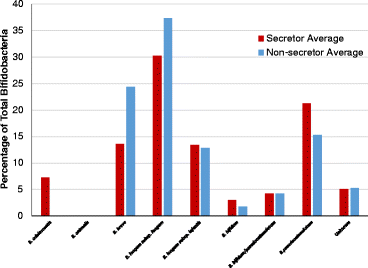
Bifidobacterial species content: secretor versus non-secretor. Based off of Bif-TRFLP (bifidobacteria-specific terminal restriction fragment length polymorphism) and BLIR (Bifidobacterium longum/infantis ratio) data. Some peaks in the electropherogram from Bif-TRFLP could correspond to either B. bifidum or B. pseudocatenulatum and are listed as such in their own category.
Figure 12
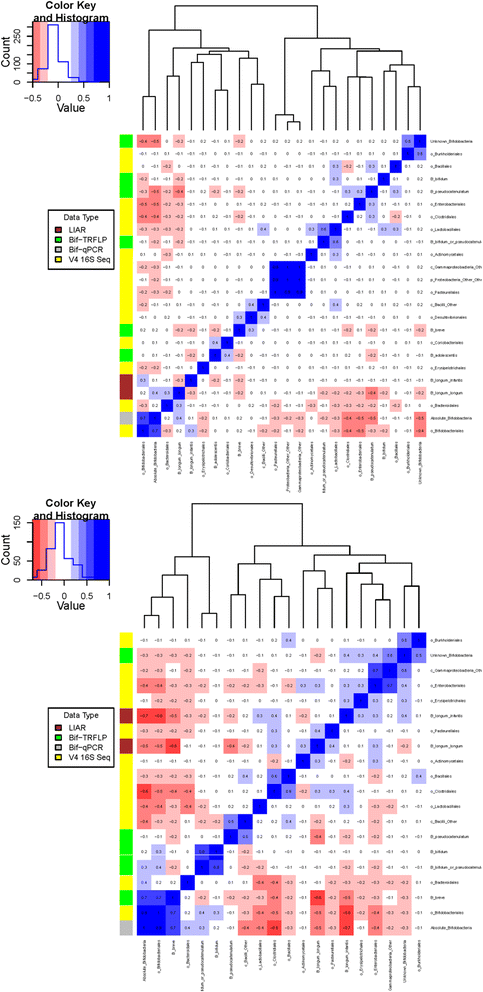
Pearson correlation matrices. Correlating the results of Bif-TRFLP (bifidobacteria-specific terminal restriction fragment length polymorphism), qPCR, V4 16S amplicon sequencing, and BLIR (Bifidobacterium longum/infantis ratio) in non-secretor-fed (bottom) and secretor-fed (top) infants. The number in each box is the Pearson correlation coefficient. The colored bar on the left side of the matrix indicates what type of data the row is. Negative correlations are colored in shades of red and positive correlations are shown in shades of blue.
Figure 13
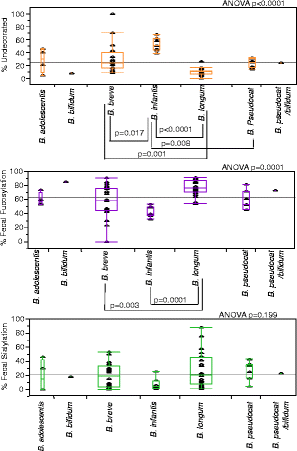
Differences in the amount of fecal HMOs in infants dominated by different species of bifidobacteria. Only samples that were High-BifqPCR were included in this figure.
Figure 14
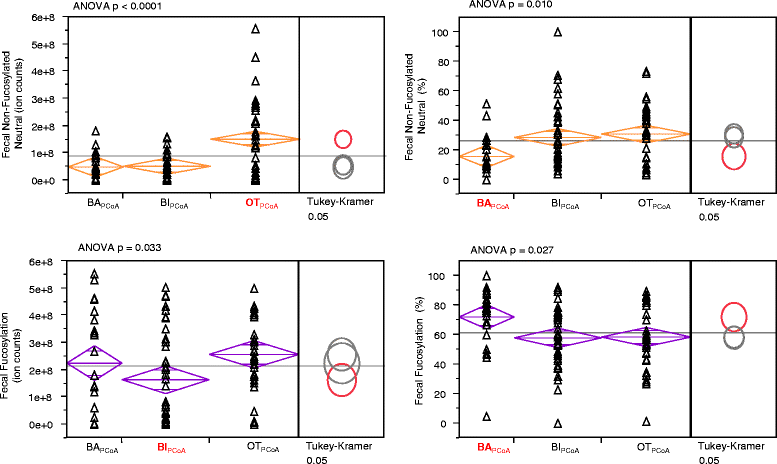
Differences in the amount of fecal HMOs in infants of each PCoA group. Differences in the amount of each HMO class remaining in the feces of samples that fell into each of the three main PCoA categories BAPCoA = Bacteroides, BIPCoA = Bifidobacterium, OTPCoA = other taxa.
Figure 15
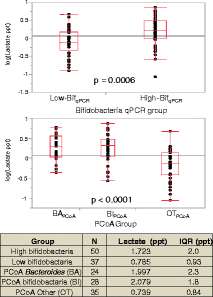
Lactate concentrations by bifidobacteria qPCR group or PCoA group. qPCR group (top) or PCoA group (bottom). The p values are from a two-tailed Student’s _t_-test. BAPCoA = Bacteroides, BIPCoA = Bifidobacterium, OTPCoA = other taxa.
Similar articles
- Maternal breast-milk and intestinal bifidobacteria guide the compositional development of the Bifidobacterium microbiota in infants at risk of allergic disease.
Grönlund MM, Gueimonde M, Laitinen K, Kociubinski G, Grönroos T, Salminen S, Isolauri E. Grönlund MM, et al. Clin Exp Allergy. 2007 Dec;37(12):1764-72. doi: 10.1111/j.1365-2222.2007.02849.x. Epub 2007 Oct 16. Clin Exp Allergy. 2007. PMID: 17941914 Clinical Trial. - Gut microbiota comparison of vaginally and cesarean born infants exclusively breastfed by mothers secreting α1-2 fucosylated oligosaccharides in breast milk.
Tonon KM, Morais TB, Taddei CR, Araújo-Filho HB, Abrão ACFV, Miranda A, de Morais MB. Tonon KM, et al. PLoS One. 2021 Feb 8;16(2):e0246839. doi: 10.1371/journal.pone.0246839. eCollection 2021. PLoS One. 2021. PMID: 33556125 Free PMC article. Clinical Trial. - Fucosylated Human Milk Oligosaccharides and N-Glycans in the Milk of Chinese Mothers Regulate the Gut Microbiome of Their Breast-Fed Infants during Different Lactation Stages.
Bai Y, Tao J, Zhou J, Fan Q, Liu M, Hu Y, Xu Y, Zhang L, Yuan J, Li W, Ze X, Malard P, Guo Z, Yan J, Li M. Bai Y, et al. mSystems. 2018 Dec 26;3(6):e00206-18. doi: 10.1128/mSystems.00206-18. eCollection 2018 Nov-Dec. mSystems. 2018. PMID: 30637338 Free PMC article. - Plant Glycan Metabolism by Bifidobacteria.
Kelly SM, Munoz-Munoz J, van Sinderen D. Kelly SM, et al. Front Microbiol. 2021 Feb 4;12:609418. doi: 10.3389/fmicb.2021.609418. eCollection 2021. Front Microbiol. 2021. PMID: 33613480 Free PMC article. Review. - Host-derived glycans serve as selected nutrients for the gut microbe: human milk oligosaccharides and bifidobacteria.
Katayama T. Katayama T. Biosci Biotechnol Biochem. 2016;80(4):621-32. doi: 10.1080/09168451.2015.1132153. Epub 2016 Feb 3. Biosci Biotechnol Biochem. 2016. PMID: 26838671 Review.
Cited by
- Review on Bifidobacterium bifidum BGN4: Functionality and Nutraceutical Applications as a Probiotic Microorganism.
Ku S, Park MS, Ji GE, You HJ. Ku S, et al. Int J Mol Sci. 2016 Sep 14;17(9):1544. doi: 10.3390/ijms17091544. Int J Mol Sci. 2016. PMID: 27649150 Free PMC article. Review. - Epithelial glycosylation in gut homeostasis and inflammation.
Goto Y, Uematsu S, Kiyono H. Goto Y, et al. Nat Immunol. 2016 Oct 19;17(11):1244-1251. doi: 10.1038/ni.3587. Nat Immunol. 2016. PMID: 27760104 Review. - Recent Advances in the Microbial Production of Human Milk Oligosaccharides.
Pressley SR, McGill AS, Luu B, Atsumi S. Pressley SR, et al. Curr Opin Food Sci. 2024 Jun;57:101154. doi: 10.1016/j.cofs.2024.101154. Epub 2024 Mar 12. Curr Opin Food Sci. 2024. PMID: 39399461 Free PMC article. - Diversity of Human Milk Oligosaccharides and Effects on Early Life Immune Development.
Ayechu-Muruzabal V, van Stigt AH, Mank M, Willemsen LEM, Stahl B, Garssen J, Van't Land B. Ayechu-Muruzabal V, et al. Front Pediatr. 2018 Sep 10;6:239. doi: 10.3389/fped.2018.00239. eCollection 2018. Front Pediatr. 2018. PMID: 30250836 Free PMC article. Review. - Breaking the Glyco-Code of HIV Persistence and Immunopathogenesis.
Colomb F, Giron LB, Trbojevic-Akmacic I, Lauc G, Abdel-Mohsen M. Colomb F, et al. Curr HIV/AIDS Rep. 2019 Apr;16(2):151-168. doi: 10.1007/s11904-019-00433-w. Curr HIV/AIDS Rep. 2019. PMID: 30707400 Free PMC article. Review.
References
Grants and funding
- R01 HD061923/HD/NICHD NIH HHS/United States
- R01 HD065122/HD/NICHD NIH HHS/United States
- R21 AT006180/AT/NCCIH NIH HHS/United States
- R01 HD059127/HD/NICHD NIH HHS/United States
- R01 AT008759/AT/NCCIH NIH HHS/United States
- R01 AT007079/AT/NCCIH NIH HHS/United States
LinkOut - more resources
Full Text Sources
Other Literature Sources
